Báo cáo khoa học: Spectroscopic investigation of the reaction mechanism of CopB-B, the catalytic fragment from an archaeal thermophilic ATP-driven heavy metal transporter potx
Bạn đang xem bản rút gọn của tài liệu. Xem và tải ngay bản đầy đủ của tài liệu tại đây (656.63 KB, 15 trang )
Spectroscopic investigation of the reaction mechanism of
CopB-B, the catalytic fragment from an archaeal
thermophilic ATP-driven heavy metal transporter
Christian Vo
¨
llmecke, Carsten Ko
¨
tting, Klaus Gerwert and Mathias Lu
¨
bben
Lehrstuhl fu
¨
r Biophysik, Ruhr-Universita
¨
t Bochum, Germany
Introduction
The biological role of P-type ATPases is ATP-driven
transport of ions against their concentration gradients
along membranes. They form a heterogeneous super-
family, which has been divided into several categories
according to sequence similarity and substrate specific-
ity [1]. Among these, the Ca- and Na ⁄ K-ATPases
belong to the well-studied class II enzymes. Another
large group (class Ib) comprises the so-called CPX-
ATPases, which are responsible for the import or
export of soft metals, such as copper, zinc, silver, lead,
cobalt or cadmium.
CPX-ATPases are evolutionarily related and have a
common architecture, consisting of a hydrophobic part
with a predicted eight transmembrane helices, in which
the central ion binding site resides. Their peripheral
part is extensively hydrophilic and contains several
structural and functional modules, such as nucleotide
binding (N), phosphorylation (P), actuator (A) and
heavy metal binding (HMA) domains.
During the catalytic cycle, P-type ATPases, also
called E1E2-ATPases, undergo ordered large-scale
domain movements, in which ion translocation is
coupled to the energy released from ATP hydrolysis.
Starting from the E1 state, with high binding affinity
for the substrates (ions and nucleotides) on one side
of the membrane, the terminal c-phosphate group of
ATP is transiently transferred to a conserved aspartic
acid, forming a covalently bound aspartyl-phosphate
Keywords
fluorescence spectroscopy;
Fourier-transform infrared spectroscopy;
heavy metal translocation; P-type ATPase;
reaction mechanism
Correspondence
M. Lu
¨
bben, Lehrstuhl fu
¨
r Biophysik,
Ruhr-Universita
¨
t Bochum, Universita
¨
tsstr.
150, D-44780 Bochum, Germany
Fax: +49 234 32 14626
Tel: +49 234 32 24465
E-mail:
(Received 14 May 2009, revised 24 July
2009, accepted 21 August 2009)
doi:10.1111/j.1742-4658.2009.07320.x
The mechanism of ATP hydrolysis of a shortened variant of the heavy
metal-translocating P-type ATPase CopB of Sulfolobus solfataricus was
studied. The catalytic fragment, named CopB-B, comprises the nucleotide
binding and phosphorylation domains. We demonstrated stoichiometric
high-affinity binding of one nucleotide to the protein (K
diss
1–20 lm). Mg
is not necessary for nucleotide association but is essential for the phospha-
tase activity. Binding and hydrolysis of ATP released photolytically from
the caged precursor nitrophenylethyl-ATP was measured at 30 °C by infra-
red spectroscopy, demonstrating that phosphate groups are not involved in
nucleotide binding. The hydrolytic kinetics was biphasic, and provides
evidence for at least one reaction intermediate. Modelling of the forward
reaction gave rise to three kinetic states connected by two intrinsic rate
constants. The lower kinetic constant (k
1
= 4.7 · 10
)3
s
)1
at 30 °C) repre-
sents the first and rate-limiting reaction, probably reflecting the transition
between the open and closed conformations of the domain pair. The subse-
quent step has a faster rate (k
2
=17· 10
)3
s
)1
at 30 °C), leading to prod-
uct formation. Although the latter appears to be a single step, it probably
comprises several reactions with presently unresolved intermediates. Based
on these data, we suggest a model of the hydrolytic mechanism.
Abbreviations
cgATP, caged ATP; mant-ATP, 3¢-N-methylanthraniloyl-ATP; AMPPNP, adenosine 5’(b,c-imido)triphosphate.
6172 FEBS Journal 276 (2009) 6172–6186 ª 2009 The Authors Journal compilation ª 2009 FEBS
intermediate. The phosphorylated E1 state switches
to the phosphorylated E2 state with low affinity for
the substrate ion, which is released to the other side
of the membrane after hydrolysis of the phosphoryl
bond. Extensive information about the catalytic
mechanism has been obtained from investigations of
various P-type ATPases [2–5]. Many details on the
molecular function and structural models of ground
state and various intermediate states have been
obtained for Ca-ATPase [6], which is regarded as
virtually paradigmatic for the P-type ATPases.
Ca-ATPase and Na ⁄ K-ATPase have been extensively
investigated by time-resolved FTIR absorbance differ-
ence spectroscopy using various nucleotides and nucleo-
tide analogues [7–13]. These studies have suffered from
the fact that the described mammalian proteins could
only be purified from native tissue material. The holo-
proteins were difficult to express in Escherichia coli,
which precluded the use of site-directed mutant proteins
or group-specific isotopically labelled proteins for spec-
tral comparisons, which are crucial for assignment of
protein-associated absorbance difference bands.
Bacterial CPX-ATPases consist of a single subunit
and can be readily expressed in the heterologous host
Escherichia coli. Proteins of this subclass are therefore
suited for site-directed mutagenesis, and would be ideal
candidates for the study of molecular reaction mecha-
nisms. However, the 3D structure, which would be
enormously helpful in understanding the molecular
mechanism of CPX-ATPase, is unknown. Previously,
various attempts at comparative modelling have created
a structural model of the holoenzyme [14–16]. Using
‘divide and conquer’ strategies, the partial 3D structures
of various modules have been determined, such as the
HMA domain of the CPX-ATPases of Listeria mono-
cytogenes and Bacillus subtilis, the N ⁄ P and A domains
of Archaeoglobus fulgidus CopA and the N ⁄ P domains
of Sulfolobus solfataricus CopB [17–21]. In order to
study the reaction mechanism of the ATPase, we
explored here whether a truncated variant of CopB could
act as model for the holoenzyme. Therefore, the soluble
catalytic fragment CopB-B, comprising the hydrophilic
N ⁄ P domains of CopB from Sulfolobus solfataricus
(Fig. 1) was probed. The activities of the catalytic
fragment were investigated using enzymological, fluores-
cence [22] and infrared spectroscopy [23] methods.
Results
Nucleotide binding to CopB-B
The catalytic fragment N ⁄ P, also called CopB-B, con-
sists of the nucleotide binding and phosphorylation
domains of the thermophilic CPX-ATPase CopB from
S. solfataricus. It was expressed in E. coli, crystallized
in a nucleotide-free state, and its structure was deter-
mined [21] (see Fig. 1). The domains are connected by
hinge peptides, which allow substantial flexibility of
both domains relative to each other. The domains
appear to be in a so-called closed orientation, into
which the substrate nucleotide, ATP, has been
modelled by superposition on the nucleotide-bound
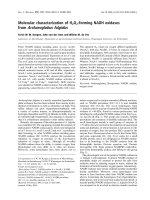
structure of Ca-ATPase (Fig. 1). The purine moiety fits
into a cleft of the nucleotide-binding domain, whereas
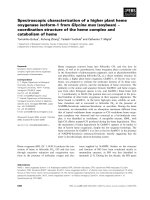
Fig. 1. 3D structural model of the catalytic fragment CopB-B of the
heavy metal-translocating CPX-ATPase CopB from Sulfolobus solfa-
taricus (PDB code 2IYE). The protein is displayed in half-transparent
molecular surface representation, and the conserved phosphoryl-
atable Asp416 is shown. The adenine nucleotide shown was
modelled after structural superposition with the ADP ⁄ AlF
3
-bound
structure of Ca-ATPase (PDB code 1WPE).
C. Vo
¨
llmecke et al. Hydrolytic mechanism of the catalytic CPx-ATPase domain
FEBS Journal 276 (2009) 6172–6186 ª 2009 The Authors Journal compilation ª 2009 FEBS 6173
the phosphate groups are located in the vicinity of the
phosphorylation domain. It should be taken into
account that our model of the nucleotide-bound state
of CopB-B is relatively crude with respect to the phos-
phate region, and should not be interpreted as assign-
ing possible protein interaction sites to functional
groups of the substrate [21].
The binding interaction of CopB-B with various
adenine nucleotides under stoichiometric conditions
was qualitatively verified by gel filtration of the nucleo-
tide ⁄ protein complex and subsequent analysis of the
nucleotides of the collected fractions using high-perfor-
mance liquid chromatography on a reverse-phase
column (see Appendix S1). Equilibrium binding of
nucleotides was quantitatively investigated using the
fluorescent analogue 3¢-N-methylanthraniloyl-ATP
(mant-ATP) (Fig. 2). Binding to the protein at saturat-
ing nucleotide concentrations resulted in a 4.5-fold
increase of emission intensity, demonstrating that the
fluorophore becomes positioned in a location that is
less exposed to quenching molecules. In addition, the
emission peak shifts from 444 to 434 nm, indicating
that, upon binding, the fluorescent substituent moves
from the hydrophilic solvent into the more hydropho-
bic protein environment (Fig. 2A). To assess the speci-
ficity of binding, we displaced the bound mant-ATP
by addition of excess ATP. The kinetic dissociation of
the mant-ATP ⁄ protein complex appears to be rela-
tively rapid, as the process could not be resolved
within the manual mixing time. This reversible ligand
competition shows that the nucleotide portion of the
analogue is responsible for the specific interaction with
the protein.
A titration of the nucleotide binding site under stoi-
chiometric conditions (i.e. when the molar concentra-
tions of mant-ATP and protein have values much
greater than K
diss
) resulted in a linear increase of fluo-
rescence with ligand addition up to the saturation
point, and above it in constant fluorescence (data not
shown). Extrapolating the lines to their intercept gave a
binding stoichiometry of one nucleotide per CopB-B
fragment.
For determination of the binding constant K
diss
, the
conditions were adjusted such that the concentrations
of mant-ATP and protein were of the same order as
the expected K
diss
. The hyperbolically shaped titration
A
B
C
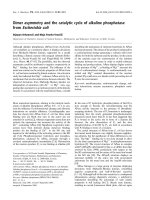
Fig. 2. Equilibrium binding of CopB-B with nucleotides. (A) Fluores-
cence spectra of 0.5 l
M mant-ATP in 5 mM Na ⁄ Mes buffer, pH
6.2, at room temperature in the absence (dashed lines) or presence
(continuous lines) of CopB-B in large stoichiometric excess (15 l
M).
(B) Fluorescence titration of 0.5 l
M mant-ATP with CopB-B. The
fluorescence at emission wavelength 434 nm is given in arbitrary
units; [E
t
] = total concentration of CopB-B. (C) Determination of
ligand dissociation constants from competitive titrations of 0.5 l
M
CopB-B with mant-ATP in the presence of the indicated total con-
centrations ([L
0
]) of ATP (squares), ADP (circles) and AMP (trian-
gles) for determination of the apparent K
app
diss
. Data were analyzed
according to Eqn (4). The bars indicate K
app
diss
errors from individual
fits of titration curves obtained at fixed competitor concentrations.
Hydrolytic mechanism of the catalytic CPx-ATPase domain C. Vo
¨
llmecke et al.
6174 FEBS Journal 276 (2009) 6172–6186 ª 2009 The Authors Journal compilation ª 2009 FEBS
curve under experimental condition 1 described in the
Experimental procedures (mant-ATP held constant) is
shown in Fig. 2B. A non-linear regression fit of the
measured data results in a binding constant of 1 lm
according to Eqn (1). The same results were obtained
when titrations were performed under experimental
condition 2 (protein held constant). Nucleotide binding
was highly sensitive to the salt concentration, with the
K
diss
increasing to 40 lm at 100 mm NaCl or
(NH
4
)
2
SO
4
. Notably, binding does not require Mg
2+
;
the affinity is reduced by a factor of 10 in the presence
of 1 mm MgCl
2
(Table 1).
The binding specificity of the protein to mant-ATP
can be demonstrated by its displacement by other
nucleotides that are added in slight excess to the
complex. It is clear from the displacement of bound
mant-ATP by ATP and related compounds that these
nucleotides interact with the same protein binding
site. Ligand competition could thus be exploited for
determination of binding constants of non-fluorescent
nucleotides. According to Eqn (4), the apparent affin-
ity K
app
diss
of CopB-B for mant-ATP is significantly
increased with higher concentrations of competitor
nucleotide. Based on a series of fluorescence titrations
of mant-ATP to CopB-B in the presence of various
competitor concentrations [L
0
], the binding constant of
the nucleotide can be determined from the slope of
the linear plot of the apparent binding constants K
app
diss
and [L
0
]. With the ligand ATP, a binding constant
K
lig
diss
of 10 lm was obtained (Fig. 2C). The non-hydro-
lysable analogue adenosine 5¢(b,c-imido)triphosphate
(AMPPNP) had binding properties comparable to
those of ATP (Table 1). Structural modification of the
purine moiety had no significant effect, as ATP and
GTP showed affinities in the same order of magnitude.
On the other hand, ADP, the product of the ATPase
reaction, bound to CopB-B with approximately half of
the affinity of ATP. AMP had a comparable K
lig
diss
of
approximately 30 lm (Table 1), which indicates that
the b- and c-phosphate groups are less important for
the binding process than the base ⁄ sugar part. A
remarkable observation is the binding of caged ATP
(cgATP) with an affinity similar to that of ATP
(Table 1), which was verified independently by HPLC
(see Fig. S1).
Catalytic activity
During catalytic activity, the c-phosphate of ATP is
transiently transferred onto the strictly conserved
aspartic acid located in the phosphorylation domain,
which is Asp416 in CopB-B [21]. In the P-type ATPase
holoprotein, the A domain comes into contact with the
N ⁄ P domain pair, promoting the hydrolysis reaction
by release of inorganic phosphate from the phosphory-
lated intermediate state [5]. Formation of the phos-
phorylated intermediate of CopB-B with the substrate
ATP has been shown previously [24], as well as its
hydrolytic activity with the artificial substrate p-nitro-
phenyl phosphate, even though the A domain is absent
in this construct. This is probably due to thermal
activation of the phosphatase reaction. The catalytic
activity using the native substrate Mg-ATP
gave approximately five times higher rates, amounting
to 50–70 nmol (mgÆmin)
)1
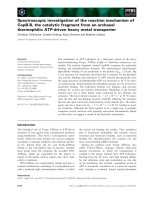
. Variation of substrate
concentration revealed a simple hyperbolic Michaelis–
Menten-type dependence and a K
M
of 1 mm, which
reflects relatively poor kinetic substrate affinity
compared with the thermodynamic ligand association
constant K
lig
diss
of ATP (Fig. 3A). Nevertheless, these
relationships are consistent because high substrate con-
centrations are needed to overcome the high-affinity
binding of the product ADP (Table 1) under kinetic
steady-state conditions. No production of inorganic
phosphate was observed in the absence of Mg
2+
, which
indicates that Mg-ATP is the substrate of CopB-B.
Furthermore, the ATPase activity increased in the
temperature interval between 20–70 °C (Fig. 3B). At
higher incubation temperature, the thermophilic protein
starts to denature. The protein is an active hydrolase
under single turnover conditions at room temperature
as demonstrated for stoichiometric loading with
Mg-ATP by HPLC analysis (data not shown). Notably,
the catalytic fragment is still active at a temperature of
30 °C, which is important with regard to our approach
to investigate the molecular reaction mechanism using
time-resolved FTIR spectroscopy (see below).
Table 1. Binding of nucleotides to the catalytic fragments of CPX-
ATPase CopB. The interaction is quantified from apparent binding
constants obtained by competitive binding titration of mant-ATP in
the presence of various concentrations of nucleotides. Unless
indicated otherwise, Mg
2+
was omitted to prevent phosphatase
activity.
Nucleotide Binding constant K
lig
diss
(lM)
a
mant-ATP
b
0.8
mant-ATP
b
⁄ 1mM MgCl
2
10.0
ATP 10.0
ADP 18.9
AMP 29.8
AMPPNP 3.5
cgATP 9.5
GTP 12.6
a
According to Eqn (4).
b
For mant-ATP in the absence of competi-
tor, the value for K
diss
is given.
C. Vo
¨
llmecke et al. Hydrolytic mechanism of the catalytic CPx-ATPase domain
FEBS Journal 276 (2009) 6172–6186 ª 2009 The Authors Journal compilation ª 2009 FEBS 6175
Molecular interaction of ATP with CopB-B
Transient reactions were routinely observed using
rapid mixing techniques. However, these are difficult
to perform in the case of time-resolved FTIR spectros-
copy. The use of cuvettes with an optical path length
of less than 10 lm is imperative due to the high absor-
bance of water in the infrared region. Under these cir-
cumstances, the reaction mechanism of the ATPase
can best be studied by release of ATP from the caged
precursor compound cgATP by photochemical activa-
tion according to the following reaction scheme:
where k
ph
represents the kinetic constant describing
the fast photolytic cleavage of the caged compound. It
is clear from equilibrium binding of cgATP (Table 1)
that the CopB-BÆcgATP complex has already formed
before photolysis. To this end, samples were prepared
in special FTIR cuvettes with high concentrations of
CopB-B and the Mg
2+
complex of cgATP. The com-
ponents were present at a 1 : 1 ratio in order to pre-
vent more than a single catalytic turnover. Upon light
activation for an integrated duration of 0.12 s, the
genuine substrate is released.
In order to clearly differentiate the post-flash IR
absorbance signals into the photochemical processes of
ATP release [25] and the subsequent hydrolytic protein
reactions, the photochemical non-enzymatic process,
which is strongly dependent on temperature and the
pH of the medium, must be the fastest reaction step.
The rapid appearance of positive absorbance changes
at 1123 cm
)1
generated from free cgATP (Fig. 4A,
continuous line) and from cgATP in the presence of
CopB-B (Fig. 4A, dotted line) within the phosphate
region of the infrared spectrum is indicative of product
formation. This band was assigned to the symmetric
stretching vibration of the c-PO
3
2)
group of ATP [25],
thus providing information on the photochemical
release rate of ATP from its caged precursor molecule.
The time course of the difference band corresponds to
rates of 4 and 7 s
)1
in the presence or absence of
CopB-B, respectively, which demonstrates that the
release of ATP is much faster than all subsequent
partial reactions (see below), and, furthermore, gives a
constant reference line for the pre-photolytic state of
CopB-BÆATP after less than 2 s (Fig. 4A).
Static photolysis spectrum and phosphate band
assignment
The absorbance difference bands that are directly visi-
ble in the spectra after photolysis of cgATP and those
resolved by global fit analysis (see below) were assigned
using substrate isotopologues [26]. The IR difference
spectrum recorded directly after photo-release indicates
the binding state of the pre-existing CopB-BÆATP com-
plex before the start of hydrolysis (Fig. 4B). Negative
difference bands at 1525 and 1347 cm
)1
refer to the
symmetric and anti-symmetric vibrations of the NO
2
group in cgATP identified previously [25]. For compari-
son and further band assignment, spectra were run
under identical conditions with ATP isotopically
labelled at specific positions, i.e. by chemical substitu-
tion of
16
O for
18
O in the phosphate groups. The
increase in weight results in higher reduced masses of
the molecular oscillators and therefore lowering of the
A
B
Fig. 3. Catalytic properties of CopB-B. (A) Substrate kinetics of
10 l
M CopB-B with Mg-ATP at 70 °C. (B) Temperature dependence
of 10 l
M CopB-B at an Mg-ATP concentration of 5 mM. The pH of
the Na ⁄ Mes incubation medium at various temperatures was kept
constant between 5.9 and 6.2.
Scheme 1.
Hydrolytic mechanism of the catalytic CPx-ATPase domain C. Vo
¨
llmecke et al.
6176 FEBS Journal 276 (2009) 6172–6186 ª 2009 The Authors Journal compilation ª 2009 FEBS
vibrational frequencies. As a typical example, Fig. 4C
shows the photolysis spectrum of CopB-B with ATP
and c-
18
O
4
-ATP, respectively. The positive band at
1137 cm
)1
observed in the
16
O compound is down-
shifted to 1089 cm
)1
in the c-
18
O
4
-labelled ATP, and
this band can therefore be assigned to the anti-symmet-
ric stretching vibration of the c-phosphate group [m
a
(c-PO
3
2)
)]. Minor deviations of the observed band
frequencies from tabulated values could relate to the
pH dependence of phosphate resonances and their
shifts induced by formation of Mg complexes [25,27].
Further band assignments are summarized in
Table 2 (corresponding spectra not shown). It is worth
noting that, in the CopB-B-bound state, the phosphate
vibrations are coupled, as seen for example in the
absorbance band at 1123 cm
)1
, which is shifted to
1101 cm
)1
irrespective of placement of the
18
O label in
the b or a group. Strong phosphate coupling is other-
wise known only for nucleotides in free aqueous solu-
tion [26]. In sharp contrast to CopB-B, phosphate
coupling is abolished in the case of the GTP-binding
protein Ras, in which phosphate absorbances are
significantly shifted with respect to the non-bound
state [26] and coupling between the a and b groups is
removed. The close similarity of IR difference spectra
of nucleotides in the presence and absence of CopB-B
leads to the conclusion that the phosphate groups of
ATP apparently do not contribute significantly to the
formation of the nucleotide–protein complex; instead
they are positioned in a hydrophilic environment or
even remain solvent-exposed.
Dynamic interaction of ATP with CopB-B:
time-resolved hydrolysis spectra revealing a
reaction intermediate
After rapid release of the substrate ATP, its hydrolysis
was observed to occur at comparatively low rates. As
a control, the time course of the absorbance changes
after photo-release was recorded in the spectral range
from 1000–1800 cm
)1
in the absence of protein, which
demonstrates insignificant spectral contributions from
cgATP and its photolysis alone (for details, see
Fig. S2). Upon elimination of the data related to the
A
B
C
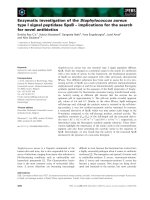
Fig. 4. Investigation of the ATPase reaction by FTIR spectroscopy.
(A) Time course of ATP photo-release from cgATP. The absorbance
changes of the symmetric coupled a,b-phosphate band of ATP at
1123 cm
)1
(cgATP photolysed in presence of CopB-B, continuous
line; cgATP photolysed alone, dotted line) were recorded by rapid-
scan FTIR spectroscopy. (B) Photolysis spectra of cgATP in the
presence (continuous line) and absence of CopB-B (dotted line).
The difference spectrum was obtained after 2 s, when ATP was
fully released. (C) Principle of band assignment of phosphate absor-
bance difference bands in the photolysis spectrum by means of
18
O-labelled phosphates (dotted line). The reference spectrum
(continuous line) was obtained with unlabelled ATP. The absor-
bance difference band (hatched upwards) is downshifted to another
position (hatched downwards) in the spectrum obtained using
c-
18
O
4
-labelled ATP under otherwise identical conditions.
C. Vo
¨
llmecke et al. Hydrolytic mechanism of the catalytic CPx-ATPase domain
FEBS Journal 276 (2009) 6172–6186 ª 2009 The Authors Journal compilation ª 2009 FEBS 6177
extremely fast initial photolytic phase (Fig. 4A), the
relatively slow hydrolytic reaction rates were kinetical-
ly analysed by global fitting. We were able to simulate
the spectral absorbance changes by multi-exponential
regression analysis with two rate constants k
1
app
and
k
2
app
. Thus, to describe the overall hydrolysis reaction,
we derived a tentative working model displayed in
Scheme 2, consisting of the pre-hydrolytic initial state
(CopB-BÆATP), an intermediate (I) and a final state
(CopB-BÆADP):
In addition to the quickly formed so-called photoly-
sis spectrum ‘CopB-BÆATP–CopB-BÆcgATP’ (Fig. 4B),
the consecutive reaction of the three protein states
connected by the two apparent rate constants is repre-
sented by two amplitude difference spectra )a
1
and
)a
2
for the two rate constants k
1
app
(Fig. 5A, top) and
k
2
app
(Fig. 5A, bottom). Under the applied reaction
conditions, the first amplitude spectrum (k
1
app
) could
be resolved with a rate constant of 1.9 · 10
)2
s
)1
(Fig. 5A, top) and the second with a rate constant
(k
2
app
)of5· 10
)3
s
)1
(Fig. 5A, bottom).
Kinetic modelling of CopB-B’s ATPase reaction
If the apparent rate constants k
1
app
and k
2
app
derived
from the global fitting differ only by a factor of four,
as in our case (Table 3), analysis of the spectral com-
ponents of the amplitude spectra )a
1
and )a
2
(Fig. 5A) becomes complicated due to mixing of states.
In such a case, apparent and intrinsic rate constants
often deviate drastically from each other. For deter-
mination of intrinsic rate constants for the ATP hydro-
lysis, we applied the kinetic modelling program
KinTek Global Kinetic ExplorerÔ [28] using the fol-
lowing model (Scheme 3) with intrinsic rate constants
k
1
, k
)1
, k
2
and k
)2
:
In order to determine the intrinsic rate constants, we
assumed that the concentration changes of CopB-
BÆATP, the intermediate I and P
i
are proportional to the
absorption changes at 1255 cm
)1
(v
as
a-b-ATP band),
1338 cm
)1
(unidentified protein side chain band) and
1078 cm
)1
(inorganic phosphate band), respectively. In
addition, we normalized both the starting reactant
(educt) absorbance at 1255 cm
)1
and the product absor-
bance at 1078 cm
)1
, so that c
0
(CopB-BÆATP) = c
¥
(P
i
) = 1 and c
¥
(CopB-BÆATP) = c
0
(P
i
) = 0. Due to
the unknown absorption coefficient of the intermediate
I, we arbitrarily averaged both normalization factors for
CopB-BÆATP and P
i
to obtain a reference for its relative
concentration. Based on these assumptions, we consid-
ered models 1 and 2 described below.
Model 1 is a simulation based on free parameter
optimisation of the program, and yields k
1
= 4.7 ·
10
)3
s
)1
, k
)1
= 3.0 · 10
)4
s
)1
, k
2
= 1.7 · 10
)2
s
)1
and
Table 2. Assignment of phosphate vibration detected in the Mg-adenine nucleotide complexes of CopB-B by means of
18
O-labelled ATP iso-
topologues.
Spectrum according
to global fit v (cm
)1
) Band assignment
Band position after shift upon addition of isotopolog
Deflection of the
difference band
d
18
O
4
-c (cm
)1
)
18
O
3
-b (cm
)1
)
18
O
2
-a (cm
)1
)
Photolysis 1123 v
s
a-b-ATP
a
1101 1101 u
1137 v
as
c-ATP 1089 u
1213 v
as
b-a-ATP 1206 u
1250 v
as
a-b-ATP sp.
b
u
)a
1
c
1108 ATP ⁄ ADP sp. d
)a
2
1078 v
s
(PO
2
)
) phosphate 1043 u
1098 v b-ADP sp. u
1136 v
as
c-ATP sp. d
1220 v
as
a-ADP sp. u
1255 v
as
a-b-ATP sp. sp. d
a
Assignment to more than one phosphate group indicates strong vibrational coupling [27].
b
sp., superposed. Absorbance difference bands
disappear upon isotopic labelling, but shifts are not observed due to complex band superposition.
c
Amplitude spectra corresponding to the
apparent rate constants k
1
app
and k
2
app
due to global fitting.
d
u = upward, d = downward.
Scheme 2.
Scheme 3.
Hydrolytic mechanism of the catalytic CPx-ATPase domain C. Vo
¨
llmecke et al.
6178 FEBS Journal 276 (2009) 6172–6186 ª 2009 The Authors Journal compilation ª 2009 FEBS
k
)2
=1.0 · 10
)4
s
)1
(Table 3). The corresponding con-
centration profiles of the three components (Fig. 6A)
agree well with our normalized data (squares), indicat-
ing reasonable selection of scaling factors. The main fea-
tures of this kinetic model are that k
2
> k
1
(k
2
$ k
1
app
;
k
1
$ k
2
app
), and that back reactions are negligible. The
faster decline of the intermediate compared to its forma-
tion leads to only small concentrations of intermediate I
during the reaction. The maximum concentration of I is
approximately one-eighth of that of c
0
(CopB-BÆATP).
This is similar to the relatively small absorbance change
at 1338 cm
)1
compared to 1078 or 1255 cm
)1
, and thus
in line with our measurements.
In model 2, parameters were fixed as suggested by
global fitting, namely k
1
> k
2
and k
1
= k
1
app
, and
k
2
= k
2
app
and k
)1
= k
)2
= 0. Given these assump-
tions, Fig. 6B shows that the measured normalized
absorbance at 1255 cm
)1
, indicative of the time course
of educt concentration, clearly deviates from its calcu-
lated concentration profile. Moreover, this simulation
yields notably higher concentrations of the intermedi-
ate than the former model.
To further check the rationality and stability of our
model assumptions, we varied the extinction coefficient
of the intermediate I for both models 1 and 2 (see Dis-
cussion and Fig. S3). In neither case did the simulated
curves give better fits to the measured data than the
ones displayed in Fig. 6A. Of even greater significance
than the extinction coefficient of the intermediate I are
the concentration profiles of educt and product, which
both match optimally with curve fit 1. In summary, fit
1, based on program-chosen intrinsic constants, maps
the time course of the reactant concentrations much
better than fit 2, based on fixed constants; fit 1 therefore
supports a credible model. The data from model 1 were
thus used to calculate the relative contributions of the
states to the amplitude spectra )a
1
and )a
2
of the
global fit as detailed in Appendix S1. The result of this
calculation is that the bands facing upwards in )a
1
(Fig. 5A, top) derive from the intermediate state, and
A
B
Fig. 5. FTIR spectroscopic measurement of the ATPase reaction as
performed by CopB-B, initiated by flash-initiated substrate liberation
of ATP from cgATP. Rapid scan spectra recorded with a repetition
time of 185 ms (using double-sided forward–backward mode) fitted
to two rate constants by global fit analysis, k
1
app
= 1.9 · 10
)2
s
)1
and k
2
app
=5· 10
)3
s
)1
, starting from 2 s after the flash. The band
labelled X is an artefact that also occurs in the sample without pro-
tein. (A) Amplitude spectra corresponding to the rate k
1
app
()a
1
, top)
and the rate k
2
app
()a
2
, bottom). (B) Band assignment verifying
phosphate production in the k
2
app
transition by comparison of ampli-
tude spectra recorded with
16
O (continuous line) and
18
O (dotted
line) ATP isotopologues (top) and after double difference calculation
(
16
O–
18
O difference spectra) (bottom). The hatched zones indicate
the loss of c-ATP in the precursor state and the formation of
inorganic phosphate at the final stage of the phosphatase reaction.
Table 3. Kinetic constants obtained by various theoretical methods
of examination.
Kinetic step
a
Rate constant
b
(s
)1
)
First k
1
app
1.9 · 10
)2
k
1
4.7 · 10
)3
k
)1
3.0 · 10
)4
Second k
2
app
5.0 · 10
)3
k
2
1.7 · 10
)2
k
)2
1.0 · 10
)4
a
The steps are defined according to Schemes 2 or 3.
b
Rate con-
stants were calculated by data approximation via global fit [apparent
rate constants (k
i
app
)] or via kinetic modelling (model 1; k
i
).
C. Vo
¨
llmecke et al. Hydrolytic mechanism of the catalytic CPx-ATPase domain
FEBS Journal 276 (2009) 6172–6186 ª 2009 The Authors Journal compilation ª 2009 FEBS 6179
the bands facing downwards derive from the final ADP
state. The intensities are 38% compared to pure states.
The bands facing downwards in )a
2
derive from both
the intermediate state (38%) and the initial ATP state,
and the bands facing upwards in )a
2
derive from the
final ADP state.
The intermediate state during ATP hydrolysis
As the absorbances of the intermediate are facing
upwards in )a
1
and downwards in )a
2
(Fig. 5A), the
appearance and disappearance of a band at 1338 cm
)1
may be regarded as a marker of this intermediate. It
represents an unknown absorbing group of the protein,
because absorbances in this region are clearly distinct
from the phosphate vibrations. Furthermore, the
amplitude spectra displayed in Fig. 5A indicate signifi-
cant changes in the broad amide I band centered at
approximately 1650 cm
)1
, and especially pronounced
at 1676 cm
)1
, and in the amide II band position at
1546 cm
)1
. This is not unexpected, as it is known that
P-type ATPases undergo remarkable structural
changes during catalysis. Another interesting feature is
the reproducible occurrence of small positive and nega-
tive absorbance difference signals in the carbonyl
region of the IR spectra in the region of 1720–
1740 cm
)1
, seen in both the )a
1
and )a
2
amplitude
spectra (Fig. 5A). Signals in this region point to the
prevalence of protonated aspartic or glutamic acid side
chains either undergoing protonation ⁄ deprotonation
reactions or conformational reorganizations.
End product state of CopB-B-catalysed ATP
hydrolysis
As mentioned above, the bands of the end product are
the bands facing upwards in )a
2
(Fig. 5A, bottom).
The shift of the positive band from 1078 to 1043 cm
)1
upon c-
18
O-ATP labelling clearly demonstrates the for-
mation of free inorganic phosphate in the product
state, which becomes obvious in the absorbance differ-
ence, and especially in the double difference spectrum
(Fig. 5B). Further product bands are found at 1220
and 1098 cm
)1
, which are assigned to the a and b
vibrations of the hydrolysis product ADP (Table 2).
Isotopic labelling at the c-
18
O-ATP position shifts the
negative m
s
c-ATP band from 1136 to 1108 cm
)1
(Fig. 5B, curved arrow). As expected, the negative
bands at 1255 and 1136 cm
)1
(Fig. 5A, bottom) corre-
spond well with the positive bands in the photolysis
spectrum (Fig. 4B) from a-, b- and c-coupled ATP
vibrations (Table 2).
Discussion
CopB-B is a suitable model to study ATP
hydrolysis of the P-type ATPase CopB
We have measured significant basal ATPase activity of
CopB in absence of the heavy metals (M. Zoltner &
M. Lu
¨
bben, unpublished observations). Similarly,
metal-independent hydrolytic activity has also been
observed with the CPX-ATPase CopA of Thermo-
toga maritima [29]. CopB-B can mimic the effects of
A
B
Fig. 6. Time course of computed reactant concentrations after
kinetic modelling of the reaction between CopB-B and ATP. The
normalized concentrations of reactants were plotted as fractions of
1 over time (educt CopB-BÆATP, red line; reaction intermediate I,
black line; product inorganic phosphate P
i
, blue line). In addition,
the normalized measured absorbances of educt at 1255 cm
)1
(CopB-BÆATP), of reaction intermediate at 1338 cm
)1
(unidentified
protein functional group) and of product at 1078 cm
)1
(inorganic
phosphate P
i
) are plotted (squares). Simulations were performed
under the two conditions: fit 1, for which intrinsic rate constants
k
1
, k
2
, k
)1
and k
)2
were optimized using the program KinTek Global
Kinetic ExplorerÔ (continuous lines) (A), and fit 2, for which fixed
rate constants k
1
= k
1
app
and k
2
= k
2
app
, k
)1
= k
)2
= 0 were chosen
(B).
Hydrolytic mechanism of the catalytic CPx-ATPase domain C. Vo
¨
llmecke et al.
6180 FEBS Journal 276 (2009) 6172–6186 ª 2009 The Authors Journal compilation ª 2009 FEBS
CopB-ATPase, which are entirely independent of the
translocated heavy metals, as the fragment naturally
carries out ‘uncoupled’ hydrolytic activity. Our efforts
demonstrate that spectroscopic methods can be used to
study the substrate binding and catalytic activity of the
hyperthermophilic Sulfolobus enzyme CopB, because it
is easily handled at room temperature. The catalytic
fragment CopB-B, consisting of nucleotide-binding
and phosphorylation domains, is the natively folded
‘business end’ of the holoenzyme CopB. It is expected
that this fragment, whose 3D structure is known,
behaves similarly to the holoenzyme with respect to
ATP hydrolysis and thus serves as a model of it. The
protein is capable of forming an intermediate with
covalently bound inorganic phosphate [24], and has
considerable ATPase activity despite the absence of the
actuator domain (A domain), which is considered to
promote rapid cleavage of the aspartyl phosphate
bond in Ca-ATPase [30]. At 30 °C, the ATP hydrolysis
rate of CopB-B is fairly low, but still allows observa-
tion of the reaction with substrate produced from
cgATP under single turnover conditions with a half-life
of approximately 3 min.
Nucleotide binding to CopB-B
In order to precisely define the reaction conditions of
the spectroscopically observed CopB-B reaction with
ATP, the interaction of nucleotides with CopB-B was
explored by direct equilibrium binding or competition
assays using the fluorescent nucleotide mant-ATP. As
has also been observed with other purine nucleotides,
cgATP has high affinity for CopB-B, which proves
that, within the applied concentration range of the
FTIR experiments ([cgATP]
0
>> K
diss
lig
(cgATP)), a
complex between the components has already formed
before photolysis. After laser flash photolysis of
cgATP, the substrate ATP is released at the position
of its binding site, so this aspect of complex associa-
tion can be ignored for the kinetic interpretation of
our data.
The nucleotide binding spectrum of CopB-B
obtained immediately after photolysis (Fig. 4B) shows
a striking similarity to the spectrum of free ATP,
which is in sharp contrast to observations made with
several GTP-binding proteins such as Ras, Ran, Rab,
Rap and Rho, which exhibit vibrational uncoupling of
the phosphate resonances and significant shifts of the
a, b and c absorbance bands, resulting from strong
interactions of phosphate groups with amino acid side
chains lining the nucleotide binding site of the protein
[26,31–34]. It is concluded that, in CopB-B, the phos-
phates stay in contact with the solvent, and the tightly
bound ATP becomes immobilized by other molecular
parts of the nucleotide, presumably the purine moiety,
which apparently protrudes into a binding pocket
formed by CopB-B as seen in Fig. 1.
CopB-B interacts with ATP in a multi-step
process
ATP hydrolysis of CopB-B apparently includes two
phases. These are kinetically resolved by global fit
analysis and reflect the formation and decay of a single
observable reaction intermediate. Given the many
intermediates that have been recognized during the
reaction mechanism of P-type ATPases [2,35], more
than one intermediary state would also be expected to
occur during observation of hydrolysis with FTIR
spectroscopy. For example, there is spectral evidence
for protonated carboxyl groups, of which one is
expected as a potential phosphate acceptor in P-type
ATPases [13], within the absorbance region of 1720–
1740 cm
)1
(Fig. 5A,B). Spectroscopic signatures of a
transiently phosphorylated aspartic acid, as demon-
strated earlier for Ca-ATPase [12], could not be
resolved in our samples. Details on the as yet unre-
solved catalytic steps may be disclosed after careful
adjustment of reaction conditions by either freezing
otherwise invisible intermediates or investigating
site-specific mutants.
Kinetic process of ATP hydrolysis
Kinetic modelling requires theoretical values for cata-
lytic events as an input, but delivers a more detailed
interpretation of measured data than global fitting.
Obvious deviations from recorded absorbance data
occur, as in fit 2 (Fig. 6B), in which the intrinsic rate
constants were arbitrarily chosen as equal to the
apparent constants. In contrast, concentration profiles
closely matched the absorbance time courses in the
case where the intrinsic constants were adjusted (fit 1,
Fig. 6A). The educt decrease (CopBÆATP) takes place
with the slower intrinsic rate k
1
, and the product
increase (P
i
) proceeds with the faster rate constant k
2
.
Therefore, a relatively low concentration of intermedi-
ate is seen, as the decay rate k
2
of intermediate I is
faster than its production rate k
1
. The slower rate k
1
should be associated to the first process after release of
ATP, i.e. the conformational change of CopB-B
leading to the ‘closed conformation’. In this step, the
hydrophilic environment of the phosphate groups of
ATP is substituted by a specific catalytic environment
within a binding pocket of the protein. This should
induce dramatic absorption changes within the phos-
C. Vo
¨
llmecke et al. Hydrolytic mechanism of the catalytic CPx-ATPase domain
FEBS Journal 276 (2009) 6172–6186 ª 2009 The Authors Journal compilation ª 2009 FEBS 6181
phate region [26]. The absence of more intense phos-
phate absorbance difference bands in our measure-
ments further supports the kinetic model in which
k
2
> k
1
, because the concentration of the reaction
intermediate is low, giving rise to only weak absorp-
tion changes. Thus, we conclude that the rate-deter-
mining step of our reaction is the slow ‘snapping‘
process of the domains to the intermediate I form with
rate constant k
1
. The conformational rearrangements
involved in this ‘snapping’ are shown by the relatively
large change in the amide I band upon intermediate
formation, and the subsequent reversal of this change
during the product formation. Once this catalytically
active conformation is formed, the subsequent
processes are fast. The reaction intermediate could
be CopB-BÆATP in a short-lived ‘closed conformation’
or another rapidly forming and decaying, and so far
unresolved, state.
A model of CopB-B-catalysed ATP hydrolysis
Our data on equilibrium binding and kinetic features
of CopB-B can be combined to form a consistent
hypothetical model of the ATP hydrolysis reaction
sequence (Fig. 7). CopB-B in its ‘open conformation’,
with distant nucleotide-binding and phosphorylation
domains, binds nucleotides such as mant-ATP, ATP,
ADP and cgATP with relatively high affinity even in
the absence of Mg
2+
, as represented by species 1. A
pre-photolytic state complex of CopB-B loaded with
cgATP (species 1a) could easily be transformed to the
ATP-bound state (species 1) by UV irradiation. For
electrostatic reasons, the open conformation may be
even more favoured in the nucleotide-bound state,
because a number of negatively charged amino acid
side chains are located close to the phosphorylatable
Asp416 [21], and may reject the strongly charged
triphosphate. Substrates could be attached by their
purine ⁄ ribose moieties to the binding cleft of the nucle-
otide-binding domain, and the phosphates project into
the solution. No hydrolysis occurs in the absence of
Mg
2+
, but, after its addition, the readily formed
Mg-ATP complex partially attenuates the electrostatic
repulsion, allowing by approximation of both
domains with k
1
the slow adoption of a closed confor-
mation (species 2). The ‘snapping’ of domains would
initiate a rapid succession of catalytic steps (species 3
and 4 in Fig. 7), of which the existence of aspartyl-
phosphate and non-covalently bound phosphate states
has been proven in earlier experiments [21,24]. Because
these states have not yet been time-resolved by IR
spectroscopy, they are tentatively combined as interme-
diate I (Fig. 7, species 2–4). Species 5 is the final state
after a single substrate turnover; it represents CopB-B
with ADP bound with high affinity but dissociated
inorganic phosphate due to its low affinity for CopB-B
Fig. 7. Schematic model of the interaction
of ATP and cgATP with CopB-B during catal-
ysis. The nucleotide-binding and phosphory-
lation domains are shown as indented oval
symbols; they are connected by a short
linker and can adopt ‘open’ or ‘closed’
orientations. Various nucleotides (species 1
and 1a) bind to the open conformation (spe-
cies 0). Slow transition (at k
1
) to the closed
conformation (species 2) is followed by
rapid transition to the phosphorylated form
(species 3) and nucleotide ⁄ phosphate-bound
form (species 4). Species 2–4 cannot be
resolved spectroscopically and are grouped
as intermediate I. The rapidly produced
ADP-bound species 5 (at k
2
) is the end
product under single turnover conditions
adjusted for infrared spectroscopic measure-
ments whereas during steady-state catalysis
the bound ADP is displaced by ATP to initi-
ate another round of substrate hydrolysis.
See text for further details.
Hydrolytic mechanism of the catalytic CPx-ATPase domain C. Vo
¨
llmecke et al.
6182 FEBS Journal 276 (2009) 6172–6186 ª 2009 The Authors Journal compilation ª 2009 FEBS
[21]. However, under steady-state turnover conditions,
the tightly bound ADP could become readily displaced
by the substrate ATP, which is present in vast excess,
offering an explanation of why the K
M
value of the
ATPase reaction is relatively high compared with the
fairly low equilibrium binding constant K
diss
lig
of ATP.
Conclusions
Partial reactions of the CPX-ATPase holoenzyme
CopB can be investigated using the catalytic fragment
CopB-B. Despite the fact that no information on the
fate of the translocated heavy metal ion can be
obtained, the nucleotide-binding ⁄ phosphorylation dou-
ble domain of CopB-B alone exhibits high-affinity
ATP binding, protein phosphorylation and ATPase
activity. After binding of ATP to the nucleotide-bind-
ing domain, the first rate-limiting step consists of asso-
ciation of nucleotide and phosphorylation domains to
allow the subsequent second step involving rapid phos-
phoryl transfer and phosphoenzyme hydrolysis, which
are not yet resolved. As such, the fragment CopB-B
can be regarded as a valuable simple tool to facilitate
simulation of the partial reactions at a less-complex
level than the highly demanding holoenzyme.
Experimental procedures
Purification of CopB-B
Heterologous expression of the N ⁄ P catalytic fragment
(CopB-B) of Sulfolobus solfataricus in E. coli and its purifi-
cation were performed as described previously [21]. After
the last concentration step, the protein was shock frozen in
small aliquots. Samples were thawed immediately prior to
the experiments. Protein content was determined by the
bicinchoninic acid method [36].
Synthesis of nucleotide analogues
mant-ATP (see Fig. 2A for structural formula) was synthe-
sized using the procedure described previously [37]. Synthe-
sis of cgATP (see Fig. 4A for structural formula) and its
isotopologues, which photo-release ATP labelled with
18
O
at certain phosphate positions, was performed for a-[
18
O
2
]-
cgATP as described previously [38,39], and for b-[
18
O
3
]-
cgATP and [b,c-
18
O,c-
18
O
3
]-cgATP (here termed [c-
18
O
4
])
using a procedure analogous to that described by Du et al.
[40]. Coupling of the 2-nitrophenylethyl caged group to the
terminal phosphate was performed as described previously
[41]. The concentration of cgATP was determined spectro-
photometrically using an extinction coefficient (e
260
)of
26 600 m
)1
Æcm
)1
.
Fluorescence spectroscopy and equilibrium
binding of nucleotides
Fluorescence measurements were performed using a Jasco-
6500 instrument (Jasco, Gross-Umstadt, Germany) oper-
ated at room temperature. By excitation at 356 nm, emis-
sion spectra were recorded between 400 and 500 nm, at a
scanning speed of 200 nmÆmin
)1
and bandwidths of 3 nm, a
response time of 0.5 s, and with a constant photomultiplier
voltage of 600 V.
Equilibrium binding of mant nucleotides
Binding studies were performed at room temperature in
1mL Na⁄ Mes buffer, pH 6.2, with and excitation wave-
length of 356 nm and an emission wavelength of 434 nm.
Stoichiometric titrations were performed by adding up to
50 lm of CopB-B in small intervals to a constant concen-
tration of mant-ATP (25 lm) (for details, see Results and
Discussion). Data were obtained 30 s after addition of the
ligand. Read-outs were corrected for dilution due to the
added volumes. Titrations for determination of K
diss
were
performed in two ways. In the first method, the concentra-
tion of mant-ATP or mant-ADP (0.5 lm) was kept
constant, and small amounts of CopB-B (between 0 and
15 lm) were added from a 200 lm stock solution. The
binding data were calculated as described previously [42]
using the formula
F ¼ F
0
þ
EA½
A
t
½
F
1
ð1Þ
where F
0
indicates the initial fluorescence intensity in the
absence of protein, F indicates the measured fluorescence
intensity at a given concentration of CopB-B (dependent
variable), and F
¥
indicates the fluorescence intensity at sat-
urating concentration of protein. [A
t
] represents the total
concentration of ligand (independent variable), and [EA]
is the actual concentration of the mant-ATP–CopB-B
complex, which is given by
EA ¼ððE
t
½þK
diss
þ½A
t
Þ À ðð½E
t
þK
diss
þ½A
t
Þ
2
À 4 E
t
½A
t
½Þ
0:5
Þ=2 ð2Þ
where [E
t
] indicates the total concentration of the added
CopB-B protein. The measured data were fitted to the bind-
ing equation by means of a non-linear regression algorithm
implemented within the computer program ORIGIN
(OriginLab Corporation, Northamptonm, MA, USA).
In the second method, the conditions were as described
above except that the concentration of CopB-B was kept
constant ([E
t
] = 0.5 lm) and small amounts of mant
nucleotide ([A
t
], varying between 0 and 14 lm) from a
stock solution of 200 lm mant-ATP or mant-ADP were
added. Corrections for the fluorescence increase of free
C. Vo
¨
llmecke et al. Hydrolytic mechanism of the catalytic CPx-ATPase domain
FEBS Journal 276 (2009) 6172–6186 ª 2009 The Authors Journal compilation ª 2009 FEBS 6183
mant-ATP were performed in parallel experiments. In this
case, the binding data are calculated by the formula
F ¼ F
0
þ
EA½
E
t
½
F
1
ð3Þ
Equilibrium binding of other nucleotides in the
presence of mant-ATP
For determination of binding constants of non-fluorescent
nucleotides, a series of competition titration experiments
[43] were performed as described above for the second
method, but with the additional presence of 0, 5, 10, 20 or
25 lm of the competitor nucleotide. In this case, the binding
constant K
diss
of mant-ATP (in the absence of competitor)
increases to the apparent binding constant K
app
diss
(in the pres-
ence of competitor). Under the assumption that the free
concentration of competitor ligand [L] is negligible
compared to its total concentration [L
0
], the apparent
binding constant for mant-ATP is expressed as
K
app
diss
¼ K
diss
1 þ
L
0
½
K
lig
diss
!
ð4Þ
in which K
diss
represents the binding constant of the
mant-ATP complex in the absence of competitor, and
K
lig
diss
represents the binding constant of the competitor
ligand. K
lig
diss
may be read from the slope of the linear plot
of the apparent binding constant K
app
diss
versus the total
concentrations of competitor ligand [L
0
].
ATPase activity assay
The hydrolytic activity of CopB-B was measured by a modifi-
cation of the procedure described previously [44], quantifying
the liberated inorganic phosphate. Samples of 10 lm CopB-B
(final concentration) were incubated in a volume of 100 lLin
a medium containing 60 mm Na ⁄ Mes, pH 6.2, 10 mm MgCl
2
,
5mm ATP, for 20 min at 70 °C. The reaction was stopped by
addition of 400 lL molybdate reagent, which contained
0.5% w ⁄ v (NH
4
)
2
Mo
7
O
24
,2%w⁄ vH
2
SO
4
and 0.5% w ⁄ v
SDS, and colour formation was induced using 20 lL of 10%
w ⁄ v ascorbic acid. To correct for non-enzymatic phosphate
release, samples without protein were run in parallel. After
shaking for 2 min at room temperature, the absorbance was
read at 750 nm using an Ultrospec-3000 spectrophotometer
(GE Healthcare, Munich, Germany). The concentrations of
liberated phosphate were determined from a linear standard
curve by averaging the readings of five samples.
Sample preparation for FTIR spectroscopy
A notched CaF
2
window of 2 mm thickness and 20 mm
width was greased using Apiezon (M&I Materials Ltd.,
Manchester, UK) and covered with a 3 lm Mylar spacer
(DuPont de Nemours, Bad Homburg, Germany) at its
outer circumference. A mixture of 300 lg (10.7 nmol)
CopB-B in 5 mm Na ⁄ Mes, pH 6.2, and 10.7 nmol cgATP
in 10 lL of a buffer containing 25 mm Na ⁄ Mes, pH 6.2,
2mm MgCl
2
,10mm DTT, was deposited on top in a cen-
tral position, gently evaporated to dryness under a nitro-
gen stream, and subsequently rehydrated by addition of
0.7 lL of water. The resulting final concentrations were
357 mm Na ⁄ Mes, pH 6.2, 28.6 mm MgCl
2
, 143 mm DTT,
15.3 mm cgATP and 15.3 mm CopB-B.
Measurement of FTIR spectra and mathematical
data conversion
After sample equilibration for 5 h at 30 °C, spectra were
recorded using a IFS66VS vacuum instrument (Bruker
Optik, Ettlingen, Germany) equipped with a liquid nitro-
gen-cooled mercury cadmium telluride detector. An excimer
laser (Lambda Physics, Dieburg, Germany) operated with a
pulse energy of 130–140 mJ (output read from an internal
power meter) at 308 nm was used to photoactivate cgATP
by 60 flashes with pulse durations of 20 ns at a repetition
rate of 500 Hz. The total irradiation duration (120 ms) was
sufficient to release 90% of ATP from cgATP. Interfero-
grams at a nominal resolution of 4 cm
)1
were recorded
under rapid scan conditions with low-pass filter cutting at
1950 cm
)1
and an aperture width of 3.5–4 mm using the
double-sided, forward–backward data acquisition mode and
an instrumental scanner speed of 100 kHz. Before photoly-
sis, a reference spectrum was taken by averaging 50 scans.
After light activation, interferograms were averaged in the
following order to cover approximately the time ranges
0.2–2 s (1–10; one scan), 2–60 s (11–40; 10 scans), 60–600 s
(41–70; 100 scans) and 600–1000 s (71–72; 1000 scans). The
averaged interferograms were manipulated by zero filling
using a factor of 2, and Fourier-transformed using Mertz
phase correction and the Blackman–Harris three-term
apodization function. Absorbance spectra and absorbance
time courses are displayed as differences between the light
intensity I(t) and the reference intensity I
0
of the sample
before photolysis at t = 0, namely DA(t)=)log (I(t) ⁄ I
0
).
The kinetics of spectra evolution between 950 and
1800 cm
)1
were approximated to multiple exponentials in
the period of 2–1000 s by global fit analysis [45], in which
the absorbance change DA(m,t) is fitted with a sum of n
exponential terms, by calculating the amplitudes a
i
(m)at
specific wavenumbers m:
DAðm; tÞ¼
X
n
i¼1
a
i
ðmÞe
Àk
app
i
t
À
X
n
i¼1
a
i
ðmÞþa
ph
ðmÞð5Þ
where a
ph
(m) represents the amplitude of the initial state
after photolysis and k
i
app
the apparent rate constants. For
convenience, the physical quantity of )a
i
(m) is displayed in
the amplitude spectra.
Hydrolytic mechanism of the catalytic CPx-ATPase domain C. Vo
¨
llmecke et al.
6184 FEBS Journal 276 (2009) 6172–6186 ª 2009 The Authors Journal compilation ª 2009 FEBS
Kinetic modelling
Simulation of concentration profiles of educts, products
and reaction intermediates by means of the intrinsic rate
constants k
1
and k
2
as well as k
)1
and k
)2
was performed
using the program KinTek Global Kinetic ExplorerÔ
(KinTek Corporation, Austin, TX, USA) [28] using a
model according to Scheme 3 (see above).
Acknowledgements
We thank Dr Yan Suveyzdis for chemical synthesis of
the isotopologues of cgATP and Ingo Rekittke for the
preparation of mant nucleotides. This work was
supported by grants LU405 ⁄ 3-1 from the Deutsche
Forschungsgemeinschaft and I ⁄ 78128 from the Volks-
wagenStiftung to M.L.
References
1 Palmgren MG & Axelsen KB (1998) Evolution of
P-type ATPases. Biochim Biophys Acta 1365, 37–45.
2 Kaplan JH (2002) Biochemistry of Na,K-ATPase. Annu
Rev Biochem 71, 511–535.
3 Jørgensen PL, Hakansson KO & Karlish SJ (2003)
Structure and mechanism of Na,K-ATPase: functional
sites and their interactions. Annu Rev Physiol 65,
817–849.
4Ku
¨
hlbrandt W (2004) Biology, structure and mechanism
of P-type ATPases. Nat Rev Mol Cell Biol 5, 282–295.
5 Toyoshima C & Inesi G (2004) Structural basis of ion
pumping by Ca
2+
-ATPase of the sarcoplasmic
reticulum. Annu Rev Biochem 73, 269–292.
6 Toyoshima C, Nomura H & Sugita Y (2003) Structural
basis of ion pumping by Ca
2+
-ATPase of sarcoplasmic
reticulum. FEBS Lett 555, 106–110.
7 Liu M & Barth A (2003) TNP-AMP binding to the
sarcoplasmic reticulum Ca
2+
-ATPase studied by infra-
red spectroscopy. Biophys J 85, 3262–3270.
8 Barth A, von Germar F, Kreutz W & Ma
¨
ntele W
(1996) Time-resolved infrared spectroscopy of the
Ca
2+
-ATPase. The enzyme at work. J Biol Chem 271,
30637–30646.
9 Liu M & Barth A (2002) Mapping nucleotide binding
site of calcium ATPase with IR spectroscopy: effects of
ATP c-phosphate binding. Biopolymers 67, 267–270.
10 Pratap PR, Dediu O & Nienhaus GU (2003) FTIR study
of ATP-induced changes in Na
+
⁄ K
+
-ATPase from
duck supraorbital glands. Biophys J 85, 3707–3717.
11 Stolz M, Lewitzki E, Ma
¨
ntele W, Barth A & Grell E
(2006) Inhibition and partial reactions of Na,K-ATPase
studied by Fourier transform infrared difference
spectroscopy. Biopolymers 82, 368–372.
12 Barth A (1999) Phosphoenzyme conversion of the
sarcoplasmic reticulum Ca
2+
-ATPase. Molecular
interpretation of infrared difference spectra. J Biol
Chem 274, 22170–22175.
13 Barth A & Ma
¨
ntele W (1998) ATP-induced phosphory-
lation of the sarcoplasmic reticulum Ca
2+
ATPase:
molecular interpretation of infrared difference spectra.
Biophys J 75, 538–544.
14 Wu CC, Rice WJ & Stokes DL (2008) Structure of a
copper pump suggests a regulatory role for its metal-
binding domain. Structure 16, 976–985.
15 Lu
¨
bben M, Portmann R, Kock G, Stoll R, Young MJ
& Solioz M (2009) Structural model of the CopA
copper ATPase of Enterococcus hirae based on chemical
cross-linking. Biometals 22, 363–375.
16 Chintalapati S, Al Kurdi R, van Scheltinga AC &
Ku
¨
hlbrandt W (2008) Membrane structure of CtrA3,
a copper-transporting P-type-ATPase from Aquifex
aeolicus. J Mol Biol 378, 581–595.
17 Banci L, Bertini I, Ciofi-Baffoni S, D’Onofrio M, Gon-
nelli L, Marhuenda-Egea FC & Ruiz-Duenas FJ (2002)
Solution structure of the N-terminal domain of a poten-
tial copper-translocating P-type ATPase from
Bacillus subtilis in the apo and Cu(I) loaded states.
J Mol Biol 317, 415–429.
18 Banci L, Bertini I, Ciofi-Baffoni S, Su XC, Miras R,
Bal N, Mintz E, Catty P, Shokes JE & Scott RA (2006)
Structural basis for metal binding specificity: the N-ter-
minal cadmium binding domain of the P1-type ATPase
CadA. J Mol Biol 356, 638–650.
19 Sazinsky MH, Mandal AK, Argu
¨
ello JM & Rosenzweig
AC (2006) Structure of the ATP binding domain from
the Archaeoglobus fulgidus Cu
+
-ATPase. J Biol Chem
281, 11161–11166.
20 Sazinsky MH, Agarwal S, Argu
¨
ello JM & Rosenzweig
AC (2006) Structure of the actuator domain from the
Archaeoglobus fulgidus Cu
+
-ATPase. Biochemistry 45,
9949–9955.
21 Lu
¨
bben M, Gu
¨
ldenhaupt J, Zoltner M, Deigweiher K,
Haebel P, Urbanke C & Scheidig AJ (2007) Sulfate acts
as phosphate analog on the monomeric catalytic
fragment of the CPx-ATPase CopB from Sulfolobus
solfataricus. J Mol Biol 369, 368–385.
22 Lu
¨
bben M, Lu
¨
cken U, Weber J & Scha
¨
fer G (1984)
Azidonaphthoyl-ADP: a specific photolabel for the
high-affinity nucleotide-binding sites of F
1
-ATPase. Eur
J Biochem 143, 483–490.
23 Ko
¨
tting C & Gerwert K (2005) Proteins in action
monitored by time-resolved FTIR spectroscopy.
Chemphyschem 6, 881–888.
24 Deigweiher K, Drell TL IV, Prutsch A & Lu
¨
bben M
(2004) Expression, isolation and crystallization of the
catalytic domain of CopB, a putative copper transporting
ATPase from the thermoacidophilic archaeon Sulfolobus
solfataricus. J Bioenerg Biomembr 36, 151–159.
25 Barth A (2005) Analytical time-resolved studies using
photochemical triggering methods. In Dynamic Studies
C. Vo
¨
llmecke et al. Hydrolytic mechanism of the catalytic CPx-ATPase domain
FEBS Journal 276 (2009) 6172–6186 ª 2009 The Authors Journal compilation ª 2009 FEBS 6185
in Biology (Goeldner M & Givens R eds), pp. 369–399.
Wiley-VCH Verlag, Weinheim.
26 Allin C & Gerwert K (2001) Ras catalyzes GTP hydro-
lysis by shifting negative charges from c-tob-phos-
phate as revealed by time-resolved FTIR difference
spectroscopy. Biochemistry 40, 3037–3046.
27 Wang JH, Xiao DG, Deng H, Callender R & Webb
MR (1998) Vibrational study of phosphate modes in
GDP and GTP and their interaction with magnesium in
aqueous solution. Biospectroscopy 4, 219–227.
28 Svir IB, Klymenko OV & Platz MS (2002) ‘KINFIT-
SIM’ – a software to fit kinetic data to a user selected
mechanism. Comput Chem 26, 379–386.
29 Hatori Y, Hirata A, Toyoshima C, Lewis D, Pilankatta
R & Inesi G (2008) Intermediate phosphorylation
reactions in the mechanism of ATP utilization by the
copper ATPase (CopA) of Thermotoga maritima. J Biol
Chem 283, 22541–22549.
30 Toyoshima C, Norimatsu Y, Iwasawa S, Tsuda T &
Ogawa H (2007) How processing of aspartylphosphate is
coupled to lumenal gating of the ion pathway in the
calcium pump. Proc Natl Acad Sci USA 104,
19831–19836.
31 Chakrabarti PP, Suveyzdis Y, Wittinghofer A & Gerwert
K (2004) Fourier transform infrared spectroscopy on the
Rap.RapGAP reaction, GTPase activation without an
arginine finger. J Biol Chem 279, 46226–46233.
32 Ko
¨
tting C, Blessenohl M, Suveyzdis Y, Goody RS, Wit-
tinghofer A & Gerwert K (2006) A phosphoryl transfer
intermediate in the GTPase reaction of Ras in complex
with its GTPase-activating protein. Proc Natl Acad Sci
USA 103, 13911–13916.
33 Ko
¨
tting C, Kallenbach A, Suveyzdis Y, Eichholz C &
Gerwert K (2007) Surface change of Ras enabling effec-
tor binding monitored in real time at atomic resolution.
Chembiochem 8, 781–787.
34 Chakrabarti PP, Daumke O, Suveyzdis Y, Ko
¨
tting C,
Gerwert K & Wittinghofer A (2007) Insight into
catalysis of a unique GTPase reaction by a combined
biochemical and FTIR approach. J Mol Biol 367,
983–995.
35 Inesi G (1985) Mechanism of calcium transport. Annu
Rev Physiol 47, 573–601.
36 Smith PK, Krohn RI, Hermanson GT, Mallia AK,
Gartner FH, Provenzano MD, Fujimoto EK, Goeke
NM, Olson BJ & Klenk DC (1985) Measurement of
protein using bicinchoninic acid. Anal Biochem 150,
76–85.
37 Hiratsuka T (1983) New ribose-modified fluorescent
analogs of adenine and guanine nucleotides available as
substrates for various enzymes. Biochim Biophys Acta
742, 496–508.
38 Goody RS (1982) A simple and rapid method for the
synthesis of nucleoside 5¢-monophosphates enriched
with
17
Oor
18
O on the phosphate group. Anal Biochem
119, 322–324.
39 Hoard DE & Ott DG (1965) Conversion of mono- and
oligodeoxyribonucleotides to 5-triphosphates. JAm
Chem Soc 87, 1785–1788.
40 Du X, Frei H & Kim SH (2000) The mechanism
of GTP hydrolysis by Ras probed by Fourier trans-
form infrared spectroscopy. J Biol Chem 275, 8492–
8500.
41 Cepus V, Ulbrich C, Allin C, Troullier A & Gerwert K
(1998) Fourier transform infrared photolysis studies of
caged compounds. Methods Enzymol 291, 223–245.
42 Bermingham A, Bottomley JR, Primrose WU &
Derrick JP (2000) Equilibrium and kinetic studies of
substrate binding to 6-hydroxymethyl-7,8-dihydropterin
pyrophosphokinase from Escherichia coli. J Biol Chem
275, 17962–17967.
43 Plesniak L, Horiuchi Y, Sem D, Meinenger D, Stiles L,
Shaffer J, Jennings PA & Adams JA (2002) Probing the
nucleotide binding domain of the osmoregulator EnvZ
using fluorescent nucleotide derivatives. Biochemistry
41, 13876–13882.
44 Serrano R (1988) H
+
-ATPase from plasma membranes
of Saccharomyces cerevisiae and Avena sativa roots:
purification and reconstitution. Methods Enzymol 157,
533–544.
45 Hessling B, Souvignier G & Gerwert K (1993) A
model-independent approach to assigning bacteriorho-
dopsin’s intramolecular reactions to photocycle
intermediates. Biophys J 65, 1929–1941.
Supporting information
The following supplementary material is available:
Appendix S1. Additional nucleotide binding data;
mathematical derivations; alternate kinetic fits.
Fig. S1. Binding of cgATP to CopB-B, analysed by
HPLC after centrifuged column separation of non-
bound nucleotide.
Fig. S2. Time courses of reactions of CopB-B with
photo-released ATP, observed at various wavenumbers.
Fig. S3. Alternative fitting conditions.
This supplementary material can be found in the
online version of this article.
Please note: As a service to our authors and readers,
this journal provides supporting information supplied
by the authors. Such materials are peer-reviewed and
may be re-organized for online delivery, but are not
copy-edited or typeset. Technical support issues arising
from supporting information (other than missing files)
should be addressed to the authors.
Hydrolytic mechanism of the catalytic CPx-ATPase domain C. Vo
¨
llmecke et al.
6186 FEBS Journal 276 (2009) 6172–6186 ª 2009 The Authors Journal compilation ª 2009 FEBS