Báo cáo khoa học: Polypyrimidine tract-binding protein is essential for early mouse development and embryonic stem cell proliferation potx
Bạn đang xem bản rút gọn của tài liệu. Xem và tải ngay bản đầy đủ của tài liệu tại đây (641.02 KB, 11 trang )
Polypyrimidine tract-binding protein is essential for early
mouse development and embryonic stem cell proliferation
Masaki Shibayama*, Satona Ohno*, Takashi Osaka, Reiko Sakamoto, Akinori Tokunaga,
Yuhki Nakatake, Mitsuharu Sato and Nobuaki Yoshida
Laboratory of Developmental Genetics, Center for Experimental Medicine and Systems Biology, Institute of Medical Science, University of
Tokyo, Japan
Introduction
Mouse embryonic stem (ES) cells are established from
the inner cell mass (ICM) of blastocysts. ES cells are
defined by their ability to give rise to a variety of
mature progeny while maintaining their capacity to
self-renew. Self-renewal is the process by which a stem
cell divides to generate one or two daughter stem cells
with developmental potentials that are indistinguish-
able from that of the mother cell. This process is cen-
tral to development, as well as to the maintenance of
adult tissues in complex and long-lived organisms.
Self-renewal of ES cells is coordinated by multiple
pathways, some of which are conserved among diverse
types of stem cells, but others of which are restricted
to certain cell types or tissues [1]. In some of these
pathways, alternatively spliced gene products have a
variety of functions across multiple developmental
stages [2]. In addition, computational and experimental
analyses have suggested that alternative splicing is
important for ES cell self-renewal and differentiation
[3]. However, the mechanisms by which molecules that
Keywords
cell cycle; embryonic stem cells; knockout
mouse; polypyrimidine tract-binding protein;
proliferation
Correspondence
N. Yoshida, Laboratory of Developmental
Genetics, Center for Experimental Medicine
and Systems Biology, Institute of Medical
Science, University of Tokyo, 4-6-1
Shirokanedai, Minato-ku, Tokyo 108-8639,
Japan
Fax: +81 3 5449 5455
Tel: +81 3 5449 5753
E-mail:
*These authors contributed equally to this
work
(Received 15 July 2009, revised 11
September 2009, accepted 15 September
2009)
doi:10.1111/j.1742-4658.2009.07380.x
Polypyrimidine tract-binding protein (PTB) is a widely expressed RNA-
binding protein with multiple roles in RNA processing, including the splic-
ing of alternative exons, mRNA stability, mRNA localization, and internal
ribosome entry site-dependent translation. Although it has been reported
that increased expression of PTB is correlated with cancer cell growth, the
role of PTB in mammalian development is still unclear. Here, we report
that a homozygous mutation in the mouse Ptb gene causes embryonic
lethality shortly after implantation. We also established Ptb
) ⁄ )
embryonic
stem (ES) cell lines and found that these mutant cells exhibited severe
defects in cell proliferation without aberrant differentiation in vitro or
in vivo. Furthermore, cell cycle analysis and a cell synchronization assay
revealed that Ptb
) ⁄ )
ES cells have a prolonged G
2
⁄ M phase. Thus, our
data indicate that PTB is essential for early mouse development and ES cell
proliferation.
Abbreviations
AP, alkaline phosphatase; E, embryonic day; EB, embryoid body; ES, embryonic stem; GAPDH, glyceraldehyde-3-phosphate dehydrogenase;
ICM, inner cell mass; IRES, internal ribosome entry site; LIF, leukemia inhibitory factor; PI, propidium iodide; PTB, polypyrimidine
tract-binding protein; SCID, severe combined immunodeficiency; SD, standard deviation; SSEA-1, stage-specific embryonic antigen-1.
6658 FEBS Journal 276 (2009) 6658–6668 ª 2009 The Authors Journal compilation ª 2009 FEBS
regulate alternative splicing contribute to ES cell func-
tion are still elusive.
Polypyrimidine tract-binding protein (PTB; also
known as PTBP1 ⁄ hnRNP I) is an alternative splicing
regulator that is also widely expressed also in the early
embryo [4,5]. PTB regulates alternative exon inclusion
in many genes, including Ptb itself [6,7]. PTB has also
been implicated in many aspects of mRNA regulation,
including polyadenylation [8], stabilization [9,10], tran-
scription [11], and localization [12,13]. In addition,
PTB is involved in internal ribosomal entry site
(IRES)-dependent translation of cellular and viral
genes [14,15]. PTB has two paralogs, nPTB (also
known as brPTB or PTBP2) and ROD1, which are
expressed in a tissue-restricted manner. nPTB is mostly
expressed in neurons [16,17], and ROD1 is expressed
in hematopoietic cells [18].
Recently, it has been reported that increased expres-
sion of PTB is associated with ovarian tumor cell
growth [19], and that PTB differentially affects cancer
cell malignancy, depending on the cell line [20]. In the
context of development, PTB has been shown to be
involved in germ cell differentiation in Drosophila mel-
anogaster [4], and is essential for the development of
Xenopus laevis [5]. Although the importance of PTB
for multiple biological processes has been reported, it
is still unclear how PTB contributes to mammalian
development and organogenesis. To address these
questions, we disrupted Ptb in mouse ES cells and gen-
erated Ptb knockout mice. Homozygous mutation of
Ptb resulted in embryonic lethality and revealed the
importance of PTB in mouse development. To eluci-
date the function of PTB in ES cells, we generated
Ptb
) ⁄ )
ES cells. Although Ptb
) ⁄ )
ES cells are viable,
they form compact colonies and exhibit severe defects
in cell proliferation without precocious differentiation.
Our data clearly demonstrate that PTB is essential for
mouse development and ES cell proliferation.
Results
Homozygous mutation of Ptb leads to embryonic
lethality
Previous reports have shown that Ptb is expressed in a
wide variety of mouse tissues [16,21] and has multiple
functions in somatic cells [6,8,10,12,15]. However, the
expression pattern and function of PTB in early devel-
opment have not yet been elucidated. To determine the
role of PTB in mouse development, we generated
Ptb-deficient mice through targeted gene disruption.
To introduce the null mutation for Ptb, we designed a
targeting vector to replace a 1.9 kb region of Ptb
on chromosome 10C1, including the promoter and
transcriptional start site, with a neomycin resistance
gene (Fig. 1A; see detail in Doc. S1). We introduced
the targeting vector into E14.1 ES cells by electropora-
tion, and screened G418-resistant clones for homolo-
gous recombination. Southern blot analysis showed
that seven of 240 clones were positive for homologous
recombination. To generate chimeric mice, we inde-
pendently injected two heterozygous ES cell clones
into C57BL ⁄ 6 mouse blastocysts. The chimeric mice
derived from both clones successfully transmitted the
mutated allele, and heterozygous mutant mice were
produced by breeding. Both male and female Ptb
+ ⁄ )
mice were fertile, and showed no apparent defects. To
generate Ptb
) ⁄ )
mice, we intercrossed heterozygous
mutant mice, and analyzed the genotypes of the
offspring by Southern blot and PCR. Among the 16
neonatal mice examined, no homozygous mutants were
observed (Table 1), indicating that Ptb
) ⁄ )
embryos do
not survive to birth. To determine the developmental
stage of lethality, we genotyped embryos from embry-
onic day (E) 3.5 (blastocyst stage) to E10.5. As sum-
marized in Table 1, no homozygous mutants were
observed after E6.5, whereas the genotype ratio of
embryos from E3.5 fitted the expected Mendelian
ratio. Thus, we deduced that homozygous mutation
for Ptb leads to embryonic lethality shortly after
implantation.
Characterization of Ptb
–/–
blastocysts
To assess the protein expression of PTB in mouse early
development, we performed immunohistochemical
analysis on wild-type blastocysts. We detected the
immunoreactivity of PTB both in the ICM and in the
trophectoderm (Fig. 2A). In contrast, the expression of
Oct3 ⁄ 4 and Cdx-2 was restricted exclusively to the
ICM or the trophectoderm (Fig. 2A). In order to
investigate the events surrounding implantation, we
performed the blastocyst outgrowth assay. We cultured
the blastocysts for 5 days and analyzed the genotypes
by PCR. Wild-type blastocysts exhibited normal out-
growth formations and were positive for alkaline phos-
phatase (AP) activity (Fig. 2B). In contrast, although
Ptb
) ⁄ )
blastocysts were positive for AP activity, the
growth rate of the ICM was reduced (Fig. 2B). These
results suggest that PTB is essential for embryonic
development during the peri-implantation period.
Generation of the Ptb
–/–
ES cells
The above data led us to analyze PTB function in ES
cells, as these cells are derived from the ICM. To
M. Shibayama et al. PTB in development and ES cells
FEBS Journal 276 (2009) 6658–6668 ª 2009 The Authors Journal compilation ª 2009 FEBS 6659
gain further insight into the function of PTB in ES
cells, we first tried to establish Ptb
) ⁄ )
ES cells from
Ptb
) ⁄ )
blastocysts; however, we could not obtain the
Ptb
) ⁄ )
ES cells (Table 2), probably owing to the cell
proliferation defect. Then, we attempted to disrupt
both alleles of Ptb, using a conditional gene-targeting
approach. We constructed the second conditional tar-
geting vector with a hygromycin resistance gene to
mutate the wild-type allele and make heterozygous
(Ptb
) ⁄ flox-hyg
) ES cells (Fig. 1A; see detail in Doc. S1).
In this vector, we designed three loxP sequences to
MC1 DT-A
PGK Neo
1 kb
Targeting
vector 1
Targeting
vector 2
Wild-type locus
(Chr. 10C1)
PGK Hyg
MC1 DT-A
exon 1
probe A probe B
PGK Neo
PGK Neo
PGK Neo
PGK Hyg
exon 1
Cre recombinase
Cre recombinase
Probe A
Probe B
+/+ +/–
–/–
–/flox-hyg
+/+ +/–
26.0 kb
11.4 kb
9.1 kb
9.4 kb
7.1 kb
2.7 kb
–/flox-hyg
Sm A BH Bg A Bg E Ss BH A
Sm BH BH Ss
Sm BH A
Ss
wild-type: 9.1 kb
1st targeting: 26.0 kb
2nd targeting: 11.4 kb
Probe A
Probe B
–/flox-hyg
–/flox
–/–
7.1 kb
5.2 kb
2.7 kb
Wild-type: 7.1 kb
1st targeting: 2.7 kb
2nd targeting: 9.4 kb
PGK Neo
exon 1
–/flox
Probe B
A
B
D
C
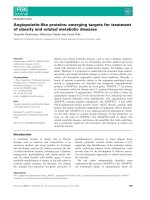
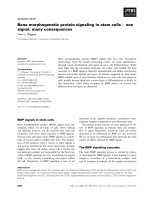
Fig. 1. Gene targeting of mouse Ptb. (A) Targeting strategy of Ptb. The mutated Ptb allele was generated by homologous recombination. (A)
A, AflII, Bg, BglII; BH, BamHI; E, EcoRI; Sm, SmaI; Ss, Sse8387I. (B) Southern blot analysis using the probes described in (A). Left panel:
digested with AflII and detected by probe A. Right panel: digested with BamHI and detected by probe B. (C) Conditional disruption of Ptb in
ES cells. Ptb
) ⁄ flox
ES cells were generated by expression of Cre in Ptb
) ⁄ flox-hyg
ES cells. Ptb
) ⁄ )
ES cells were generated by infection of
Ptb
) ⁄ flox
ES cells with a retroviral vector expressing Cre recombinase. (D) Southern blot analysis of Ptb
) ⁄ )
ES cells; digested with BamHI
and detected by probe B.
Table 1. Genotypes of offspring from Ptb
+ ⁄ )
intercross. The het-
erozygous mutant mice were intercrossed. The genotypes of off-
spring were analyzed by Southern blot and PCR analysis. Among
16 neonatal mice examined, no homozygous mutant was observed.
Stage + ⁄ ++⁄ ))⁄ ) Resorbed Total
E3.5 11 24 8 – 43
E6.5 3 9 0 3 15
E8.5 14 26 0 13 53
E10.5 13 17 0 18 48
Newborn 4 12 0 – 16
PTB in development and ES cells M. Shibayama et al.
6660 FEBS Journal 276 (2009) 6658–6668 ª 2009 The Authors Journal compilation ª 2009 FEBS
flank the hygromycin resistance gene cassette and the
1.9 kb genomic fragment containing the promoter
and transcriptional start site of Ptb (Fig. 1A). We
introduced the vector into Ptb
+ ⁄ )
ES cells, which we
generated using the first targeting vector. We screened
the hygromycin-resistant colonies for homologous
recombination, and obtained positive clones, which
were mutated at the wild-type allele (Ptb
) ⁄ flox-hyg
;
Fig. 1B). To generate Ptb
) ⁄ )
ES cells, we introduced a
Cre expression vector into Ptb
) ⁄ flox-hyg
cells by electro-
poration (Fig. 1C). Although we obtained Ptb
) ⁄ flox
cells, we failed to establish Ptb
) ⁄ )
ES cells. Then, we
expressed Cre by retrovirus infection into Ptb
) ⁄ flox
cells
(Fig. 1C). To identify Ptb
) ⁄ )
ES cells, we screened
those cells by PCR and confirmed their genotypes by
Southern blot analysis, and we successfully identified
two independent Ptb
) ⁄ )
ES cell clones () ⁄ )1 and
) ⁄ )2) (Fig. 1D). The expression of Ptb mRNA and
protein was completely abolished in both Ptb
) ⁄ )
ES
cells (Fig. 5A and Fig. S2).
–
/
–
+/+
ICM
TG
Gata4
+/+
+/
––
/
––
/
–
Fgf5
Gata6
GAPDH
PTB
SSEA-1
+/+
–/–1
–/–2
Oct3/4
Cdx2
PTB
ABE
D
0
0.5
1
1.5
2
Relative gene expression
*
**
**
C
–/–2
–/–1
+/+
–/–2
–/–1
+/+
–/–2
–/–1
+/+
–/–2
–/–1
+/+
Oct3/4 Sox2 Nanog
Rex-1
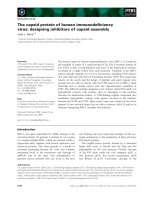
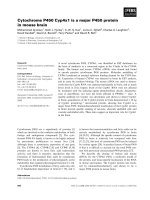
Fig. 2. Characterization of blastocysts and Ptb
) ⁄ )
ES cells. (A) Immunostaining of PTB, Oct3 ⁄ 4 and Cdx2 in wild-type blastocysts. PTB is
expressed in the ICM and trophectoderm (left column). Oct3 ⁄ 4 (red) and Cdx-2 (green) indicate the ICM and the trophectoderm, respectively
(right column). (B) In vitro outgrowth assay of blastocysts. Intercrossed embryos at E3.5 were collected and cultured for 5 days. The mor-
phology and AP activity of Ptb
) ⁄ )
blastocysts were compared with those of wild-type cells. Reduced proliferation of the ICM from Ptb
) ⁄ )
blastocysts was observed. TG, trophoblastic giant cells. (C) Quantitative real-time PCR analysis comparing the expression of undifferentiated
markers in wild-type cells and two Ptb
) ⁄ )
ES cell clones. Oct3 ⁄ 4, Sox2, Nanog and Rex-1 transcripts were normalized to Gapdh transcripts.
Mean values ± standard deviation (SD) were plotted from data obtained in at least three independent experiments. *P > 0.05, **P > 0.005.
(D) Northern blot analysis of differentiated marker expression. Total RNA isolated from wild-type, heterozygous and Ptb
) ⁄ )
cells was hybrid-
ized with radiolabeled cDNA probes. Five micrograms of total RNA was loaded onto each lane. (E) SSEA-1 expression in wild-type and
Ptb
) ⁄ )
ES cells. ES cells were cultured on a feeder layer. The expression of SSEA-1 was maintained in both wild-type cells and the two
Ptb
) ⁄ )
ES cell clones. GAPDH, glyceraldehyde-3-phosphate dehydrogenase. Scale bar: 100 lm.
Table 2. Genotypes of established ES cell lines from blastocysts.
Fifty-one blastosysts from heterozygous intercrossing were used
for ES cell derivation. After 2–3 weeks of culture, ES cell lines
were established from 14 blastosysts. All of the ES cell lines were
positive for AP activity. Whereas heterozygous or wild-type cell
lines were obtained with the expected Mendelian ratio, no Ptb
) ⁄ )
ES cell line was found.
Genotype
Total+ ⁄ ++⁄ ))⁄ )
ES cell line 5 9 0 14
M. Shibayama et al. PTB in development and ES cells
FEBS Journal 276 (2009) 6658–6668 ª 2009 The Authors Journal compilation ª 2009 FEBS 6661
Ptb
–/–
ES cells maintain the undifferentiated state
To address the expression profile of the undifferenti-
ated markers between wild-type and Ptb
) ⁄ )
ES cells,
the relative abundance of selected mRNAs was deter-
mined by quantitative real-time PCR analysis. The
expression of Nanog was slightly decreased in both
Ptb
) ⁄ )
ES cell clones, and Rex-1 expression was
reduced in one of the Ptb
) ⁄ )
ES cell clones () ⁄ )2) as
compared with that of wild-type ES cells (Fig. 2C).
Although it has been reported that the expression of
undifferentiated marker genes, such as Oct3 ⁄ 4 and
Sox2, is decreased in Nanog-deficient ES cells [22], the
expression of Oct3 ⁄ 4 and Sox2 mRNA was maintained
and not different between the two Ptb
) ⁄ )
ES cell clones
(Fig. 2C). Furthermore, both Ptb
) ⁄ )
ES cell clones also
expressed another ES cell marker, stage-specific embry-
onic antigen-1 (SSEA-1) (Fig. 2E), and were positive
for AP activity (Fig. 3A). In contrast, the expression of
SSEA-1 was not detected in the differentiated ES cells
(Fig. S1). On the other hand, the northern blotting and
quantitative real-time PCR analysis also showed that
the expression of differentiation marker genes such as
fgf5, gata4 and gata6 was not increased in wild-type
cells or either of the Ptb
) ⁄ )
ES cell clones (Figs 2D and
4A). Taken together, these results indicate that
Ptb Tg
IB:anti-PTB
vector
Fold increase
100
50
+/– –/– +/+
1
0
2
3
4
Cell number ( x 10
6
)
1 2 3 Day 4 5
–/– –/– –/– –/– –/–
1.4
1.2
1
0.8
0.6
0.4
0.2
0
0 3 6 9
Relative viable cells
Days
+/+
–/–1
+/+
+/–
–/–1
(Serum free)
–/–2
–/–2
+/+
PI TUNEL
A
E
B
C
D
+/+
–/–
+/–
+/+
–/–1
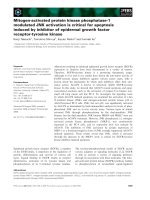
Fig. 3. Reduced proliferation of Ptb
) ⁄ )
ES cells. (A) AP staining of wild-type and Ptb
) ⁄ )
ES cells. The AP activities were positive in both
wild-type cells and the two Ptb
) ⁄ )
ES cell clones. Scale bar: 100 lm. (B) Cell proliferation assay. Cells (5 · 10
4
) were seeded (d0) and
counted every day for 5 days of culture. The proliferation of Ptb
) ⁄ )
ES cells was reduced as compared with wild-type cells. (C) Impairment
of cell proliferation seen in the Ptb
) ⁄ )
ES cells was rescued by ectopic expression of PTB. Ptb
) ⁄ )
ES cell clones were stably transfected
with a PTB expression vector or control plasmid, and subjected to a cell proliferation assay as in (B). Bars indicate fold increase in cell num-
ber after 5 days of cell culture. The amount of ectopically expressed PTB was comparable to that expressed by heterozygous ES cells (lower
panel). The concentration of lysates was quantified, and the same volume was loaded into each lane. Tg, transgene. (D) Apoptosis assay.
Left, bright field; middle, PI staining; right, fluorescence-labeled DNA fragmented by terminal deoxynucleotidyl transferase. TUNEL, terminal
deoxynucleotidyl transferase dUTP nick end labeling. Wild-type ES cells cultured under serum-free conditions was used as a positive control
for the apoptosis assay. Scale bar: 200 lm. (E) Proportion of viable cells. Cell viability was calculated as the ratio of the number of Trypan
blue-staining-negative cells to that of total cells. Cells (3 · 10
5
) were seeded on growth medium and counted every day for 3 days of culture.
The circles indicate the values for wild-type cells and the triangles indicate those for Ptb
) ⁄ )
ES cells. Mean values ± SD were plotted from
data obtained in experiments conducted in triplicate. *P > 0.05.
PTB in development and ES cells M. Shibayama et al.
6662 FEBS Journal 276 (2009) 6658–6668 ª 2009 The Authors Journal compilation ª 2009 FEBS
although the expression of a part of ES cell-specific
markers was reduced in Ptb
) ⁄ )
ES cells, both Ptb
) ⁄ )
ES cell clones still remained in undifferentiated state
and did not lead to precocious differentiation.
Ptb
) ⁄ )
ES cells exhibit reduced cell proliferation
Although Ptb
) ⁄ )
ES cell clones were viable and formed
typical oval-shaped compact colonies on feeder layers,
Ptb
) ⁄ )
ES cell colonies were smaller than control cell
colonies (Fig. 3A). A cell proliferation assay showed
that wild-type and parental Ptb
+ ⁄ )
ES cells were able
to expand more than 60-fold after 5 days of culture,
whereas both Ptb
) ⁄ )
ES cell clones showed only a five-
fold to seven-fold increase in the same period (Fig. 3B).
To confirm whether the reduced proliferation rate of
Ptb
) ⁄ )
ES cells was due to loss of PTB expression, we
introduced the PTB expression vector into Ptb
) ⁄ )
ES
cells (Fig. 3C). The proliferation defect seen in Ptb
) ⁄ )
ES cells was recovered by PTB re-expression (Fig. 3C),
suggesting that the defect in cell proliferation of Ptb
) ⁄ )
ES cells was due to the loss of PTB expression. As we
observed no signs of apoptosis (Fig. 3D) or massive cell
death (Fig. 3E) in Ptb
) ⁄ )
ES cell cultures, the small size
of Ptb
) ⁄ )
ES cell colonies and the results of our proli-
feration assay indicate a reduced proliferation rate in
Ptb
) ⁄ )
ES cells.
To further investigate the proliferative ability of
Ptb
) ⁄ )
ES cells, we assessed their teratoma formation
ability in vivo. We transplanted wild-type or Ptb
) ⁄ )
ES
cells under the kidney capsules of five severe combined
immunodeficiency (SCID) mice, and examined the kid-
neys 3 weeks after transplantation (Fig. 4B). The wet
weight of teratomas resulting from transplantation
with Ptb
) ⁄ )
ES cells after 3 weeks was more than
20-fold reduced as compared with wild-type teratomas
(Fig. 4C). To determine whether the teratoma forma-
tion defect of Ptb
) ⁄ )
ES cells is due to loss of pluripo-
tency, we performed embryoid body (EB) formation
assay and quantified the expression of differentiation
marker genes by quantitative real-time PCR (Fig. 4A).
The EBs were formed by suspension culture of ES cells
for 7 days without leukemia inhibitory factor (LIF).
The quantitative real-time PCR analysis revealed that
differentiation markers such as Fgf5, Gata4 and Gata6
were expressed in EBs from Ptb
) ⁄ )
ES cells, as well as
wild-type ES cells (Fig. 4A). These results indicate that
the defect of teratoma formation from Ptb
) ⁄ )
ES cells
is not due to the loss of pluripotency. Interestingly, the
expression levels of differentiation markers in EBs
from Ptb
) ⁄ )
ES cells were higher than those in wild-
type cells, indicating that Ptb
) ⁄ )
ES cells may have a
greater tendency to differentiate than wild-type ES
cells. Collectively, our data demonstrate that PTB is
one of the critical factors for proliferation but not
pluripotency of ES cells both in vitro and in vivo.
5 mm
+/+–/–
Wet weight (g)
0
1
2
3
3.5
2.5
1.5
0.5
+/+ –/–
0
20
40
60
80
100
+/+
+/+
–/–1
–/–2
–/–1
+/+
+/+
–/–1
–/–2
–/–1
+/+
+/+
–/–1
–/–2
–/–1
ES EB
Fgf5
ES EB
Gata4 Gata6
ES EB
Relative gene expression
*
*
A
BC
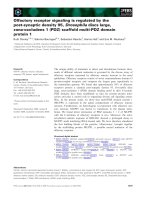
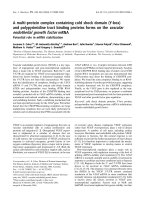
Fig. 4. Ptb
) ⁄ )
ES cells have a severe defect in cell proliferation
in vivo and in vivo. (A) Quantitative real-time PCR analysis compar-
ing the expression of differentiated markers in wild-type and Ptb
) ⁄ )
ES cells and EBs from wild-type and Ptb
) ⁄ )
ES cells () ⁄ )1). Fgf5,
Gata4 and Gata6 transcripts were normalized to Gapdh transcripts.
Mean values ± SD were plotted from data obtained in at least
three independent experiments. *P > 0.05. (B) Teratoma formation
by ES cell transplantation. Wild-type or Ptb
) ⁄ )
ES cells were trans-
planted under the kidney capsules of SCID mice. Three weeks after
transplantation, teratoma formation was examined. In four of five
mice transplanted with wild-type ES cells, a teratoma formed
around the kidney (right). However, no teratoma formation was
observed in the five mice transplanted with Ptb
) ⁄ )
ES cells (left).
Scale bar: 5 mm. (C) Wet weight of teratomas. The average wet
weight of teratomas resulting from transplantation with wild-type
ES cells was approximately 2.3 g. Mean values ± SD were plotted
from data obtained in experiments conducted in triplicate.
*P > 0.01.
M. Shibayama et al. PTB in development and ES cells
FEBS Journal 276 (2009) 6658–6668 ª 2009 The Authors Journal compilation ª 2009 FEBS 6663
Ptb
–/–
ES cells have prolonged G
2
/M progression
To further characterize the reduced proliferation phe-
notype seen in Ptb
) ⁄ )
ES cells, we measured the
expression of several well-known cell cycle regulators
by western blot analysis (Fig. 5A). Although it has
been reported that PTB modulates the G
1
to S transi-
tion through enhancement of IRES-dependent transla-
tion of p27
kip1
in differentiated cells such as 293T cells
[23], the protein level of p27
kip1
in Ptb
) ⁄ )
ES cells was
not different from that in wild-type ES cells (Fig. 5A).
Moreover, no alterations in cyclin A, B or E protein
expression were found in Ptb
) ⁄ )
ES cells (Fig. 5A).
These results indicate that the cause of the prolifera-
tion defect in Ptb
) ⁄ )
ES cells is not aberrant expres-
sion of these cell cycle regulators. To further
investigate the mechanism of the cell proliferation
defect seen in Ptb
) ⁄ )
ES cells, we performed cell cycle
analysis. We fixed and stained cells with propidium
iodide (PI), after which we analyzed the DNA content
by flow cytometry (Fig. 5B). The peak of the cell pop-
ulation mapped in the G
2
⁄ M phase was higher in
Ptb
) ⁄ )
ES cells than in wild-type ES cells (Fig. 5B).
This result suggests that the cause of the proliferation
defect in Ptb
) ⁄ )
ES cells may be G
2
⁄ M phase delay.
We next analyzed cell cycle progression in Ptb
) ⁄ )
ES
cells by arresting the cells in the early S phase with a
double thymidine block. We released cells from the
block and fixed them at the time points indicated in
Fig. 5C, and then analyzed the DNA contents of the
cells by flow cytometry. Up until 4 h after the release,
the DNA content patterns were essentially the same in
Ptb
) ⁄ )
and wild-type ES cells, and cells were at the
end of the S phase in this period (Fig. 5C, shaded in
gray). These results indicate that progression through
the S phase is not affected by PTB deficiency. How-
ever, the number of cells returning to the G
1
phase
through the G
2
⁄ M phase was smaller in Ptb
) ⁄ )
ES
cells than in control cells, as seen at 8 h after release
(Fig. 5C, indicated by arrows). As the pattern of DNA
contents at 8 h after release in Ptb
) ⁄ )
ES cells was the
same as that after 6 h in control cells, we estimated the
delay in G
2
⁄ M progression in Ptb
) ⁄ )
ES cells to be
approximately 2 h. Taking these data together, we
conclude that the proliferation defect in Ptb
) ⁄ )
ES
cells is a result of delayed G
2
⁄ M progression.
AB C
Fig. 5. G
2
⁄ M progression is delayed in
Ptb
) ⁄ )
ES cells. (A) Expression of cell cycle-
related proteins in Ptb
) ⁄ )
ES cells. Expres-
sion of p27, cyclin A, cyclin B and cyclin E
was examined by western blotting. Whole
cell extracts from wild-type, heterozygous
and Ptb
) ⁄ )
ES cells were subjected to
SDS ⁄ PAGE. No significant difference was
observed in Ptb
) ⁄ )
ES cells. (B) Cell cycle
analysis of asynchronous Ptb
) ⁄ )
ES cell
populations by flow cytometry. Cells were
fixed in ethanol and stained by PI. The
percentage of cells in the G
2
⁄ M stage is
described in the histograms. %G1: + ⁄ +,
10.0%; ) ⁄ )1, 8.99%; ) ⁄ )2, 9.76%. %S:
+ ⁄ +, 67.9%; ) ⁄ ), 64.2%; ) ⁄ )2, 65.9%.
The experiment was independently repeated
at least three times. (C) Cell synchronization
assay for cell cycle progression analysis.
Wild-type and Ptb
) ⁄ )
ES cells were synchro-
nized by a double thymidine block. Cells
were fixed at the indicated time points after
release, and the DNA content of the cells
was analyzed by flow cytometry. Arrows
indicate differences in G
1
peak appearance
between wild-type and Ptb
) ⁄ )
ES cells.
PTB in development and ES cells M. Shibayama et al.
6664 FEBS Journal 276 (2009) 6658–6668 ª 2009 The Authors Journal compilation ª 2009 FEBS
Discussion
We have shown that PTB, which has multiple functions
in RNA metabolism, is an essential factor in mouse
early development and ES cell proliferation. To assess
the function of PTB in vivo and in vitro, we used a strat-
egy in which Ptb was mutated by homologous recombi-
nation, and determined that the Ptb knockout mice
exhibited embryonic lethality shortly after implantation
(Table 1). We then established two Ptb
) ⁄ )
ES cell lines,
and found that Ptb
) ⁄ )
ES cells showed severe defects in
cell proliferation in vivo and in vitro (Figs 3B and 4B).
As Ptb
) ⁄ )
ES cells exhibit a low proliferation rate,
Ptb
) ⁄ )
ES cells may not be established from Ptb
) ⁄ )
blastocysts or Cre-transfected Ptb
) ⁄ flox-hygro
ES cells.
Lower proliferation rates are also found in sall4-dis-
rupted, klf5-disrupted, HDAC1-disrupted, ronin-dis-
rupted and dicer-disrupted ES cells relative to wild-type
ES cells, and mice with knockout of these genes also
show embryonic lethality at the peri-implantation stage
[24–28], a phenotype similar to that of the Ptb knockout
mice. Although the phenotypes of ES cells with disrup-
tion of these genes differ, these reports suggest that a
lower ES cell proliferation rate can cause critical defects
in embryonic development. As PTB is expressed in both
the ICM and the trophectoderm, we could not exclude
the possibility of a failure of implantation due to defec-
tive trophectoderm development, as in the case of the
klf5 knockout mice [25]. In klf5
) ⁄ )
ES cells, expression
of differentiation-related genes and spontaneous differ-
entiation are increased [25]. However, these phenotypes
are not observed in Ptb
) ⁄ )
ES cells. Furthermore, the
expression of Oct3 ⁄ 4 was not disturbed in Ptb
) ⁄ )
ES
cells, and this is different from what is seen in sall4
) ⁄ )
ES cells [24]. These reports suggest that regulation of
proliferation occurs through more than one mechanism
in ES cells. One likely reason for the embryonic lethality
of the Ptb knockout mice is the prolonged G
2
⁄ M
progression seen in Ptb
) ⁄ )
ES cells (Fig. 5B,C). As pro-
posed in a recent review [29], mitosis is a key process in
which transcriptional programs are altered. From our
results showing that Ptb
) ⁄ )
ES cells have a prolonged
G
2
⁄ M phase and Ptb knockout mice exhibit embryonic
lethality, it appears that irregular control of the mitotic
phase may affect nuclear reorganization processes,
resulting in loss of control of transcriptional programs.
This difference in developmental regulation may also
apply to the mechanisms of promiscuous gene expres-
sion and other phenotypes seen in cancer cells. In ovar-
ian cancer, a high level of expression of PTB is
correlated with tumor cell growth and malignancy
[19,20]. This may be due to disruption of the gene
expression program in tumor cells resulting from
augmented PTB expression. Taken together, these data
suggest that PTB is a key factor in switching of cell
identity through mitotic phase modulation. PTB is a
multifunctional protein that is involved in transcription,
polyadenylation, alternative splicing, and IRES-depen-
dent translation, and these steps are all known to be
targets for mitotic inhibition [30,31]. The regulatory
mechanism of the ES cell cycle is still unclear. We are
currently investigating whether PTB is one of the
important regulators for the G
2
⁄ M phase in ES cells.
Cell proliferation and differentiation are highly coor-
dinated processes during development, and it is well
known that, in many systems, terminal differentiation
is coupled with growth arrest. The low proliferation
rate may be responsible for the rapid differentiation
potential of Ptb
) ⁄ )
ES cells, and result in higher
expression levels of differentiated marker genes in EBs
from Ptb
) ⁄ )
ES cells than in EBs from wild-type cells
(Fig. 4A). The expression of the undifferentiated stem
cell marker Nanog is downregulated in both Ptb
) ⁄ )
ES
cell clones (Fig. 2C). We observed that recombinant
PTB protein can bind to a pyrimidine-rich sequence in
the Nanog promoter region (Y. Nakatake, unpublished
data). These data suggest that PTB may partially regu-
late the expression of Nanog. The difference in Nanog
expression between the two Ptb
) ⁄ )
ES cell clones may
be due to the effect of factor(s) other than PTB. As
the expression of Rex-1 is regulated by Nanog [32,33],
the reduction of Rex-1 expression in Ptb
) ⁄ )
ES cells
() ⁄ ) 2) may be caused by downregulation of Nanog.In
the other clone () ⁄ )1), the expression level of Nanog
may be enough to activate Rex-1 expression. Although
the expression levels of Nanog and Rex-1 are different
between the two Ptb
) ⁄ )
ES cell clones, we did not
observe any differences in phenotypes such as prolifer-
ation (Fig. 3B), apoptosis (Fig. 3D), or undifferenti-
ated state (Figs 2E and 3A). Furthermore, in Ptb
) ⁄ )
ES cells, we did not observe any spontaneous differen-
tiation (Figs 2D and 4A) or downregulation of Oct3 ⁄ 4
(Fig. 2C), as is seen in Nanog-deficient ES cells [22].
Collectively, these data suggest that the phenotypes
resulting from the absence of PTB are due to a distinct
mechanism that is independent of Nanog and Oct3 ⁄ 4.
PTB regulates nonsense-mediated decay of transcripts
of nPTB, which is one paralog of PTB [34]. We investi-
gated whether the expression of nPTB was increased in
Ptb
) ⁄ )
ES cells (Fig. S2). The level of nPTB in Ptb
) ⁄ )
ES cells was higher than in wild-type ES cells. Although
it has been reported that PTB and nPTB have functional
overlap [35] in HeLa cells, the increase of nPTB expres-
sion did not rescue the proliferation defect in ES cells.
Our study has revealed the importance of PTB in cell
proliferation. Questions that still need to be answered
M. Shibayama et al. PTB in development and ES cells
FEBS Journal 276 (2009) 6658–6668 ª 2009 The Authors Journal compilation ª 2009 FEBS 6665
are what the identity is of the target protein regulated
by PTB in the mitotic phase and how this target protein
modulates mitosis and cell proliferation. The answers to
these questions will provide novel insights into gene reg-
ulation through mitosis. Another interesting approach
would be to clarify the significance of PTB in cells with-
out a mitotic cycle. Heart and brain tissues may be
interesting in this respect, as they express PTB [16,21]
but do not engage in massive cell growth. These experi-
ments are now possible, owing to our establishment of
conditional targeting of Ptb in mice. The molecular
mechanisms of PTB regulation of early mouse develop-
ment and ES cell proliferation are important questions
that are worthy of further investigation.
Experimental procedures
Cell culture
ES cells were cultured in DMEM (Nissui, Tokyo, Japan)
supplemented with LIF, 15% fetal bovine serum, 100 nm 2-
mercaptoethanol, 0.06% l-glutamine, and glucose (to a final
concentration of 4500 mgÆL
)1
). Mouse embryonic fibroblasts
were maintained in DMEM supplemented with 10% fetal
bovine serum and 0.06% l-glutamine. Hygromycin-resistant
MEFs were prepared from mice generously provided by
Y. Iwakura (IMSUT, Japan).
Proliferation assay, apoptosis assay, and AP
staining
For the proliferation assay, 3 · 10
5
cells were seeded in
growth medium and counted every day over 3 days of cul-
ture. Viable and total cells were counted with and without
Trypan blue solution. The value of relative viable cells was
calculated as the ratio of the number of Trypan blue-nega-
tive cells to that of total cells. The apoptosis assay was per-
formed using an ApopTag Fluorescein Direct In Situ
Apoptosis Detection Kit (Chemicon), following the manu-
facturer’s instructions. AP staining was performed using an
AP leukocyte kit (Sigma-Aldrich, St Louis, MO, USA),
following the manufacturer’s instructions.
PTB expression vector and plasmid transfection
The coding sequence for PTB was obtained by PCR ampli-
fication using relevant primers (Table S1). The resulting
cDNA fragment was digested with HindIII and SlaI, and
then subcloned into pBluescript II (Stratagene, La Jolla,
CA, USA) and sequenced. For the PTB expression vector,
the cDNA was ligated into pBPCAGGS, in which the
pHPCAGGS hygromycin resistance gene cassette (kindly
provided by H. Niwa, RIKEN, Japan) was replaced with
a blasticidin resistance gene cassette from pcDNA6 ⁄ TR
(Invitrogen, Carlsbad, CA, USA). Linearized PTB expres-
sion vector or pBPCAGGS was then transfected into cells
with Lipofectamine2000 (Invitrogen), and the cells were
selected in the presence of 3 lgÆmL
)1
blasticidin (Invivo-
Gen, San Diego, CA, USA) for 5 days.
Northern blotting
Total RNA was isolated by ultracentrifugation [36] or
extracted using sepasol RNA I (Nacalai Tesque, Kyoto,
Japan). Agarose gel electrophoresis and blotting were per-
formed as previously reported [37]. Hybridization and
washing of the blotted filter were performed according to
previously described methods [38]. Probes for Fgf5, Gata4
and Gata6 were obtained by PCR amplification. Primer
sequences are described in Table S1. cDNA templates for
probes were synthesized by SuperScriptII ⁄ III (Invitrogen)
according to the manufacturer’s instructions.
Quantitative real-Time PCR analysis
For the RT-PCR analysis, first-strand cDNA was synthe-
sized from 1 lg of total RNA that had been treated with
DNase I in 10 lL of reaction mixture using the High Capac-
ity RNA-to-cDNA Kit (ABI, Foster City, CA, USA). The
quantitative real-time PCR reaction was performed with a
Fast SYBR Green Master Mix (ABI) and analyzed on a Ste-
pOnePlus (ABI). Relative gene expression was calculated
using the standard curve method. The sequences of primers
for quantitative real-time PCR are listed in Table S1.
Antibodies and immunodetection
Rabbit anti-Oct3 ⁄ 4 (Santa Cruz Biotechnology, Santa Cruz,
CA, USA), rabbit anti-Oct3 ⁄ 4 [39], mouse anti-PTB (Zymed,
Invitrogen), rabbit anti-SSEA-1 (Chemicon, Millipore,
Billerica, MA, USA), mouse anti-p27
kip1
(BD Pharmingen,
Franklin Lakes, NJ, USA), rabbit anti-cyclin A (Santa Cruz
Biotechnology) and rabbit anti-cyclin E (Santa Cruz Biotech-
nology) sera were used for immunodetection. For immuno-
fluorescent staining, Alexa Fluor 488 anti-rabbit IgG
(Molecular Probes, Invitrogen) and Alexa Fluor 562 anti-
mouse IgG (Molecular Probes) were used as secondary anti-
bodies. For western blotting, horseradish peroxidase-linked
anti-mouse IgG and anti-rabbit IgG (GE Healthcare, Chal-
font St Giles, UK) were used. Immunoreactivity was detected
using an enhanced chemiluminescence kit (GE Healthcare)
and X-ray film (Fuji Film, Kanagawa, Japan).
Cell cycle analysis
A double thymidine block was performed as follows. Thy-
midine (MP Biomedicals, Illkirch, France) was added to
each ES cell culture to a final concentration of 2 mm. After
PTB in development and ES cells M. Shibayama et al.
6666 FEBS Journal 276 (2009) 6658–6668 ª 2009 The Authors Journal compilation ª 2009 FEBS
16 h, the cells were washed twice with NaCl ⁄ P
i
and released
for 8 h in growth medium. A second block was initiated by
adding thymidine to a concentration of 2 mm and was
maintained for 16 h. Cells were washed twice with NaCl ⁄ P
i
,
released in fresh growth medium for the indicated periods
of time, and then fixed in cold 70% ethanol. Fixed cells
from the double thymidine block were treated with
5mgÆmL
)1
RNaseA (Sigma, St Louis, MO, USA) and
50 lgÆmL
)1
PI (Nacalai Tesque) for 30 min at room tem-
perature. Cell cycle analysis was carried out using a FAC-
SCalibur (Becton Dickinson, Franklin Lakes, NJ, USA)
and flowjo software (TreeStar, Ashland, OR, USA).
Mice and teratoma formation
C57BL ⁄ 6J mice and MCH:ICR mice were purchased from
CLEA Japan (Tokyo, Japan). All of the mice were main-
tained under specific pathogen-free conditions in the animal
facility of the IMSUT, the University of Tokyo. For tera-
toma formation, wild-type or Ptb
) ⁄ )
ES cells were suspended
in NaCl ⁄ P
i
and transplanted (3 · 10
5
cells per kidney) under
the kidney capsules of adult male C.B-17 ⁄ Icr scid Jcl mice
(CLEA Japan). Three weeks after transplantation, the kid-
neys were collected and examined. All of the work with mice
conformed to guidelines approved by the Institutional Ani-
mal Care and Use Committee of the University of Tokyo.
Acknowledgements
We thank R. Ku
¨
hn for providing us with E14.1 ES
cells, H. Niwa for the pHPCAGGS plasmid and rabbit
anti-Oct3 ⁄ 4 serum, and Y. Iwakura for hygromycin-
resistant mouse embryonic fibroblasts. This research
was supported by a Research Grant (2000–2004, to N.
Yoshida) for the Future Program (‘Mirai Kaitaku’)
from the Japanese Society for the Promotion of
Science (JSPS) and by grants from the Ministry of
Education, Culture, Sports, Science and Technology
of Japan (to N. Yoshida and M. Sato).
References
1 Molofsky AV, Pardal R & Morrison SJ (2004) Diverse
mechanisms regulate stem cell self-renewal. Curr Opin
Cell Biol 16, 700–707.
2 Mattaj I & Hamm J (1989) Regulated splicing in early
development and stage-specific U snRNPs. Development
105, 183–189.
3 Pritsker M, Doniger TT, Kramer LC, Westcot SE &
Lemischka IR (2005) Diversification of stem cell molec-
ular repertoire by alternative splicing. Proc Natl Acad
Sci USA 102, 14290–14295.
4 Robida MD & Singh R (2003) Drosophila poly-
pyrimidine-tract binding protein (PTB) functions
specifically in the male germline. EMBO J 22, 2924–
2933.
5 Hamon S, Le Sommer C, Mereau A, Allo MR &
Hardy S (2004) Polypyrimidine tract-binding protein is
involved in vivo in repression of a composite inter-
nal ⁄ 3¢-terminal exon of the Xenopus alpha-tropomyosin
Pre-mRNA. J Biol Chem 279, 22166–22175.
6 Black DL (2003) Mechanisms of alternative pre-messen-
ger RNA splicing. Annu Rev Biochem 72, 291–336.
7 Wollerton MC, Gooding C, Wagner EJ, Garcia-Blanco
MA & Smith CW (2004) Autoregulation of polypyrimi-
dine tract binding protein by alternative splicing leading
to nonsense-mediated decay. Mol Cell 13, 91–100.
8 Castelo-Branco P, Furger A, Wollerton M, Smith C,
Moreira A & Proudfoot N (2004) Polypyrimidine tract
binding protein modulates efficiency of polyadenylation.
Mol Cell Biol 24, 4174–4183.
9 Knoch KP, Bergert H, Borgonovo B, Saeger HD,
Altkruger A, Verkade P & Solimena M (2004) Poly-
pyrimidine tract-binding protein promotes insulin
secretory granule biogenesis. Nat Cell Biol 6, 207–214.
10 Kosinski PA, Laughlin J, Singh K & Covey LR (2003)
A complex containing polypyrimidine tract-binding pro-
tein is involved in regulating the stability of CD40
ligand (CD154) mRNA. J Immunol 170, 979–988.
11 Rustighi A, Tessari MA, Vascotto F, Sgarra R,
Giancotti V & Manfioletti G (2002) A polypyrimi-
dine ⁄ polypurine tract within the Hmga2 minimal
promoter: a common feature of many growth-related
genes. Biochemistry 41, 1229–1240.
12 Cote CA, Gautreau D, Denegre JM, Kress TL, Terry
NA & Mowry KL (1999) A Xenopus protein related to
hnRNP I has a role in cytoplasmic RNA localization.
Mol Cell 4, 431–437.
13 Zang WQ, Li B, Huang PY, Lai MM & Yen TS (2001)
Role of polypyrimidine tract binding protein in the
function of the hepatitis B virus posttranscriptional
regulatory element. J Virol 75, 10779–10786.
14 Cornelis S, Tinton SA, Schepens B, Bruynooghe Y & Beya-
ert R (2005) UNR translation can be driven by an IRES
element that is negatively regulated by polypyrimidine
tract binding protein. Nucleic Acids Res 33, 3095–3108.
15 Mitchell SA, Brown EC, Coldwell MJ, Jackson RJ &
Willis AE (2001) Protein factor requirements of the
Apaf-1 internal ribosome entry segment: roles of
polypyrimidine tract binding protein and upstream of
N-ras. Mol Cell Biol 21, 3364–3374.
16 Polydorides AD, Okano HJ, Yang YY, Stefani G &
Darnell RB (2000) A brain-enriched polypyrimidine
tract-binding protein antagonizes the ability of Nova to
regulate neuron-specific alternative splicing. Proc Natl
Acad Sci USA 97, 6350–6355.
17 Kikuchi T, Ichikawa M, Arai J, Tateiwa H, Fu L,
Higuchi K & Yoshimura N (2000) Molecular cloning
and characterization of a new neuron-specific
M. Shibayama et al. PTB in development and ES cells
FEBS Journal 276 (2009) 6658–6668 ª 2009 The Authors Journal compilation ª 2009 FEBS 6667
homologue of rat polypyrimidine tract binding protein.
J Biochem 128, 811–821.
18 Yamamoto H, Tsukahara K, Kanaoka Y, Jinno S &
Okayama H (1999) Isolation of a mammalian homo-
logue of a fission yeast differentiation regulator. Mol
Cell Biol 19, 3829–3841.
19 He X, Pool M, Darcy KM, Lim SB, A uersper g N, Coon JS
& Beck WT (2007) Knockdown of polypyrimidine tract-
binding protein suppresses ovarian tumor cell growth
and invasiveness in vitro. Oncogene 26, 4961–4968.
20 Wang Y, Baskerville S, Shenoy A, Babiarz JE, Baehner
L & Blelloch R (2008) Embryonic stem cell-specific
microRNAs regulate the G1–S transition and promote
rapid proliferation. Nat Genet 40, 1478–1483.
21 Lillevali K, Kulla A & Ord T (2001) Comparative
expression analysis of the genes encoding polypyrimi-
dine tract binding protein (PTB) and its neural homo-
logue (brPTB) in prenatal and postnatal mouse brain.
Mech Dev 101, 217–220.
22 Mitsui K, Tokuzawa Y, Itoh H, Segawa K, Murakami
M, Takahashi K, Maruyama M, Maeda M & Yama-
naka S (2003) The homeoprotein Nanog is required for
maintenance of pluripotency in mouse epiblast and ES
cells. Cell 113, 631–642.
23 Cho S, Kim JH, Back SH & Jang SK (2005) Polypyrim-
idine tract-binding protein enhances the internal ribo-
somal entry site-dependent translation of p27
Kip1
mRNA and modulates transition from G1 to S phase.
Mol Cell Biol 25, 1283–1297.
24 Sakaki-Yumoto M, Kobayashi C, Sato A, Fujimura S,
Matsumoto Y, Takasato M, Kodama T, Aburatani H,
Asashima M, Yoshida N et al. (2006) The murine
homolog of SALL4, a causative gene in Okihiro syn-
drome, is essential for embryonic stem cell proliferation,
and cooperates with Sall1 in anorectal, heart, brain and
kidney development. Development 133, 3005–3013.
25 Ema M, Mori D, Niwa H, Hasegawa Y, Yamanaka Y,
Hitoshi S, Mimura J, Kawabe Y-i, Hosoya T, Morita
M et al. (2008) Kru
¨
pel-like factor 5 is essential for blas-
tocyst development and the normal self-renewal of
mouse ESCs. Cell Stem Cell 3, 555–567.
26 Lagger G, O’Carroll D, Rembold M, Khier H, Tischler
J, Weitzer G, Schuettengruber B, Hauser C, Brunmeir
R, Jenuwein T et al. (2002) Essential function of histone
deacetylase 1 in proliferation control and CDK inhibi-
tor repression. EMBO J 21, 2672–2681.
27 Kanellopoulou C, Muljo SA, Kung AL, Ganesan S,
Drapkin R, Jenuwein T, Livingston DM & Rajewsky K
(2005) Dicer-deficient mouse embryonic stem cells are
defective in differentiation and centromeric silencing.
Genes Dev 19, 489–501.
28 Dejosez M, Krumenacker JS, Zitur LJ, Passeri M, Chu
LF, Songyang Z, Thomson JA & Zwaka TP (2008)
Ronin is essential for embryogenesis and the pluripotency
of mouse embryonic stem cells. Cell 133, 1162–1174.
29 Egli D, Birkhoff G & Eggan K (2008) Mediators of
reprogramming: transcription factors and transitions
through mitosis. Nat Rev Mol Cell Biol 9, 505–516.
30 Blencowe BJ (2003) Splicing regulation: the cell cycle
connection. Curr Biol 13, 149–151.
31 Shin C & Manley JL (2002) The SR protein SRp38
represses splicing in M phase cells. Cell 111, 407–417.
32 Pan G & Pei D (2005) The stem cell pluripotency factor
NANOG activates transcription with two unusually
potent subdomains at its C terminus. J Biol Chem 280,
1401–1407.
33 Shi W, Wang H, Pan G, Geng Y, Guo Y & Pei D
(2006) Regulation of the pluripotency marker Rex-1 by
Nanog and Sox2. J Biol Chem 281, 23319–23325.
34 Boutz PL, Stoilov P, Li Q, Lin C-H, Chawla G, Ostrow
K, Shiue L, Ares M & Black DL (2007) A post-tran-
scriptional regulatory switch in polypyrimidine tract-
binding proteins reprograms alternative splicing in
developing neurons. Genes Dev 21, 1636–1652.
35 Spellman R, Llorian M & Smith CWJ (2007) Crossre-
gulation and functional redundancy between the splic-
ing regulator PTB and its paralogs nPTB and ROD1.
Mol Cell 27, 420–434.
36 Chomczynski P & Sacchi N (1987) Single-step method of
RNA isolation by acid guanidinium thiocyanate–phenol–
chloroform extraction. Anal Biochem 162, 156–159.
37 Thomas PS (1980) Hybridization of denatured RNA
and small DNA fragments transferred to nitrocellulose.
Proc Natl Acad Sci USA 77, 5201–5205.
38 Church GM & Gilbert W (1984) Genomic sequencing.
Proc Natl Acad Sci USA 81, 1991–1995.
39 Niwa H, Toyooka Y, Shimosato D, Strumpf D,
Takahashi K, Yagi R & Rossant J (2005) Interaction
between Oct3 ⁄ 4 and Cdx2 determines trophectoderm
differentiation. Cell 123, 917–929.
Supporting information
The following supplementary material is available:
Fig. S1. SSEA-1 expression in retinoic acid-treated
wild-type ES cells.
Fig. S2. Expression of nPTB in Ptb
) ⁄ )
ES cells.
Doc. S1. Construction of targeting vectors.
Table S1. List of primer sequences.
This supplementary material can be found in the
online version of this article.
Please note: As a service to our authors and readers,
this journal provides supporting information supplied
by the authors. Such materials are peer-reviewed and
may be re-organized for online delivery, but are not
copy-edited or typeset. Technical support issues arising
from supporting information (other than missing files)
should be addressed to the authors.
PTB in development and ES cells M. Shibayama et al.
6668 FEBS Journal 276 (2009) 6658–6668 ª 2009 The Authors Journal compilation ª 2009 FEBS