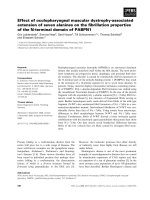
Báo cáo khoa học: Effect of flanking bases on quadruplex stability and Watson–Crick duplex competition pptx
Bạn đang xem bản rút gọn của tài liệu. Xem và tải ngay bản đầy đủ của tài liệu tại đây (352.88 KB, 13 trang )
Effect of flanking bases on quadruplex stability
and Watson–Crick duplex competition
Amit Arora, Divya R. Nair and Souvik Maiti
Proteomics and Structural Biology Unit, Institute of Genomics and Integrative Biology, Council for Scientific and Industrial Research (CSIR),
Mall Road, Delhi, India
G-quadruplexes are unique secondary structures
formed by inter- or intramolecular association of guan-
ine-rich nucleic acid sequences in the presence of metal
ions [1–10]. A genome-wide search showed that as
many as 376 000 potential quadruplexes could exist in
the functionally important regions of genes [11]. The
biological significance of G-quadruplexes is further
highlighted by their presence in the promoter regions
of the c-myc [12–15], c-kit [16], k-ras [17] and Rb [18]
genes, the immunoglobin switch region [19], insulin
regulatory sequences [20], the fragile X gene [21], the
cystatin B promoter [22], the Hif-1a promoter [23] and
the proximal promoter of the VEGF gene [24]. The
possible existence and roles of G-quadruplexes in vivo
have been corroborated by the detection of proteins
that bind specifically to G-quadruplexes and proteins
that have biological activities, such as helicases and
nucleases, that are specific for G-quadruplexes [25].
In the cellular environment, G-rich sequences are
flanked by other bases and are present with their
complementary strands, leading to a dynamic equilib-
rium between quadruplex and duplex structures [26].
Depending on the cellular requirements, this equi-
librium favors either quadruplex or Watson–Crick
duplex formation for execution of their respective
biological functions. Studies have been performed to
elucidate the role of various factors in guiding the
direction of the equilibrium [27–37]. Previous studies
have mostly assessed the significance of changes in the
intracellular environment in terms of pH, the presence
of cations, temperature and molecular crowding on
the quadruplex to duplex transition. It has been
Keywords
c-kit; equilibrium; flank length; quadruplex;
Watson–Crick duplex
Correspondence
S. Maiti, Proteomics and Structural Biology
Unit, Institute of Genomics and Integrative
Biology, CSIR, Mall Road, Delhi 110 007,
India
Fax: +91 11 2766 7471
Tel: +91 11 2766 6156
E-mail:
(Received 8 February 2009, revised 5 April
2009, accepted 1 May 2009)
doi:10.1111/j.1742-4658.2009.07082.x
Guanine-rich DNA sequences have the ability to fold into four-stranded
structures called G-quadruplexes, and are considered as promising antican-
cer targets. Although the G-quadruplex structure is composed of quartets
and interspersed loops, in the genome it is also flanked on each side by
numerous bases. The effect of loop length and composition on quadruplex
conformation and stability has been well investigated in the past, but the
effect of flanking bases on quadruplex stability and Watson–Crick duplex
competition has not been addressed. We have studied in detail the effect of
flanking bases on quadruplex stability and on duplex formation by the
G-quadruplex in the presence of complementary strands using the quadru-
plex-forming sequence located in the promoter region of the c- kit onco-
gene. The results obtained from CD, thermal difference spectrum and UV
melting demonstrated the effect of flanking bases on quadruplex structure
and stability. With the increase in flank length, the increase in the more
favorable DH
vH
is accompanied by a striking increase in the unfavorable
DS
vH
, which resulted in a decrease in the overall DG
vH
of quadruplex
formation. Furthermore, CD, fluorescence and isothermal titration calori-
metry studies demonstrated that the propensity to attain quadruplex struc-
ture decreases with increasing flank length.
Abbreviations
ITC, isothermal titration calorimetry; LNA, locked nucleic acid; TDS, thermal difference spectrum.
3628 FEBS Journal 276 (2009) 3628–3640 ª 2009 The Authors Journal compilation ª 2009 FEBS
demonstrated that molecular crowding agents such as
osmolytes significantly affect this transition, as living
cells are crowded with various biomolecules [38,39]. It
is apparent that the composition of the base sequences
in the loops between the G-quartets, the loop length
and the base sequences flanking the quadruplex may
also affect the transition between quadruplex and
duplex in the natural environment of biological sys-
tems. Recently, Kumar et al. [40] demonstrated the
role of a locked nucleic acid (LNA) modified comple-
mentary strand in the quadruplex ⁄ Watson–Crick
duplex equilibrium. The study indicated that LNA
modifications in the complementary strand shift the
equilibrium toward the duplex state. Moreover, it has
also been shown that an increase in loop length favors
duplex formation and competes out the quadruplex
[41]. However, to obtain a greater insight into the
dynamics of the equilibrium between the folded motif
and the duplex form, the G-rich sequences must also
be considered within the genomic framework. Previous
studies have focused on quadruplex sequences in isola-
tion, but the cellular environment is significantly dif-
ferent. In the genome, these unique sequences are
flanked by other sequences that might influence the
stability of these folded motifs and their ability to
compete with the duplex form in the presence of their
complementary strands. It thus seems logical to study
the influence of flanking regions on the existence of
quadruplexes, their stability and quadruplex ⁄ duplex
competition in the presence of the complementary
strand.
As the quadruplex-forming region does not occur
in isolation, and instead is flanked by other
sequences, it is imperative to analyze the effect of
these neighboring sequences on quadruplex stability
and on the duplex ⁄ quadruplex equilibrium. In the
current study, we have explored the influence of
flanking sequences in the quadruplex-forming region
of the c-kit proto-oncogene promoter [16]. Conforma-
tional analysis of preformed quadruplexes with flank
lengths from 0 to 12 was performed using CD and
thermal difference spectrum (TDS). Thermal denatur-
ation ⁄ renaturation profiles using UV-visible spectro-
scopy were obtained in order to create a complete
thermodynamic profile for formation of quadruplexes
with different flank lengths. Binding parameters and
the thermodynamic profile of preformed quadruplexes
in the presence of the complementary strand were
evaluated by fluorescence and isothermal titration cal-
orimetry (ITC) studies. The data obtained in this
study highlight the influence of flanking bases on
quadruplex stability and structural competition
between the G-quadruplex and the duplex.
Results and Discussion
To be able to assign a biologically relevant role to
quadruplexes, they must be considered in the genomic
context and natural cellular environment. We have
addressed this question in this study because of its
wider implication on the practicality of using G-quad-
ruplexes as therapeutic targets. The telomeric quadru-
plex has been well investigated and characterized
in terms of its structural and functional relevance
[2,5,42–44]. However, this quadruplex, formed by the
3¢ overhang of the telomere, lacks a complementary
strand and hence does not suffer competition with the
Watson–Crick duplex. In addition to the telomeric
quadruplex, the G-quadruplex present in the promoter
region of the c-myc proto-oncogene has also been well
characterized in terms of its structure and function
[12–15,45]. However, this quadruplex adopts multiple
conformations that make structural ⁄ biophysical inves-
tigations difficult [45]. Recently, quadruplex formation
has been reported in the promoter region of the c- kit
proto-oncogene (87 bp upstream of the transcription
start site) [16]. The solution structure of this quadru-
plex is also well characterized [46–49], and it has also
been investigated as an attractive therapeutic target
[50]. This has generated interest with respect to further
biophysical and structural characterization of c-kit
quadruplex. However, to design effective drugs against
quadruplex targets, it is essential to study the role of
various factors affecting quadruplex stability and influ-
encing the equilibrium between quadruplex and duplex
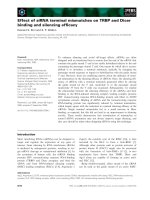
formation. Therefore, we have used the c-kit quadru-
plex sequence (5¢-GGGAGGGCGCTGGGAGGAG
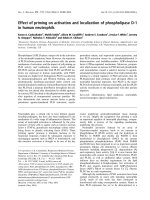
GG-3¢) as the model sequence for our study (Fig. 1).
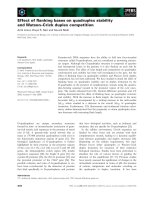
To analyze the effect of flanking bases on quadruplex
Fig. 1. Schematic representation of the 21-mer G-rich sequence
located )87 bp upstream of the transcription start site of the c-kit
gene. The sequences shown to the left of )108 and to the right of
)87 are the flanking sequences.
A. Arora et al. Effect of flanking bases on quadruplex stability and Watson–Crick duplex competition
FEBS Journal 276 (2009) 3628–3640 ª 2009 The Authors Journal compilation ª 2009 FEBS 3629
stability and quadruplex ⁄ duplex transition, we used
four sequences with 4, 6, 8 or 12 bases on either side
of the 21-base naturally occurring c-kit quadruplex-
forming sequence (Table 1).
The structural topology of the c-kit quadruplex
sequences (c-kitG0, c-kitG4, c- kitG6, c-kitG8 and
c-kitG12) was characterized as parallel or anti-parallel
using CD in the presence of 100 mm KCl, although CD
only provides an indication of the presence of any
secondary structure rather than a confirmation.
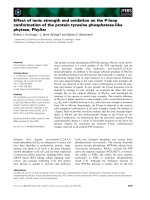
Figure 2 (black squares) shows the CD spectra obtained
for the various sequences. We observed a positive band
at around 262 nm and a negative band near 240 nm,
suggesting the presence of a quadruplex signature
characteristic of the parallel conformation [51] in the
G-rich sequences c-kitG0, c-kitG4 and c-kitG6
(Fig. 2A–C, black squares). This observation is in agree-
ment with a reported NMR study on the structural
conformation of the c-kit quadruplex [48]. For c-kitG8,
two positive peaks at 265 and 286 nm and a negative
peak at 240 nm were observed (Fig. 2D, black squares).
Moreover, unlike the G-rich sequences c-kitG0, c-kitG4
and c-kitG6, a broad positive CD signal ranging from
250 to 290 nm and a negative peak at 233 nm were
observed in the CD spectrum of c-kitG12 (Fig. 2E,
black squares). Thus, the CD spectra of c-kitG8 and
c-kitG12 showed the presence of secondary structures
other than quadruplex.
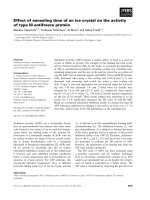
TDS complement CD as a tool for the structural
characterization of nucleic acids in solution. TDS pro-
vide a simple, inexpensive and rapid method to obtain
structural insight into nucleic acid structures, and may
be used for both DNA and RNA from short oligomers
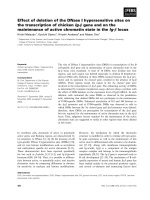
to polynucleotides [52]. Figure 3 shows TDS for
c-kitG0, c-kitG4, c-kitG6, c-kitG8 and c-kitG12 seq-
uences. The TDS for c-kitG0, c-kitG4, c-kitG6 showed
two positive maxima at 245 and 270 nm, a shoulder at
255 nm, and a negative minimum at 295 nm, thus
exhibiting the presence of quadruplex structure. How-
ever, the TDS for c-kitG8 and c-kitG12 sequences
showed loss of both the positive peak at 245 nm and
the negative peak at 295 nm that are characteristic of
G-quadruplex structure. The presence of a positive
peak at 270 nm in the TDS of the c-kitG8 and c-kitG12
sequences indicated the presence of a Watson–Crick
duplex-like structure as shown in Fig. 3. The TDS data
presented here are in agreement with previously
reported TDS data for G-quadruplexes and GC-rich
duplexes [52]. The TDS analysis thus supports the exis-
tence of G-quartets in c-kitG0, c-kitG4 and c-
kitG6
and the absence of Hoogsteen-bonded G-quartets in
c-kitG8 and c-kitG12. The presence of non-Hoogsteen-
bonded multiple structures in c-kitG8 and c-kitG12 as
shown by TDS prompted us to perform UV melting of
c-kitG0, c-kitG4, c-kitG6, c-kitG8 and c-kitG12
sequences at 260 nm in 100 mm KCl (Fig. S1). The
c-kitG8 and c-kitG12 sequences showed considerable
hyperchromic effects in the range 10–12%, while
c-kitG0, c-kitG4 and c-kitG6 showed only 2–6% hyper-
chromicity at 260 nm. The presence of 10–12% of
hyperchromicity at 260 nm for c-kitG8 and c-kitG12
also resulted from disruption of Watson–Crick base
pairing in the secondary structure (Fig. S1). mFOLD
analysis [53] also indicated the presence of stem-loop
structures with Watson–Crick base pairing in the stem
region in c-kitG8 and c-kitG12, and thus supported the
absence of Hoogsteen-bonded G-quartets (Fig. S2).
Together, these data clearly indicate that the G-rich
c-kit sequence with 8 and 12 flanking bases can adopt a
Watson–Crick duplex-like ‘stem-loop’ structure, and
thus lose the ability to form prominent quadruplex
structure, unlike the c-kitG0, c-kitG4 and c-kitG6
sequences. Figure S2 shows the topology of the parallel
G-quadruplex formation for c-kitG0, c-kitG4 and
Table 1. Quadruplexes with various flank lengths and their respective complementary strand sequences used in this study. G0 and C0 are
the core c-kit quadruplex-forming sequence and its complementary strand sequence, respectively. G4–G12 and C4–C12 indicate the number
of bases 5¢ and 3¢ to the core c-kit quadruplex-forming sequences and their respective complementary strand sequences.
Oligo name Oligonucleotide sequence (5¢-to3¢)
Number of
flanking bases
c-kitG0 GGGAGGGCGCTGGGAGGAGGG 0
c-kitC0 CCCTCCTCCCAGCGCCCTCCC 0
c-kitG4 CAGAGGGAGGGCGCTGGGAGGAGGGGCTG 4
c-kitC4 CAGCCCCTCCTCCCAGCGCCCTCCCTCTG 4
c-kitG6 CGCAGAGGGAGGGCGCTGGGAGGAGGGGCTGCT 6
c-kitC6 AGCAGCCCCTCCTCCCAGCGCCCTCCCTCTGCG 6
c-kitG8 CGCGCAGAGGGAGGGCGCTGGGAGGAGGGGCTGCTGC 8
c-kitC8 GCAGCAGCCCCTCCTCCCAGCGCCCTCCCTCTGCGCG 8
c-kitG12 CCGGCGCGCAGAGGGAGGGCGCTGGGAGGAGGGGCTGCTGCTCGC 12
c-kitC12 GCGAGCAGCAGCCCCTCCTCCCAGCGCCCTCCCTCTGCGCGCCGG 12
Effect of flanking bases on quadruplex stability and Watson–Crick duplex competition A. Arora et al.
3630 FEBS Journal 276 (2009) 3628–3640 ª 2009 The Authors Journal compilation ª 2009 FEBS
c-kitG6 and predicted secondary structures for c-kitG8
and c-kitG12. We wish to highlight that the c-kitG8
sequence can adopt a Watson–Crick duplex-like ‘stem-
loop’ structure together with G-quadruplex structure
in KCl buffer. The contribution of two different
secondary structure populations is quite evident from
the CD spectrum (Fig. 2) and the hypochromic (Fig. 4)
and hyperchromic transitions (Fig. S1) obtained from
UV melting at 295 and 260 nm, respectively.
Our next aim was to determine the effect of
increasing the flank length on the thermodynamic
stability of formation of secondary structures. We
have used a spectroscopic method to obtain thermal
denaturation ⁄ renaturation profiles to detect G-quartet
formation [54]. The thermal denaturation ⁄ renaturation
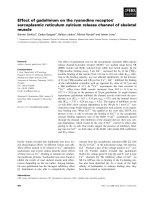
profiles for c-kitG0, c-kitG4 and c-kitG6 were charac-
terized by a clear and reversible transition, such that
melting and annealing curves were super-imposable
(Fig. 4A–C). For c-kitG8, the melting and annealing
curves showed considerable hysteresis (Fig. 4D), and
c-kitG12 showed no clear transition at 295 nm, sug-
gesting the absence of stable G-quartets (Fig. 4E).
The T
m
values for the c-kitG0, c-kitG4 and c-kitG6
sequences were calculated as shown in Table 2. The
midpoints of the melting transition (T
melt
) and the
annealing transition (T
anneal
) were also calculated for
A B
C
D
E
Fig. 2. CD spectra of preformed quadru-
plexes with various flank lengths in the
absence (black squares) and presence
(white squares) of equimolar concentrations
of corresponding complementary strands for
(A) c-kitG0, (B) c-kitG4, (C) c-kitG6, (D)
c-kitG8 and (E) c-kitG12 in 10 m
M sodium
cacodylate buffer with 100 m
M KCl, pH 7.0,
at 25 °C.
A. Arora et al. Effect of flanking bases on quadruplex stability and Watson–Crick duplex competition
FEBS Journal 276 (2009) 3628–3640 ª 2009 The Authors Journal compilation ª 2009 FEBS 3631
c-kitG8, and are also shown in Table 2. The T
m
val-
ues for c-kitG0, c-kitG4 and c-kitG6 were 60, 55 and
51 °C, respectively. The T
melt
and T
anneal
values for
c-kitG8 were 50 and 47 °C, respectively, and were
accompanied by considerable hysteresis. No melt-
ing ⁄ annealing transition was observed for the
c-kitG12 sequence at 295 nm. This observation sug-
gested that increasing the flank length led to a
decrease in the T
m
value that reflects the reduced ther-
mal stability (Table 2). The various thermodynamic
parameters are summarized in Table 2. The thermody-
namic parameters DG
vH
, DH
vH
and DS
vH
were not
determined for c-kitG8 and c-kitG12 due to the hys-
teresis in c-kitG8 and the lack of a clear transition at
295 nm for c-kitG12. DH
vH
increases with the increase
in flank length from 0 to 6 bases. This increase in the
enthalpy change (DH
vH
) may be due to the increase
in the base-stacking interaction among the flanking
bases. A striking observation was the high increase in
the unfavorable negative entropy change DS
vH
, which
resulted in a decrease in the overall free energy
change (DG
vH
). The decrease in entropy upon increase
in flank length arises due to the intra-residue stacking
interaction in the flank bases. Furthermore, we also
performed concentration-dependent melting of all the
sequences to deduce the molecularity of the structures.
The sequences formed intramolecular structures as
suggested by the concentration-independent thermal
stability (T
m
) (data not shown). Overall, the results
indicated that quadruplex formation becomes less
favorable with the increase in flank length on each
side of the core c-kit quadruplex sequence (Table 2).
Fig. 3. Thermal difference spectrum of c-kitG0 (black squares),
c-kitG4 (open squares), c-kitG6 (open circles), c-kitG8 (open
triangles) and c-kitG12 (open diamonds) resulting from subtraction
of the spectrum obtained at 25 °C from that obtained at 90 °Cin
10 m
M sodium caodylate buffer with 100 mM KCl, pH 7.0.
A
B
C
D
E
Fig. 4. UV melting (open triangles) and annealing (open diamonds)
profiles of preformed c-kit quadruplex with various flank lengths:
(A) c-kitG0, (B) c-kit G4, (C) c-kitG6, (D) c-kitG8 and (E) c-kitG12 in
10 m
M sodium cacodylate buffer, pH 7.0, with 100 mM KCl.
Effect of flanking bases on quadruplex stability and Watson–Crick duplex competition A. Arora et al.
3632 FEBS Journal 276 (2009) 3628–3640 ª 2009 The Authors Journal compilation ª 2009 FEBS
As the quadruplex-forming region does not occur in
isolation, but instead is flanked by other sequences
and is present together with its complementary strand,
it is imperative to analyze the effect of these neighbor-
ing sequences on the quadruplex ⁄ duplex equilibrium
also.
In order to assess the influence of flanking bases on
the quadruplex ⁄ duplex equilibrium, we investigated the
CD spectral changes on addition of corresponding
complementary strand to preformed quadruplex in
KCl buffer. The CD spectra are shown in Fig. 2 (white
squares). For c-kitG0, c-kitG4 and c-kitG6, CD spec-
tra recorded for equimolar concentrations of quadru-
plex and its respective complementary strand showed a
positive peak at 270 nm coupled with an increase in
the intensity of bands at 240 nm (Fig. 2A–C, white
squares). These spectral features are characteristic of
the B-DNA form, and suggest the formation of duplex
when complementary strands are added to a quadru-
plex. However, they do not confirm complete duplex
formation for equimolar mixtures of preformed quad-
ruplex and its complementary strand in 100 mm KCl
buffer. For the c-kitG8 ⁄ C8 system, a small positive
peak at 270 nm together with a more intense positive
band at 286 nm coupled with an increase in the inten-
sity of the negative band at 240 nm was observed
(Fig. 2D, white squares). A broad positive CD band at
286 nm together with negative CD band at 240 nm for
c-kitG12 ⁄ C12 indicates that there is no change in the
CD spectrum of c-kitG12 when incubated with its
complementary strand (c-kitC12) in 1 : 1 ratio
(Fig. 2E, white squares). These observations for
c-kitG8 ⁄ C8 and c-kitG12 ⁄ C12 can be ascribed to the
presence of multiple secondary structures in both the
G-rich as well as in the C-rich complementary strands
as discussed below.
Next, to assess the competition between the quadru-
plex and duplex forms under the influence of increas-
ing flank lengths, fluorescence binding experiments
were performed using a donor ⁄ quencher pair of
5¢-fluorescein (donor) and 3¢-dabsyl chloride
(quencher). This technique was chosen because it offers
the advantage of working in the nanomolar range,
which is not possible with UV or CD. FRET-based
studies have also been used effectively to understand
quadruplex structures [37,38,55–57]. Complementary
strands of respective flank lengths were used for
hybridization with fluorophore-labeled sequences. We
investigated the binding affinity of complementary
strands to preformed quadruplexes with various flank
lengths of 0–12 bases in KCl. We observed enhance-
ment of fluorescence intensity on increasing the con-
centration of the complementary strand, indicative of a
greater extent of quadruplex opening. The normalized
relative changes in fluorescence intensity were plotted
against the complementary strand concentration
(Fig. 5), and the binding affinities were calculated by
fitting the plots using Eqn (8), as described in Experi-
mental procedures. The estimated binding affinities are
summarized in Table 3. The binding affinity value for
the complementary strands towards the preformed
G-quadruplexes with various flank lengths increased
with the increase in the flank length from c-kitG0 to
c-kitG6 (Table 3). The K
A
value obtained for
c-kitG8 ⁄ C8 was same as that for c-kitG6 ⁄ C6, and was
decreased for c-kitG12 ⁄ C12 (Table 3).
To complement the fluorescence studies, ITC experi-
ments were performed to obtain the complete thermo-
dynamic profile for quadruplex hybridization to its
complementary strand. The hybridization event was
dependent on nearest-neighbor Watson–Crick base
pairing. Figure 6 shows characteristic sigmoidal curves
obtained for heat of injection for hybridization of
preformed quadruplex to its complementary strand.
Table 4 summarizes the thermodynamic parameters for
the duplex formation obtained from ITC experiments.
The heat of injection profile for duplex formation is
exothermic. The magnitude of negative DH
ITC
reflects
Table 2. Thermodynamic parameters obtained from UV experiments performed in 10 mM sodium cacodylate buffer, 100 mM KCl at pH 7.0 and
25 °C. T
m
is the melting temperature. DH
vH
is the enthalpy change and DS
vH
is the entropy change for G-quadruplex formation. DG
vH
is the free
energy change for G-quadruplex formation. All parameters were calculated as described in Experimental procedures. All the parameters
obtained were within 10% error. T
m
values differed by ± 1.0 °C. ND indicates that values were not determined for c-kitG8 and c-kitG12.
Quadruplex
T
m
(°C)
DH
vH
(kcalÆmol
)1
)
DS
vH
(calÆmol
)1
ÆK
)1
)
DG
vH
(kcalÆmol
)1
)Melting Annealing
c-kitG0 60.0 60.0 )49.0 ± 5.0 )146.0 ± 15.0 )5.5 ± 0.6
c-kitG4 55.0 55.0 )52.5 ± 5.0 )160.0 ± 16.0 )4.8 ± 0.5
c-kitG6 51.0 51.0 )57.5 ± 6.0 )178.0 ± 18.0 )4.5 ± 0.5
c-kitG8 50.0 47.0 ND ND ND
c-kitG12 ND ND ND ND ND
A. Arora et al. Effect of flanking bases on quadruplex stability and Watson–Crick duplex competition
FEBS Journal 276 (2009) 3628–3640 ª 2009 The Authors Journal compilation ª 2009 FEBS 3633
the binding enthalpy for duplex formation, which
increased with the increase in the number of flanking
bases from 0 to 6, and deviation from the increasing
DH
ITC
trend was observed for c-kitG8 and c-kitG12,
as shown in Table 4. The DH values obtained from
ITC experiments were much lower than the expected
value for duplex formation in all cases, i.e.
)166.30 kcalÆmol
)1
for c-kitG0 ⁄ C0, )232.70 kcalÆmol
)1
for c-kitG4 ⁄ C4, )268.50 kcalÆmol
)1
for c-kitG6 ⁄ C6,
)309.40 kcalÆmol
)1
for c-kitG8 ⁄ C8 and )382.20 kcalÆ
mol
)1
for c-kitG12 ⁄ C12, obtained using the nearest-
neighbor method [58]. The enthalpy change in this
process involves endothermic and exothermic contribu-
tions from opening up of the preformed quadruplex
and hybridization between G- and C-rich strands,
respectively. The overall enthalpy change is the sum of
the contribution from each process, leading to a lower
DH
ITC
value than calculated using the nearest-neighbor
method. The DS
ITC
for duplex formation decreased
with the increase in the number of flanking bases from
0 to 6. However, there was deviation from the decreas-
ing DS
ITC
values for c-kitG8 and c-kitG12 as shown in
Table 4. A detailed inspection of Table 4 reveals that
the DH
ITC
values as well as the DG
ITC
values for
c-kitG8 ⁄ C8 and c-kitG12 ⁄ C12 deviate from the increas-
ing trend as observed for c-kitG0 ⁄ C0, c-kitG4 ⁄ C4 and
c-kitG6 ⁄ C6. As shown by TDS, UV hyperchromic tran-
sition at 260 nm and mFOLD analysis, the G-rich
strands of c-kitG8 and c-kitG12 can adopt intra-
molecular stem-loop structure with Watson–Crick base
pairing in the stem region. Likewise, the C-rich comple-
mentary strand can also form such stem-loop structures.
Moreover, the C-rich complementary strand also has
the potential to form a secondary structure called an
i-motif in all the sequences ranging from c-kitC0 to
c-kitC12 at near physiological pH 7.0 [59], although
these structures would be less stable, at physiological
pH as compared to acidic pH, as it has been shown that
intercalated hemiprotonated C:C
+
base pairs are stable
at acidic pH [60,61,62]. To understand the structure
Table 3. Binding affinities (K
A
) of quadruplex with complementary
strands obtained from fluorescence studies in 10 m
M sodium caco-
dylate buffer with 100 m
M KCl, pH 7.0 at 25 °C. The quadruplex
concentration used was 50 n
M and the respective complementary
strand concentration varied from 0 to 1 l
M. The values obtained
were within 10% error.
Duplex K
A
(M
)1
)
c-kitG0 ⁄ C0 4.0 ± 0.4 · 10
6
c-kitG4 ⁄ C4 8.0 ± 0.9 · 10
6
c-kitG6 ⁄ C6 3.2 ± 0.3 · 10
7
c-kitG8 ⁄ C8 3.0 ± 0.2 · 10
7
c-kitG12 ⁄ C12 2.5 ± 0.3 · 10
6
Fig. 6. ITC binding profile of equimolar mixtures of c-kitG0 (black
square), c-kitG4 (open square), c-kitG6 (open circle), c-kitG8 (open
triangle) and c-kitG12 (open diamond) preformed quadruplex
sequences with corresponding complementary strands in 10 m
M
sodium caodylate buffer with 100 mM KCl, pH 7.0, at 25 °C.
Fig. 5. Plots of normalized relative fluorescence emission intensity
(DF, as described in the text) of quadruplex (30 n
M) at 520 nm ver-
sus complementary strand concentration in 10 m
M sodium caody-
late buffer with 100 m
M KCl, pH 7.0, at 25 °C. The complementary
strands used were c-kitC0 (black square), c-kitC4 (open square),
c-kitC6 (open circle), c-kitC8 (open triangle) and c-kitC12 (open
diamond).
Effect of flanking bases on quadruplex stability and Watson–Crick duplex competition A. Arora et al.
3634 FEBS Journal 276 (2009) 3628–3640 ª 2009 The Authors Journal compilation ª 2009 FEBS
adopted by c-kit C-rich strands, we performed CD stud-
ies (Fig. S3) and UV melting studies at 287 and 265 nm
(Fig. S4) at both pH 6.0 and 7.0. Both CD and UV
melting studies showed that the C-rich strands c-kitC0,
c-kitC4 and c-kitC6 adopt i-motif structure at pH 6.0,
but no such structure formation takes place at pH 7.0.
Moreover, c-kitC8 and c-kitC12 did not show the
i-motif structure signature; instead, the UV melting
profiles at 265 nm for c-kitC8 and c-kitC12 showed
$ 10% hyperchromicity, thus indicating the presence of
an intramolecular stem–loop structure at both pH 6.0
and 7.0 (Fig. S4). The sum of the CD spectra for both
the G- and C-rich individual strands (Fig. S5) was also
found to be similar to the CD spectra of mixtures of
both the strands at pH 7.0 as shown in Fig. 2.
Furthermore, to understand the contribution of
i-motif structures in quadruplex ⁄ Watson–Crick duplex
competition, we also performed ITC titrations at pH 6.0
(Fig. S6), and data are presented in Table S1. ITC
experiments at pH 6.0 showed that the binding affinity
of c-kitC4 and c-kitC6 strands to their respective G-rich
strands decreases almost by one order of magnitude
(Fig. S6 and Table S1) compared to the affinity at pH
7.0 (Table 4), but G0 sequences remained unopened in
the presence of respective complementary c-kitC0
strands (Fig. S6). However, ITC titration data for the
c-kitG8 ⁄ C8 and c-kitG12 ⁄ C12 system remain unaffected
and similar at both pH 6.0 and 7.0 (Fig. S6 and
Table S1). This rules out the possibility of a significant
contribution of i-motif structures in c-kit C-rich strands
to quadruplex ⁄ Watson–Crick duplex competition at
physiological pH 7.0.
Together, the results obtained from CD, fluorescence
and ITC titration experiments in the c-kitG8 ⁄ C8 and
c-kitG12 ⁄ C12 systems demonstrate that structural com-
petition is imposed by the intramolecular stem–loop
structure in C-rich complementary strand, thus affecting
the quadruplex ⁄ Watson–Crick duplex equilibria at both
pH 7.0 and the near physiological pH of 6.0. The pres-
ence of intramolecular stem–loop structures in the
C-rich complementary strand leads to the existence of
competition and thus hinders opening of the secondary
structures in c-kitG8 and c-kitG12 G-rich sequences.
These observations indicate that the increase in flank
length from 0 to 6 on each side of the c-kit core quadru-
plex-forming sequence drives efficient invasion and bet-
ter conversion of quadruplex to duplex, and competes
out quadruplex in this structural competitive equilib-
rium. However, this is not the case for flank lengths
of 8 and 12 due to the presence of intramolecular
stem–loop structures in both the G-rich and C-rich
strands.
The parameter that highlights the predominance of
either of population (duplex or quadruplex) is the rela-
tive free energy difference, DDG
25 °C
, between duplex
and quadruplex structures. In this study, we have
obtained thermodynamic profiles of quadruplexes by
UV melting experiments. However, it was difficult to
obtain the thermodynamic parameters involved in
duplex formation from the same sequences and their
respective complementary strands by UV melting stud-
ies, as this includes contributions from both duplex
and quadruplex. Therefore, we obtained the thermo-
dynamic profile for duplexes from ITC experiments
(Table 4). The relative free energy difference, DDG
25 °C
,
between duplex and quadruplex structure increase
from )3.3 to )5.6 kcalÆmol
)1
upon an increase in flank
length from 0 to 6. It is noteworthy that DDG
25 °C
val-
ues are reasonably negative in all cases, indicating that
duplex is the predominant structure. We also observed
an increase in duplex stability upon an increase in
flank length (Table 4). The greater the negative magni-
tude of DDG
25 °C
, the higher is the predominance of
duplex at equilibrium.
Table 4. Thermodynamic parameters obtained from ITC experiments performed in 10 mM sodium cacodylate buffer, pH 7.0, 100 mM KCl at
25 °C. Thermodynamic parameters were obtained for complementary strand binding to the preformed quadruplexes at 25 °C. The quadru-
plex concentration in the cell was 5–10 l
M and the complementary strand concentration in the syringe was 100–250 lM. N is the stoichiom-
etry of complementary strand binding to preformed quadruplex. DH
ITC
is the enthalpy change and DS
ITC
is the entropy change for duplex
formation. DG
ITC
is the free energy change for duplex formation and was determined using the relationship DG = )RT ln K
A
, where R is the
universal gas constant, T is the temperature in Kelvin (K), and K
A
is the binding affinity for duplex formation. All the parameters obtained
were within 10% error.
Duplex N
K
A
(10
6
M
)1
)
DH
ITC
(kcalÆmol
)1
)
DS
ITC
(calÆmol
)1
ÆK
)1
)
DG
ITC
(kcalÆmol
)1
)
c-kitG0 ⁄ C0 0.6 3.2(± 0.3) )23.0(± 2.0) )47.5(± 5.0) )8.8(± 0.9)
c-kitG4 ⁄ C4 0.7 7.0(± 0.6) )47.0(± 5.0) )126.5(± 12.0) )9.3(± 0.9)
c-kitG6 ⁄ C6 0.6 28(± 2.5) )92.0(± 9.0) )274.8(± 27.0) )10.1(± 1.0)
c-kitG8 ⁄ C8 0.6 27(± 3.0) )94.0(± 9.2) )281.6(± 28.0) )10.1(± 1.0)
c-kitG12 ⁄ C12 0.8 2.5(± 0.3) )66.0(± 6.0) )192.3(± 19.2) )8.7(± 0.9)
A. Arora et al. Effect of flanking bases on quadruplex stability and Watson–Crick duplex competition
FEBS Journal 276 (2009) 3628–3640 ª 2009 The Authors Journal compilation ª 2009 FEBS 3635
Based on a search algorithm designed by Huppert
and Balasubramanian [11], it has been predicted that,
in principle, as many as 376 000 quadruplexes could
exist in the human genome. However, our study
suggests a lower likelihood of quadruplex formation
at all these sites, as the presence of flanking bases
on each side of the c-kit core quadruplex sequence
destabilizes the quadruplex structure. Furthermore,
an increase in the number of flanking bases leads to
the existence of alternative structures other than
quadruplexes. In the genome, these sites will have
many more bases flanking them than used in our
studies, casting doubt on the global presence of
quadruplex structures with a general role in the bio-
logical system. On the other hand, several studies
have indicated the existence of quadruplexes in vivo
[63] and their ability to regulate gene expression [12–
14]. Their significant role in the telomeric region has
also been well established [2,5,42–44]. Further indica-
tions of the presence of quadruplexes in the living
system come from the fact that cells contain factors
that actively cleave and unwind G4 DNA [25]. It
thus seems apparent that cells may have some mech-
anism(s) that favors formation of either quadruplexes
or duplexes according to their biological relevance,
thus suggesting the importance of the quadru-
plex ⁄ duplex equilibrium in modulating biological
activities.
Conclusion
In the present study, we have explored the effect of
flanking sequences on quadruplex stability and quadru-
plex ⁄ duplex competition in order to understand the
likely scenario in the cell, where quadruplex sites have
additional sequences at both their ends. The study
shows that the presence of flanking bases affects the
thermodynamic stability of the G-quadruplex. With an
increase in the flank length, the increase in the more
favorable negative enthalpy change (DH
vH
) is accom-
panied by an increase in the unfavorable negative
entropy change (DS
vH
), resulting in a decrease in the
overall free energy change (DG
vH
). The study also
shows that, with the increase in the number of flanking
bases, there is an increased propensity for the existence
of other alternative structures that may compete with
G-quadruplex formation. Our work shows that the
presence of flanks destabilizes the G-quadruplex struc-
ture and drives the equilibrium towards duplex forma-
tion. If this is indeed the case, the probability of the
existence of these structures as global regulatory motif
in the genome, prima facie, appears to be context-
dependent.
Experimental procedures
Materials
Oligonucleotides were obtained from Microsynth (Balgach,
Switzerland). The sequences of the oligonucleotides used
in these studies are given in Table 1. c-kitG0, c-kitG4,
c-kitG6, c-kitG8 and c-kitG12 represent the c-kit quadru-
plex sequence with various flank lengths, and c-kitC0,
c-kitC4, c-kitC6, c-kitC8 and c-kitC12 represent their
respective complementary strands (Table 1). All the
sequences containing core quadruplex-forming motifs with
varying flank lengths used in our study were labeled using
the fluorophores 5¢-fluorescein and 3¢-dabsyl chloride. The
concentrations of unlabeled oligonucleotide solutions were
determined based on the absorbance at 260 nm and 80 °C
using molar extinction coefficients of 213, 290, 321, 354
and 419 mm
)1
Æcm
)1
for c-kitG0, c-kitG4, c-kitG6, c-kitG8
and c-kitG12, respectively, and 164, 234, 275, 308 and
382 mm
)1
Æcm
)1
for c-kitC0, c-kitC4, c-kitC6, c-kitC8 and
c-kitC12, respectively. These values were calculated by
extrapolation of tabulated values for the dimers and
monomer bases at 25–80 °C using procedures described
previously [64,65]. Concentrations of the labeled oligonu-
cleotide were determined by measuring the absorbance of
the attached fluorescein moiety at 496 nm using a molar
extinction coefficient of 4.1 · 10
4
m
)1
Æcm
)1
[66]. In all
studies, we used preformed quadruplexes obtained by
heating solutions containing G-rich sequences in 100 mm
KCl to 100 °C for 5 min and gradually cooling to room
temperature at the rate of 0.2 °CÆmin
)1
, and then kept for
7 days at 4 °C prior to experimentation.
Circular dichroism spectroscopy
CD spectra were measured using a Jasco model J-715 spec-
tropolarimeter (Jasco, Tokyo, Japan) equipped with a ther-
moelectrically controlled cell holder and a cuvette with a
path length of 1 cm. Scans were performed over a range of
200–350 nm in 10 mm sodium cacodylate buffer (pH 7.0)
with 100 mm KCl at 25 °C. Preformed G-quadruplexes with
various flank lengths were incubated with equimolar concen-
trations of respective flank length at 25 °C for 24 h prior to
CD experiments. The spectra of preformed quadruplexes at a
concentration of 7.5 lm in the absence and presence of equi-
molar concentrations of the complementary strand were
obtained. A buffer baseline spectrum was obtained using the
same cuvette and subtracted from sample spectra.
Thermal difference spectrum
For each oligonucleotide sample, an UV spectrum was
recorded above and below its melting temperature (T
m
). The
difference between the UV spectrum at high temperature
Effect of flanking bases on quadruplex stability and Watson–Crick duplex competition A. Arora et al.
3636 FEBS Journal 276 (2009) 3628–3640 ª 2009 The Authors Journal compilation ª 2009 FEBS
(95 °C) and the UV spectrum at low temperature (25 °C) is
defined as the TDS, and represents the spectral difference
between the unfolded and the folded form. The TDS were
normalized, using a value of +1 for the highest positive
peak.
Thermal denaturation/renaturation using
UV-visible spectroscopy
Oligonucleotides were dissolved in 10 mm sodium cacodylate
buffer pH 7.0 with 100 mm KCl at final concentrations rang-
ing from 2 to 10 lm, depending on the oligonucleotide
length. Samples (1 ml) were placed in a stoppered quartz
cuvette of 1 cm path length, and then thermal denatur-
ation ⁄ renaturation was performed using a Cary 100 UV ⁄ vis-
ible spectrophotometer (Varian, Walnut Creek, CA, USA)
equipped with a Peltier effect heated cuvette holder. A tem-
perature range of 25–95 °C was used to monitor the absor-
bance at 295 nm at a heating ⁄ cooling rate of 0.2 °CÆmin
)1
.
The absorbance profiles recorded at 295 nm were analyzed
using a non-linear least-squares curve-fitting method. This
method involved contributions from pre- and post-transition
baselines, and thermodynamic data were obtained using
equations described previously [67,68]. The analysis was
performed using mathematica 5.1 (Wolfram Research,
Champaign, IL, USA) and origin 7.0 (Microcal Inc.,
Northampton, MA, USA).
The following equations were used to calculate the
thermodynamic data:
A
u
¼ b
u
þ m
u
à TðÞ ð1Þ
A
l
¼ b
l
þ m
l
à TðÞ ð2Þ
K
eq
¼
ð1 À aÞ
a
ð3Þ
AðTÞ¼a
Ã
ðA
u
À A
l
ÞþA
l
ð4Þ
K
eq
¼ exp
DG
o
RT
¼ exp
DH
o
RT
þ
DS
o
R
ð5Þ
Equations 1 and 2 are linear equations where A
u
and A
l
are terms describing upper and lower baselines, respectively,
b
u
and b
l
are fitted parameters for the intercepts for the
upper and lower baseline, and m
u
and m
l
are the respective
slopes. K
eq
is the equilibrium constant for the unstruc-
tured ⁄ structured transition for an intramolecular system,
and a is the folded fraction. A (T) is the dependent variable
and is the experimentally determined absorbance at each
temperature (T). Using these equations, the van’t Hoff
enthalpy (DH
vH
) and entropy (DS
vH
) were calculated, and
T
m
was calculated from the peak value of the first deriva-
tive of the fitted curve. Tm values differed by ± 1.0 °C.
The Gibbs free energy (DG
vH
) was calculated at 25 °C using
the equation DG
vH
= DH
vH
) TDS
vH
, assuming DCp =0.
Fluorescence studies
A FLUOstar OPTIMA fluorescence plate reader (BMG
Lab technologies, Melbourne, Australia) was used to deter-
mine the binding affinities of fluorophore-labeled c-kitG0,
c-kitG4, c-kitG6, c-kitG8 and c-kitG12 to their respective
complementary strands (sequences given in Table 1) in the
presence of 100 mm KCl. The plate reader makes it possi-
ble to work on systems that suffer from thermodynamic
and kinetic inertia, thus requiring prolonged incubation,
and enables study of many samples at dilute concentration
[38]. The experiments were performed in 384-well plates,
using 480 nm excitation and 520 nm emission filters. The
wells were loaded with solutions of a fixed concentration of
preformed quadruplex (50 nm) and increasing concentra-
tions of complementary strand (0–1 lm). Sample mixtures
were incubated for 24 h at 25 °C, and the plate was read
at 520 nm. For analysis of data, the observed fluorescence
intensity was considered as the sum of the weighted contri-
butions from folded G-quadruplex strand and extended
G-strand in the duplex form:
F ¼ 1 À a
b
ðÞF
0
þ a
b
F
b
ð6Þ
where F is the observed fluorescence intensity at each
titrant concentration, F
0
and F
b
are the fluorescence intensi-
ties of the initial and final states of titration, respectively,
and a
b
is the mole fraction of quadruplex in duplex form.
Assuming 1 : 1 stoichiometry for the interaction involving
complementary strand binding, it can be shown that:
Q½
0
a
2
b
À Q½
0
þ C½þ1
=
K
A
ÀÁ
a
b
þ C½¼0 ð7Þ
where K
A
is the association constant, [Q]
0
is the total
G-strand concentration, and [C] is the complementary
strand concentration.
From Eqns (6) and (7), it can be shown that:
DF ¼ DF
max
=
2 Q
0
½ðÞQ½
0
þ C½þ1
=
K
A
ÀÁ
&
À
ffiffiffiffiffiffiffiffiffiffiffiffiffiffiffiffiffiffiffiffiffiffiffiffiffiffiffiffiffiffiffiffiffiffiffiffiffiffiffiffiffiffiffiffiffiffiffiffiffiffiffiffiffiffiffiffiffiffiffiffiffi
Q½
0
þ C½þ1
=
K
A
ÀÁ
2
À4 Q½
0
C½
q
'
ð8Þ
where DF = F ) F
0
and DF
max
= F
max
) F
0
.
Isothermal titration calorimetry experiment
The ITC experiment was performed using a Microcal
VP-ITC titration calorimeter. The 300 ll syringe was filled
with 146 lm of complementary strand. Titration was per-
formed by injecting 10 ll aliquots of complementary strand
A. Arora et al. Effect of flanking bases on quadruplex stability and Watson–Crick duplex competition
FEBS Journal 276 (2009) 3628–3640 ª 2009 The Authors Journal compilation ª 2009 FEBS 3637
into the cell containing 10 lm of preformed quadruplex at
8 min intervals at 25 °C, and complete mixing was accom-
plished by stirring with the syringe paddle at 300 r.p.m.
Titration curves were corrected for heat of dilution by
injecting the complementary oligonucleotide into 10 mm
sodium cacodylate buffer at pH 6.0 and 7.0 in the presence
of 100 mm KCl. The resultant titration plot was fitted to a
sigmoid curve by a non-linear least-squares method using
origin 7.0 (Microcal Software). The binding constant K
A
,
the stoichiometry N and the enthalpy change DH were
obtained from the curve fitting. The Gibbs free energy
change DG and the entropy DS were calculated from the
equation DG = )RT ln K
A
= DH ) TDS.
Acknowledgements
S.M. acknowledges Council for Scientific and Industrial
Research (CSIR) for funding this research. A.A
acknowledges a research fellowship from University
Grants Commission (UGC), India.
References
1 Gellert M, Lipsett MN & Davies DR (1962) Helix
formation by guanylic acid. Proc Natl Acad Sci USA
48, 2013–2018.
2 Balagurumoorthy P & Brahmachari SK (1994) Struc-
ture and stability of human telomeric sequence. J Biol
Chem 269, 21858–21869.
3 Kankia BI & Marky LA (2001) Folding of the
thrombin aptamer into a G-quadruplex with Sr
2+
:
stability, heat, and hydration. J Am Chem Soc 123,
10799–10804.
4 Olsen CM, Gmeiner WH & Marky LA (2006) Unfold-
ing of G-quadruplexes: energetic, and ion and water
contributions of G-quartet stacking. J Phys Chem B
110, 6962–6969.
5 Gomez D, Lemarteleur T, Lacroix L, Mailliet P, Mergny
JL & Riou JF (2004) Telomerase downregulation induced
by the G-quadruplex ligand 12459 in A549 cells is medi-
ated by hTERT RNA alternative splicing. Nucleic Acids
Res 32, 371–379.
6 Sacca
`
B, Lacroix L & Mergny JL (2005) The effect of
chemical modifications on the thermal stability of differ-
ent G-quadruplex-forming oligonucleotides. Nucleic
Acids Res 33, 1182–1192.
7 Miyoshi D, Nakao A & Sugimoto N (2003) Structural
transition from anti-parallel to parallel G-quadruplex of
d(G
4
T
4
G
4
) induced by Ca
2+
. Nucleic Acids Res 31,
1156–1163.
8 Miyoshi D, Karimata H & Sugimoto N (2006) Hydra-
tion regulates thermodynamics of G-quadruplex forma-
tion under molecular crowding conditions. J Am Chem
Soc 128, 7957–7963.
9 Krishnan-Ghosh Y, Liu D & Balasubramanian S (2004)
Formation of an interlocked quadruplex dimer by
d(GGGT). J Am Chem Soc 126 , 11009–11016.
10 Hazel P, Huppert J, Balasubramanian S & Neidle S
(2004) Loop-length-dependent folding of G-quadru-
plexes. J Am Chem Soc 126, 16405–16415.
11 Huppert JL & Balasubramanian S (2005) Prevalence of
quadruplexes in the human genome. Nucleic Acids Res
33, 2908–2916.
12 Simonsson T, Pecinka P & Kubista M (1998) DNA
tetraplex formation in the control region of c-myc .
Nucleic Acids Res 26, 1167–1172.
13 Simonsson T & Henriksson M (2002) c-myc suppression
in Burkitt’s lymphoma cells. Biochem Biophys Res
Commun 290, 11–15.
14 Jain AS, Grand CL, Bearss DJ & Hurley LH (2002)
Direct evidence for a G-quadruplex in a promoter
region and its targeting with a small molecule to repress
c-MYC transcription. Proc Natl Acad Sci USA 99,
11593–11598.
15 Rangan A, Fedoroff OY & Hurley LH (2001) Induction
of duplex to G-quadruplex transition in the c-myc
promoter region by a small molecule. J Biol Chem 276,
4640–4646.
16 Rankin S, Reszka AP, Huppert J, Parkinson GN, Todd
AK, Ladame S, Balasubramanian S & Neidle S (2005)
Highly prevalent putative quadruplex formation within
the c-kit oncogene. J Am Chem Soc 127, 10584–10589.
17 Cogoi S & Xodo LE (2006) G-quadruplex formation
within the promoter of the KRAS proto-oncogene
and its effect on transcription. Nucleic Acids Res 34,
2536–2549.
18 Xu Y & Sugiyama H (2006) Formation of the G-quad-
ruplex and i-motif structures in retinoblastoma suscepti-
bility genes (Rb). Nucleic Acids Res 34, 949–954.
19 Sen D & Gilbert W (1988) Formation of parallel
four-stranded complexes by guanine-rich motifs in
DNA and its implications for meiosis. Nature 334,
364–366.
20 Catasti P, Chen X, Moyzis RK, Bradbury EM &
Gupta G (1996) Structure–function correlation of the
insulin-linked polymorphic region. J Mol Biol 264,
410–414.
21 Kettani A, Kumar AR & Patel DJ (1995) Solution
structure of a DNA quadruplex containing the fragile X
syndrome triple repeat. J Mol Biol 254, 638–656.
22 Saha T & Usdin K (2001) Tetraplex formation by the
progressive myoclonus epilepsy type-1 repeat: implica-
tions for instability in the repeat expansion diseases.
FEBS Lett 491, 184–187.
23 De Armond R, Wood S, Sun D, Hurley LH & Ebbing-
haus SW (2005) Evidence for the presence of a guanine
quadruplex forming region within a polypurine tract of
the hypoxia inducible factor 1a
promoter. Biochemistry
44, 16341–16350.
Effect of flanking bases on quadruplex stability and Watson–Crick duplex competition A. Arora et al.
3638 FEBS Journal 276 (2009) 3628–3640 ª 2009 The Authors Journal compilation ª 2009 FEBS
24 Sun D, Guo K, Rusche JJ & Hurley LH (2005) Facilita-
tion of a structural transition in the polypurine ⁄ polypy-
rimidine tract within the proximal promoter region of
the human VEGF gene by the presence of potassium
and G-quadruplex-interactive agents. Nucleic Acids Res
33, 6070–6080.
25 Fry M (2007) Tetraplex DNA and its interacting
proteins. Front Biosci 12, 4336–4351.
26 Kumar N & Maiti S (2004) Quadruplex to Watson–
Crick duplex transition of the thrombin binding
aptamer: a fluorescence resonance energy transfer study.
Biochem Biophys Res Commun 319, 759–767.
27 Hardin CC, Watson T, Corregan M & Bailey C (1992)
Cation dependent transition between the quadruplex
and Watson–Crick hairpin forms of d(CGCG
3
GCG).
Biochemistry 31, 833–841.
28 Miura T & Thomas GJ (1994) Structural polymorphism
of telomere DNA: interquadruplex and duplex–quadru-
plex conversions probed by Raman spectroscopy.
Biochemistry 33, 7848–7856.
29 Deng H & Braunlin WH (1995) Duplex to quadruplex
equilibrium of the self-complementary oligonucleotide
d(GGGGCCCC). Biopolymers 35, 677–681.
30 Halder K, Mathur V, Chugh D, Verma A & Chowdhury
S (2005) Quadruplex–duplex competition in the nuclease
hypersensitive element of human c-myc promoter: C to T
mutation in C-rich strand enhances duplex association.
Biochem Biophys Res Commun 327, 49–56.
31 Datta B & Armitage BA (2001) Hybridization of
PNA to structured DNA targets: quadruplex invasion
and the overhang effect. J Am Chem Soc 123, 9612–
9619.
32 Phan AT & Mergny JL (2002) Human telomeric DNA:
G-quadruplex, i-motif and Watson–Crick double helix.
Nucleic Acids Res 30, 4618–4625.
33 Li W, Wu P, Ohmichia T & Sugimoto N (2002) Char-
acterization and thermodynamic properties of quadru-
plex ⁄ duplex competition. FEBS Lett 526, 77–81.
34 Green JJ, Ying L, Klenerman D & Balasubramanian S
(2003) Kinetics of unfolding the human telomeric DNA
quadruplex using a PNA trap. J Am Chem Soc 125,
3763–3767.
35 Ying L, Green JJ, Li H, Klenerman D & Balasubrama-
nian S (2003) Studies on the structure and dynamics of
the human telomeric G quadruplex by single-molecule
fluorescence resonance energy transfer. Proc Natl Acad
Sci USA 100, 14629–14634.
36 Risitano A & Fox KR (2003) Stability of intramolecular
DNA quadruplexes: comparison with DNA duplexes.
Biochemistry 42, 6507–6513.
37 Li W, Miyoshi D, Nakano S & Sugimoto N (2003)
Structural competition involving G-quadruplex DNA
and its complement. Biochemistry 42, 11736–11744.
38 Kumar N & Maiti S (2005) The effect of osmolytes and
small molecule on quadruplex ⁄ Watson–Crick duplex
equilibrium: a fluorescence resonance energy transfer
study. Nucleic Acids Res 33, 6723–6732.
39 Miyoshi D, Matsumura S, Nakano S & Sugimoto N
(2004) Duplex dissociation of telomere DNAs induced
by molecular crowding. J Am Chem Soc 126,
165–169.
40 Kumar N & Maiti S (2007) Role of locked nucleic acid
modified complementary strand in quadruplex ⁄ Watson–
Crick duplex equilibrium. J Phys Chem B 111,
12328–12337.
41 Kumar N, Sahoo B, Varun KA, Maiti S & Maiti S
(2008) Effect of loop length variation on quadruplex–
Watson Crick duplex competition. Nucleic Acids Res
13, 4433–4442.
42 Phan AT, Kuryavyi V, Luu KN & Patel DJ (2007)
Structure of two intramolecular G-quadruplexes formed
by natural human telomere sequences in K
+
solution.
Nucleic Acids Res 35, 6517–6525.
43 Yu HQ, Miyoshi D & Sugimoto N (2006) Character-
ization of structure and stability of long telomeric
DNA G-quadruplexes. J Am Chem Soc 128,
15461–15468.
44 Kelland L (2007) Targeting the limitless replicative
potential of cancer: the telomerase ⁄ telomere pathway.
Clin Cancer Res 13, 4960–4963.
45 Yang D & Hurley LH (2006) Structure of the biologi-
cally relevant G-quadruplex in the c-MYC promoter.
Nucleosides Nucleotides Nucleic Acids 25, 25951–25968.
46 Todd AK, Haider SM, Parkinson GN & Neidle S
(2007) Sequence occurrence and structural uniqueness
of a G-quadruplex in the human c-kit promoter. Nucleic
Acids Res 35, 5799–5808.
47 Shirude PS, Okumus B, Ying L, Ha T & Balasubrama-
nian S (2007) Single-molecule conformational analysis
of G-quadruplex formation in the promoter DNA
duplex of the proto-oncogene c-kit. J Am Chem Soc
129, 7484–7485.
48 Phan AT, Kuryavyi V, Burge S, Neidle S & Patel DJ
(2007) Structure of an unprecedented G-quadruplex
scaffold in the human c-kit promoter. J Am Chem Soc
129, 4386–4392.
49 Fernando H, Reszka AP, Huppert J, Ladame S, Rankin
S, Venkitaraman AR, Neidle S & Balasubramanian S
(2006) A conserved quadruplex motif located in a tran-
scription activation site of the human c-kit oncogene.
Biochemistry 45, 7854–7860.
50 Bejugam M, Sewitz S, Shirude PS, Rodriguez R, Shahid
R & Balasubramanian S (2007) Trisubstituted isoalloxa-
zines as a new class of G-quadruplex binding ligands:
small molecule regulation of c-kit oncogene expression.
J Am Chem Soc 129, 12926–12927.
51 Balagurumoorthy P, Brahmachari SK, Mohanty D,
Bansal M & Sasisekharan V (1992) Hairpin and parallel
quartet structures for telomeric sequences. Nucleic Acids
Res 20, 4061–4067.
A. Arora et al. Effect of flanking bases on quadruplex stability and Watson–Crick duplex competition
FEBS Journal 276 (2009) 3628–3640 ª 2009 The Authors Journal compilation ª 2009 FEBS 3639
52 Mergny JL, Li J, Lacroix L, Amrane S & Chaires JB
(2005) Thermal difference spectra: a specific signature
for nucleic acid structures. Nucleic Acids Res 33, e138.
53 Walter AE, Turner DH, Kim J, Lyttle MH, Muller P,
Mathews DH & Zuker M (1994) Coaxial stacking of
helixes enhances binding of oligoribonucleotides and
improves predictions of RNA folding. Proc Natl Acad
Sci USA 91, 9218–9222.
54 Mergny JL, Phan AT & Lacroix L (1998) Following
G-quartet formation by UV-spectroscopy. FEBS Lett
435, 74–78.
55 Mergny JL & Maurizot JC (2001) Fluorescence
resonance energy transfer as a probe for G-quartet for-
mation by a telomeric repeat. Chembiochem 2, 124–132.
56 Mergny JL (1999) Fluorescence energy transfer as a
probe for tetraplex formation: the i-motif. Biochemistry
38, 1573–1581.
57 Risitano A & Fox KR (2004) Influence of loop size on
the stability of intramolecular DNA quadruplexes.
Nucleic Acids Res 32, 2598–2606.
58 SantaLucia J Jr (1998) A unified view of polymer,
dumbbell and oligonucleotide DNA nearest-neighbor
thermodynamics. Proc Natl Acad Sci USA 95,
1460–1465.
59 Simonsson T, Pribylova M & Vorlickova M (2000) A
nuclease hypersensitive element in the human c-myc
promoter adopts several distinct i-tetraplex structures.
Biochem Biophys Res Commun 319, 158–166.
60 Gehring K, Leroy JL & Gue
´
ron M (1993) A tetrameric
DNA structure with protonated cytosine-cytosine base
pairs. Nature 363, 561–565.
61 Manzini G, Yathindra N & Xodo LE (1994) Evidence
for intramolecularly folded i-DNA structures in biologi-
cally relevant CCC-repeat sequences. Nucleic Acids Res
22, 4634–4640.
62 Rohozinski J, Hancock JM & Keniry MA (1994)
Polycytosine regions contained in DNA hairpin loops
interact via a four-stranded, parallel structure similar to
the i-motif. Nucleic Acids Res 22, 4653–4659.
63 Duquette ML, Handa P, Vincent JA, Taylor AF &
Maizels N (2004) Intracellular transcription of G-rich
DNAs induces formation of G-loops, novel structures
containing G4 DNA. Genes Dev 18, 1618–1629.
64 Cantor CR, Warshaw MM & Shapiro H (1970)
Oligonucleotide interactions. III. Circular dichroism
studies of the conformation of deoxyoligonucleolides.
Biopolymers 9, 1059–1077.
65 Marky LA, Blumenfeld KS, Kozlowski S & Breslauer
KJ (1983) Salt-dependent conformational transitions in
the self-complementary deoxydodecanucleotide
d (CGCAATTCGCG): Evidence for hairpin formation.
Biopolymers 9, 1247–1257.
66 Sjo
¨
back R, Nygren J & Kubista M (1998) Characteriza-
tion of fluorescein–oligonucleotide conjugates and mea-
surement of local electrostatic potential. Biopolymers
464, 445–453.
67 Bishop GR, Ren J, Polander BC, Jeanfreau BD, Trent
JO & Chaires JB (2007) Energetic basis of molecular
recognition in a DNA aptamer. Biophys Chem 126,
165–175.
68 McTigue PM, Peterson RJ & Kahn JD (2004)
Sequence-dependent thermodynamic parameters for
locked nucleic acid (LNA)–DNA duplex formation.
Biochemistry 43, 5388–5405.
Supporting information
The following supplementary material is available:
Fig. S1. UV melting profile at 260 nm of preformed
c-kit quadruplexes with various flank lengths.
Fig. S2. Schematic representation of the parallel topol-
ogy adopted by c-kitG0, c-kitG4 and c-kitG6 and the
predicted secondary structure using mFOLD software
for c-kitG8 and c-kitG12 sequences.
Fig. S3. CD spectra of 10 lm C-rich strands in
100 mm KCl buffer for c-kit C0, c-kitC4, c-kitC6,
c-kitC8 and c-kitC12 sequences at pH 6.0 and 7.0.
Fig. S4. Normalized UV annealing and melting curves
for c-kitC0, c-kitC4, c-kitC6, c-kitC8 and c-kitC12
complementary strands at pH 6.0 and 7.0.
Fig. S5. CD spectra of the sum of G- and C-rich
strands in 100 mm KCl buffer for c-kitC0, c-kitC4,
c-kitC6, c-kitC8 and c-kitC12 sequences at pH 7.0.
Fig. S6. ITC titration profile for the G-rich c-kitG0,
c-kitG4, c-kitG6, c-kitG8 and c-kitG12 strands with
their respective complementary C-rich strands at pH
6.0.
Table S1. Thermodynamic parameters obtained from
ITC experiments.
This supplementary material can be found in the
online version of this article.
Please note: Wiley-Blackwell is not responsible for
the content or functionality of any supplementary
materials supplied by the authors. Any queries (other
than missing material) should be directed to the corre-
sponding author for the article.
Effect of flanking bases on quadruplex stability and Watson–Crick duplex competition A. Arora et al.
3640 FEBS Journal 276 (2009) 3628–3640 ª 2009 The Authors Journal compilation ª 2009 FEBS