Báo cáo khoa học: Kinetic and mechanistic characterization of Mycobacterium tuberculosis glutamyl–tRNA synthetase and determination of its oligomeric structure in solution pptx
Bạn đang xem bản rút gọn của tài liệu. Xem và tải ngay bản đầy đủ của tài liệu tại đây (706.57 KB, 20 trang )
Kinetic and mechanistic characterization of
Mycobacterium tuberculosis glutamyl–tRNA synthetase
and determination of its oligomeric structure in solution
Stefano Paravisi
1
, Gianluca Fumagalli
1
, Milena Riva
1
, Paola Morandi
1
, Rachele Morosi
1
, Peter V.
Konarev
2,3
, Maxim V. Petoukhov
2,3
, Ste
´
phane Bernier
4
, Robert Che
ˆ
nevert
4
, Dmitri I. Svergun
2,3
,
Bruno Curti
1
and Maria A. Vanoni
1
1 Dipartimento di Scienze Biomolecolari e Biotecnologie, Universita
`
degli Studi di Milano, Italy
2 European Molecular Biology Laboratory, Hamburg, Germany
3 Institute of Crystallography, Russian Academy of Sciences, Moscow, Russia
4De
´
partment de Chimie, CREFSIP, Universite
´
Laval, Canada
Keywords
glutamyl–tRNA reductase; glutamyl–tRNA
synthetase; Mycobacterium tuberculosis;
protein synthesis; tetrapyrrole synthesis
Correspondence
M. A. Vanoni, Dipartimento di Scienze
Biomolecolari e Biotecnologie, Universita’
degli Studi di Milano, Via Celoria 26, 20131
Milan, Italy
Fax: +39 025 031 4895
Tel: +39 025 031 4901
E-mail:
(Received 15 October 2008, revised 23
December 2008, accepted 24 December
2008)
doi:10.1111/j.1742-4658.2009.06880.x
Mycobacterium tuberculosis glutamyl–tRNA synthetase (Mt -GluRS),
encoded by Rv2992c, was overproduced in Escherichia coli cells, and puri-
fied to homogeneity. It was found to be similar to the other well-character-
ized GluRS, especially the E. coli enzyme, with respect to the requirement
for bound tRNA
Glu
to produce the glutamyl-AMP intermediate, and the
steady-state kinetic parameters k
cat
(130 min
)1
) and K
M
for tRNA (0.7 lm)
and ATP (78 lm), but to differ by a one order of magnitude higher K
M
value for l-Glu (2.7 mm). At variance with the E. coli enzyme, among the
several compounds tested as inhibitors, only pyrophosphate and the glut-
amyl-AMP analog glutamol-AMP were effective, with K
i
values in the lm
range. The observed inhibition patterns are consistent with a random bind-
ing of ATP and l-Glu to the enzyme–tRNA complex. Mt-GluRS, which is
predicted by genome analysis to be of the non-discriminating type, was not
toxic when overproduced in E. coli cells indicating that it does not catalyse
the mischarging of E. coli tRNA
Gln
with l-Glu and that GluRS ⁄ tRNA
Gln
recognition is species specific. Mt-GluRS was significantly more sensitive
than the E. coli form to tryptic and chymotryptic limited proteolysis. For
both enzymes chymotrypsin-sensitive sites were found in the predicted
tRNA stem contact domain next to the ATP binding site. Mt-GluRS, but
not Ec-GluRS, was fully protected from proteolysis by ATP and glutamol-
AMP. Small-angle X-ray scattering showed that, at variance with the
E. coli enzyme that is strictly monomeric, the Mt-GluRS monomer is pres-
ent in solution in equilibrium with the homodimer. The monomer prevails
at low protein concentrations and is stabilized by ATP but not by gluta-
mol-AMP. Inspection of small-angle X-ray scattering-based models of
Mt-GluRS reveals that both the monomer and the dimer are catalytically
Abbreviations
aaRS, aminoacyl–tRNA synthetases; ALA, d-amino levulinic acid; ALAS, d-amino levulinic acid synthase; ArgRS, arginyl–tRNA synthetase;
Bs-GluRS, Bacillus subtilis glutamyl–tRNA synthetase; D-GluRS, discriminating glutamyl–tRNA synthetase; DLS, dynamic light scattering;
E, total enzyme concentration; Ec-GluRS, Escherichia coli glutamyl–tRNA synthetase; GlnRS, glutaminyl–tRNA synthetase; GluRS, glutamyl–
tRNA synthetase; GluTR, glutamyl–tRNA reductase; GluTR-His, GluTR carrying a C-terminal His
6
-tag; GoA, glutamol-AMP; GSA, glutamate
1-semialdehyde; GSA-AM, GSA aminomutase; His
6
-GluRS, GluRS carrying a N-terminal His
6
-tag; IPTG, isopropyl thio-b-D-galactoside; LysRS,
lysyl–tRNA synthetase; Mt-GluRS, M. tuberculosis GluRS; ND-GluRS, nondiscriminating GluRS; PP
i,
pyrophosphate; SAXS, small angle X-ray
scattering; Te-GluRS, Thermosynechococcus elongatus GluRS; Tt-GluRS, Thermus thermophilus GluRS; b-ME, 2-mercaptoethanol.
1398 FEBS Journal 276 (2009) 1398–1417 ª 2009 The Authors Journal compilation ª 2009 FEBS
Mycobacterium tuberculosis infects over two-thirds of
the world population and causes 1.6 million deaths
every year, according to World Health Organization
estimates [1]. The intrinsic resistance of M. tuberculo-
sis to most antibiotics and the spread of multidrug-
resistant strains prompted the study of M. tuberculosis
metabolism and the identification of novel anti-
tubercular drug targets through the in vitro character-
ization of essential enzymes. With this goal in mind
we focused on the production and characterization
of M. tuberculosis glutamyl–tRNA synthetase (Mt-
GluRS).
Glutamyl–tRNA synthetases (GluRS) belong to the
broad class of aminoacyl–tRNA synthetases (aaRS),
which catalyse the essential charging reaction of tRNA
with the cognate amino acid ensuring correct transla-
tion of the mRNA into the corresponding polypeptide
[2]. The ubiquity and essentiality of aaRS makes them
of interest as targets of new anti-infectives [3]. Their
reaction formally consists of the activation of the
amino acid by adenylation (Eqn 1) followed by transfer
of the amino acyl residue to the 2¢-OH or 3¢-OH posi-
tion of the 3¢-OH end of the cognate tRNA (Eqn 2).
amino acid þ ATP $ aminoacyl-AMP + pyrophosphate
ð1Þ
amino acyl-AMP + tRNA
aa
$ AMP + aminoacyl tRNA
aa
ð2Þ
Most aaRS catalyse the formation of the aminoacyl-
AMP intermediate in the absence of tRNA. However,
GluRS, glutaminyl–tRNA synthetase (GlnRS), argi-
nyl–tRNA synthetase (ArgRS) and class I lysyl–tRNA
synthetase (LysRS) are exceptions in that activation of
the amino acid requires the presence of the cognate
tRNA [2,4]. In these aaRS the binding of tRNA
induces an ATP productive binding mode [5]. GluRS
are also distinguished on the basis of their ability to
discriminate between tRNA
Glu
and tRNA
Gln
.
The dis-
criminating GluRS (D-GluRS) only catalyses the
charging reaction of tRNA
Glu
with l-Glu yielding
Glu–tRNA
Glu
. However, the nondiscriminating GluRS
(ND-GluRS) also charges the tRNA
Gln
forming a mis-
acylated Glu–tRNA
Gln
. The organisms containing the
ND-GluRS also contain a specific Glu–tRNA
Gln
amidotransferase that converts the glutamyl moiety
into a glutaminyl residue correcting the misacylation
and providing the Gln–tRNA
Gln
needed for protein
synthesis [2,6,7]. In these cells, the GlnRS is missing.
Furthermore, in most bacteria and plants GluRS also
plays a role in tetrapyrrole biosynthesis, which requires
GluRS (Eqn 3), Glu–tRNA reductase (GluTR; Eqn 4)
and glutamate 1-semialdehyde aminomutase (GSA-
AM; Eqn 5) for synthesis of d-aminolevulinic acid
(ALA), the first common precursor of all tetrapyrroles
[8,9]. This C5 pathway of tetrapyrrole biosynthesis dif-
fers from that of most eukaryotes and other bacteria,
which uses succinyl-CoA, glycine and ALA synthase
(ALAS; Eqn 6), the so-called C4 pathway of tetrapyr-
role biosynthesis.
L-Glu + ATP + tRNA
Glu
$ Glu tRNA
Glu
ð3Þ
Glu tRNA
Glu
+ NADPH + H
þ
$ GSA + NADP
þ
ð4Þ
GSA $ ALA ð5Þ
succinyl-CoA + glycine $ ALA + CoA ð6Þ
How the flux of Glu–tRNA
Glu
is directed toward
protein or tetrapyrrole biosynthesis has not been fully
clarified. Most likely, different mechanisms operate in
different organisms. In general, the low levels of
GluTR, catalysing the rate-limiting step of ALA
biosynthesis, may be sufficient to ensure ALA supply
without interfering with protein synthesis [9].
However, GluTR may distinguish between different
Glu–tRNA
Glu
isoforms [10]. As an alternative,
complex formation between GluRS and GluTR, as a
function of the cell requests, may divert Glu–tRNA
Glu
toward tetrapyrrole biosynthesis [11]. Finally, GluRS
isoforms differing in tRNA
Glu
specificity [10] or, in
principle, in their ability to interact with GluTR may
be expressed.
Only the structures of GluRS from thermophilic
bacteria have been solved. The Thermus thermophilus
enzyme (Tt-GluRS) is the structural model for
D-GluRS [5,12–14], and the Thermosynechococcus
elongatus form (Te-GluRS) is the structural model for
the ND-GluRS class [15]. Thus, details of the struc-
ture, flexibility, oligomeric state and conformational
states of a mesophilic enzyme are not known, limiting
to some extent thorough understanding of the
active. By using affinity chromatography and His
6
-tagged forms of either
GluRS or glutamyl–tRNA reductase as the bait it was shown that the
M. tuberculosis proteins can form a complex, which may control the flux of
Glu–tRNA
Glu
toward protein or tetrapyrrole biosynthesis.
S. Paravisi et al. M. tuberculosis glutamyl–tRNA synthetase
FEBS Journal 276 (2009) 1398–1417 ª 2009 The Authors Journal compilation ª 2009 FEBS 1399
structure–function relationship in this enzyme with
consequences for the rational design of specific
inhibitors.
Analysis of the M. tuberculosis genome sequence led
to the identification of one ORF encoding a putative
GluRS (Rv2992c, 1473 bp). Upstream of Rv2992c the
sequences of one tRNA
Glu
(gluU) and one tRNA
Gln
(glnU) gene are found. Additional tRNA
Glu
(gluT) and
tRNA
Gln
(glnT) genes have been annotated, but they
are in chromosome regions far from the putative
GluRS gene and the tetrapyrrole biosynthetic genes
(see below). No ORF encoding a putative GlnRS was
found, but three ORFs (Rv3011c, Rv3009c and
Rv3012c) predict the presence of the three subunits of
the Glu–tRNA
Gln
amidotransferase. These observa-
tions suggest that the Mt-GluRS is of the nondiscrimi-
nating type.
Finally, genes encoding the putative GluTR (hemA,
Rv0509), GSA-AM (hemL, Rv0524) and other
enzymes of the tetrapyrrole biosynthetic pathway have
been annotated in the M. tuberculosis genome. No
ORF encoding proteins similar to ALAS have been
found. Thus, Mt-GluRS is predicted to provide Glu–
tRNA
Glu
for both protein and tetrapyrrole biosynthe-
sis, the latter occurring via the C5 pathway.
Furthermore, the genome-wide gene inactivation
experiments of Sassetti et al. [16] indicate that the
putative GluRS, as well as glutamyl–tRNA
Gln
amido-
transferase and the enzymes of the C5 pathway of
ALA biosynthesis are essential for M. tuberculosis.
For these reasons, with the dual goal of contributing
to understanding of the metabolism of this pathogen
and providing the enzyme for the identification and
development of selective inhibitors, we cloned and
expressed Rv2992c in E. coli. With the purified pro-
tein we carried out a kinetic, mechanistic and struc-
tural characterization of the resulting Mt-GluRS.
Rv0509, encoding the putative M. tuberculosis GluTR
(Mt-GluTR) was also cloned in vectors for protein
production in E. coli in order to ask questions
about GluRS–GluTR complex formation for the
mycobacterial proteins.
Results
Expression of Rv2992c in E. coli BL21(DE3) and
purification of the putative Mt-GluRS
The predicted ORF Rv2992c was cloned in pET-based
vectors for production of the corresponding protein
product in E. coli BL21(DE3). The pETGTS1 plasmid
coded for a 490-residue protein (53 831 Da), which
was produced at high levels and in a soluble form in
E. coli (Fig. S1A). Similar results were obtained with
cells transformed with pETGTS2, which encodes a
fusion between an N-terminal His
6
tag and the
Rv2992c coding region (510 residues and a predicted
mass of 55 876 Da; Fig. S1B).
Up to 100 mg of homogeneous protein, as judged
by SDS ⁄ PAGE (Fig. S1A), were obtained from 20 g of
E. coli BL21 (DE3) cells harboring pETGTS1. The
His
6
-tagged variant of the putative GluRS (His
6
–
GluRS) could be purified to homogeneity (Fig. S1B)
using a single nitrilotriacetic acid–Sepharose column
( 10 mgÆg
)1
of cells). Both protein species could be
concentrated to up to 40 mgÆmL
)1
without observable
precipitation. They were stable for up to 2 years when
stored at ) 20 °C in 50% glycerol, as judged by
SDS ⁄ PAGE, determination of the protein concentra-
tion after centrifugation, activity (see below) and
dynamic light scattering (DLS) measurements. Glyc-
erol removal by either dialysis or gel filtration led to
soluble protein that maintained activity for up to
1 week when stored at 4 °C. Freezing samples from
which glycerol had been removed caused the aggrega-
tion of a small fraction (< 5%) of the protein, as
determined by DLS without, however, causing detect-
able activity loss. N-Terminal sequencing and mass
determination by MALDI-TOF confirmed the identity
of the proteins and that the N-terminal Met residue
had been correctly removed by post-translational
processing.
Identification of Rv2992c as the Mt-GluRS and
steady-state kinetic characterization
Formation of Glu–tRNA
Glu
was monitored by mea-
suring the increase in acid-precipitable radioactivity
upon incubation of the enzyme with E. coli tRNA
Glu
,
l-[U
14
C]Glu, ATP, MgCl
2
at pH 7.3. The increase in
l-[U
14
C]Glu–tRNA
Glu
concentration was linear for up
to 10 min when 0.2–1.85 pmol Mt-GluRS was used in
the reactions (Fig. S2). Under these conditions the
enzyme had an apparent turnover number of 17.7 ±
0.3 min
)1
at 0.5 mml-Glu and 32.0 ± 1.2 min
)1
at
2mml-Glu. Similar activity was measured with the
homogeneous His
6
-GluRS form (Fig. S2). These values
are lower than that of 100 min
)1
calculated from
the specific activity reported for the E. coli enzyme by
Lin et al. [17].
The activity was found to increase hyperbolically
with MgCl
2
concentrations up to 5 mm. At concentra-
tions > 10 mm the activity decreased. Thus, in all
assays MgCl
2
concentration was held constant at
10 mm, well above ATP concentrations (or its analogs,
see below), but below the onset of inhibition.
M. tuberculosis glutamyl–tRNA synthetase S. Paravisi et al.
1400 FEBS Journal 276 (2009) 1398–1417 ª 2009 The Authors Journal compilation ª 2009 FEBS
Determination of the apparent k
cat
and K
M
for
ATP, l-Glu (K
l-Glu
) and tRNA
Glu
was carried out at
37 °C under conditions detailed in Materials and meth-
ods and in the legend to Table 1. The quality of data
is shown in Fig. S3. K
M
values for ATP and tRNA are
of the same order of magnitude as those reported for
E. coli glutamyl–tRNA synthetase (Ec-GluRS) [18],
which we here use as the reference GluRS. The K
l-Glu
value is very high so that it remains poorly defined
and it may be ‡ 2–3 mm, i.e. at least 20-fold higher
than the corresponding value reported for Ec-GluRS.
The k
cat
extrapolated at infinite l-Glu concentration
at saturating concentrations of the other substrates
(129 ± 28 min
)1
), within the limits imposed by the
high value of the K
L-Glu
that prevents an accurate
estimate of this parameter, is now of the same order
of magnitude of that reported for Ec-GluRS
( 100 min
)1
) [17].
The high K
l-Glu
value of Mt-GluRS, compared with
Ec-GluRS, did not depend on the pH at which the
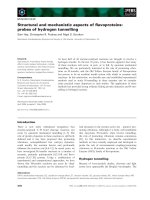
activity assays were carried out. Indeed, k
cat
and K
l-Glu
values were determined between pH 6.5 and 8.5 in the
presence of fixed concentrations of the other substrates
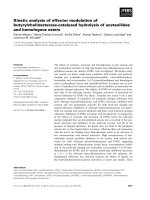
(Fig. 1). k
cat
values were found to increase as a group
with an apparent pK
a
< 7 dissociated to reach a con-
stant value above pH 7.3. The k
cat
⁄ K
l-Glu
profile
instead showed a plateau at pH values between 6.5
and 7.5 and decreased at high pH as a group with a
pK
a
value > 8 deprotonated.
Because of the high cost of l-[U
14
C]Glu and the
need to maintain the ionic strength of the assay rela-
tively low, enzyme activity was routinely measured in
the presence of 0.5 or 2 mml-Glu.
Alternate substrates and inhibitors of Mt-GluRS
Several analogs of the enzyme substrates were tested
as alternate substrates or inhibitors of Mt-GluRS
(Tables S1 and S2). Mt-GluRS was found to be very
specific for the amino acid substrate. l-Gln (2–5 mm)
and 2-oxoglutarate (1–5 mm) did not inhibit the reac-
tion (Table S1). Furthermore, l-Gln could not effi-
ciently substitute for l-Glu as the substrate. Indeed, in
the presence of 2 mml-Gln the apparent turnover
number was 0.03 min
)1
, i.e. 0.1% of that measured in
the presence of 2 mml-Glu (Table S1). Mt-GluRS is
Table 1. Steady-state kinetic parameters of the Mt-GluRS reaction. The k
cat
and K
M
values for ATP, L-Glu and E. coli tRNA
Glu
were deter-
mined for the aminoacylation reaction catalysed by Mt-GluRS (6.3 n
M)at37°C in the presence of 35 mM Hepes ⁄ NaOH buffer, pH 7.3,
25 m
M KCl, 10% glycerol, 2 mM dithiothreitol, 10 mM MgCl
2
and 0.1% BSA and the indicated concentrations or concentration ranges of the
enzyme substrates. For comparison, published K
M
values for ATP, L-Glu and tRNA
Glu
for the E. coli enzyme are shown [18].
ATP (m
M) L-Glu (mM) tRNA
Glu
(lM) k
cat
(min
)1
) K
M
Mt-GluRS 0.01–2.0 0.5 3.6 16.3 ± 0.4 0.08 ± 0.01 mM
1.0 0.03–2.0 3.6 129.0 ± 28.0 2.7 ± 0.8 mM
1.0 0.5 0.45–4.0 24.5 ± 1.5 0.7 ± 0.2 lM
Ec-GluRS Varied 0.25 mM
Varied 0.10 mM
Varied 0.16 lM
1000
10
100
k
cat
1
10
0.1
100
10
6789
k
cat
/K
L-Glu
1
pH
6789
Fig. 1. pH dependence of the steady-state kinetic parameters k
cat
and k
cat
⁄ K
L-
Glu
of Mt-GluRS. The apparent k
cat
(in min
)1
) and k
cat
⁄ K
L-
Glu
(in min
)1
ÆmM
)1
) values of the reaction catalysed by Mt-GluRS
(6.3 n
M) were determined at 37 °Cin35mM Hepes ⁄ NaOH buffer
at the indicated pH values in the presence of 1 m
M ATP, 3.6 lM
tRNA
Glu
,10mM MgCl
2
,25mM KCl, 2 mM dithiothreitol, 10% glyc-
erol 0.1% BSA and varying
L-[U
14
C]Glu. k
cat
values were fitted to
Eqn (13), assuming that k
cat
increases to a limiting value of
110 ± 1.0 min
)1
at high pH as a single group with pK
a
of
6.2 ± 0.03 deprotonates. k
cat
⁄ K
L-
Glu
values fitted well fitted with
Eqn (14) assuming that the parameter decreases from a limiting
value of 70 ± 5.0 min
)1
ÆmM
)1
as a group with a pK
a
value of
8.7 ± 0.23 deprotonates.
S. Paravisi et al. M. tuberculosis glutamyl–tRNA synthetase
FEBS Journal 276 (2009) 1398–1417 ª 2009 The Authors Journal compilation ª 2009 FEBS 1401
also highly specific for the nucleotide substrate. ATP
could not be substituted as the substrate by b,c-methyl-
ene-ATP, despite the presence of the hydrolysable
a,b-phoshoanhydride bond. a,b -Methylene-ATP and
b,c-methylene-ATP were not inhibitors of the reaction
(Table S2) nor were AMP and its analog decoyinine
[19]. For comparison a,b-methylene-ATP was found to
be an inhibitor of Ec-GluRS, competitive with ATP
(K
i
0.45 mm) [20]. With Ec- GluRS AMP was a non-
competitive inhibitor with respect to ATP and l-Glu
with K
i
values in the mm range, as deduced by the data
presented in Kern and Lapointe [20]. On the contrary,
the glutamyl-AMP analog glutamol-AMP (GoA) [21]
and pyrophosphate (PP
i
) (but not a series of PP
i
ana-
logs) were potent inhibitors of Mt-GluRS (Table S2).
Several divalent cations were also tested as substitutes
for Mg
2+
or inhibitors. None could replace Mg
2+
in the
reaction, and they all acted as mild inhibitors
(Table S3).
The inhibitory effect of PP
i
and GoA was studied in
greater detail. PP
i
was found to be a noncompetitive
inhibitor with respect to both ATP and l-Glu with K
i
values in the 10–100 lm range (Table 2 and Fig. S4).
GoA was a competitive inhibitor with respect to both
l-Glu and ATP with K
i
values of 4 and 1.5 lm,
respectively. These values are similar to those reported
for the Ec- GluRS ( 3 lm with respect to both sub-
strates) [21]. GoA was instead uncompetitive with
respect to tRNA (K
i
4 lm).
Requirement of tRNA for the adenylation of l-Glu
in MtGluRS
GluRS, together with GlnRS, ArgRS and class I
LysRS, are the only aaRS that require bound tRNA
in order to form the aminoacyl-AMP intermediate
from ATP and the free amino acid [2,4]. To establish
the requirement of tRNA for the aminoacyl–adenyla-
tion reaction, Mt-GluRS was incubated with either
l-[
14
C]Glu or [
3
H]ATP under various conditions, and
the reaction components were identified and quantified
after chromatographic separation on a MonoQ column
(Fig. S5). Only in the presence of both tRNA and
l-Glu was the appearance of [
3
H]AMP observed. That
the radioactivity associated with the elution position of
AMP did not correspond to Glu-AMP was tested by
carrying out the same experiments in the presence of
l-[U
14
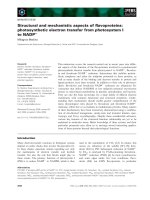
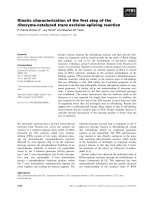
C]Glu (not shown). The kinetics of [
3
H]AMP
formation were also determined (Fig. 2). The amount
of [
3
H]AMP formed at early incubation times matched
well with that of l-[U
14
C]Glu–tRNA
Glu
formed in par-
allel filter-binding assays. At later reaction times the
amount of AMP formed exceeded that of Glu–tRNA,
presumably due to recycling of tRNA derived from
Table 2. Inhibition of Mt-GluRS by glutamol-AMP and pyrophos-
phate. Activity assays were carried out at 37 °Cin35m
M
Hepes ⁄ NaOH, pH 7.3, in the presence of 2 mM dithiothreitol, 10%
glycerol, 0.1% BSA, 10 m
M MgCl
2
,25mM KCl, Mt-GluRS (6.3 nM
in the 150 lL assay mixture). When the substrate concentrations
were held constant they were: 1 m
M ATP, 0.5 mML-Glu and 3.6 lM
tRNA. The inhibition pattern was established throught the best fit
of the data to Eqns (10–12) describing competitive (C), noncompeti-
tive (NC) and uncompetitive (UC) inhibition, respectively.
Inhibitor
Varied
substrate Pattern K
is
(lM) K
ii
(lM)
Glutamol-AMP ATP C 1.5 ± 0.4
L-Glu C 3.9 ± 1.0
tRNA UC 3.9 ± 0.7
Pyrophosphate ATP NC 31.4 ± 7.6 27 ± 15.4
L-Glu NC 12.5 ± 3.7 101 ± 54
4
2
[AMP], µ
M
; [Glu-tRNA] µ
M
0
Time (min)
0 5 10 15
0
Fig. 2. Kinetics of [
3
H]AMP formation during Mt-GluRS reaction as
determined by chromatographic separation of the reaction com-
ponents. GluRS (0.67 l
M) was incubated at 37 °Cin35mM
Hepes ⁄ NaOH buffer, pH 7.3, 10% glycerol, 2 mM dithiothreitol,
1m
M [2,5¢,8
3
H]ATP (33 300 dpmÆnmol
)1
), 10 mM MgCl
2
,25mM
KCl, 2 mML-Glu and 3.6 lM tRNA
Glu
(s) in a final volume of 150 lL.
After 1–10 min, cold water was added (2 mL) and a 2 mL sample
was rapidly injected onto a MonoQ column equilibrated in 20 m
M tri-
ethanolamine ⁄ HCl buffer, pH 7.7, and developed by increasing the
KCl concentration in the same buffer. Fractions (1 mL) were col-
lected and the radioactivity was measured by scintillation counting.
The concentration of [
3
H]AMP formed in the assays at any given
time was calculated from the amount of radioactivity present in the
AMP elution peak (Fig. S5). In separate experiments the time-
course of [
3
H]AMP formation in assays lacking L-Glu (d)orL-Glu and
tRNA
Glu
(h) was also measured. The kinetics of Glu–tRNA
Glu
forma-
tion (
) determined using the filter-binding assay in the presence of
L-[U
14
C]Glu and unlabelled ATP under identical conditions is shown
for comparison. Note that at long incubation times, the amount of
AMP formed exceeds that of Glu–tRNA due to recycling of tRNA
because of the spontaneous hydrolysis of Glu–tRNA.
M. tuberculosis glutamyl–tRNA synthetase S. Paravisi et al.
1402 FEBS Journal 276 (2009) 1398–1417 ª 2009 The Authors Journal compilation ª 2009 FEBS
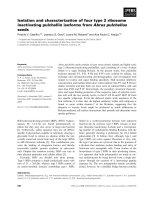
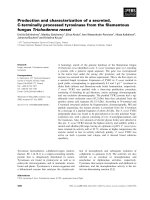
spontaneous hydrolysis of Glu–tRNA [22]. These
results were confirmed by separating the reaction com-
ponents using TLC (Fig. 3A). In these experiments, we
also observed ADP formation (Fig. 3B,C) at a rate
that was dependent on the enzyme concentration, but
independent of the presence of l-Glu and tRNA. This
ATP hydrolysing activity is very low (0.135 min
)1
when calculated from the kinetics of ADP formation
in the absence of tRNA with 0.8 lm Mt-GluRS)
(Fig. 3B) and it is unlikely to represent a physiologi-
cally relevant side reaction.
PP
i
⁄ ATP exchange reaction of Mt-GluRS
Evidence for the presence of the Glu-AMP intermedi-
ate in GluRS and in other aaRS has been obtained
by studying the [
32
P]PP
i
⁄ ATP exchange reaction
[2,4,23,24]. Thus, Mt-GluRS was incubated under vari-
ous conditions with [
32
P]PP
i
and the reaction compo-
nents were separated by TLC. [
32
P] associated with the
various compounds was quantified using a phosphoim-
ager (Fig. S6). No radioactive species other than PP
i
and minor amounts of P
i
were observed when the
enzyme was incubated in solutions lacking one of the
enzyme substrates. When all three substrates were
present, only formation of [
32
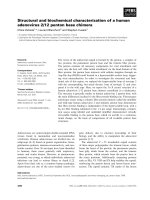
P]ATP was observed. In
kinetic experiments, the rate of formation of [
32
P]ATP
increased at increasing concentrations of [
32
P]PP
i
(Fig. 4). As expected from the observed inhibitory
effect of PP
i
on the tRNA charging reaction, the velo-
city of [
32
P]ATP formation was inversely proportional
to that of l-[U
14
C]Glu–tRNA production in parallel
filter-binding assays (not shown). The k
cat
of [
32
P]ATP
formation was 1100 ± 174 min
)1
. This value should
be compared with that calculated for the tRNA
Glu
charging reaction under similar conditions (90 min
)1
).
Is Mt-GluRS a discriminating or a
non-discriminating GluRS?
According to analyses of the M. tuberculosis genome,
Mt-GluRS is predicted to be of the nondiscriminating
type (see above for details). Attempts to produce
M. tuberculosis tRNA
Glu
and tRNA
Gln
(in vivo or
15
20
25
A
AMP (µ
M
)ADP (µ
M
)ADP (µ
M
)
0
5
10
–5
B
15
20
25
0
5
10
15
20
25
C
–5
0
5
10
Time (min)
0 60 120 180
–5
Fig. 3. Kinetics of [
3
H]AMP and [
3
H]ADP formation from ATP.
Assays were set up in 35 m
M Hepes ⁄ NaOH buffer, pH 7.3, 10%
glycerol, 2 m
M dithiothreitol, 1 mM [2,5¢,8
3
H]ATP (33 300 dpmÆ-
nmol
)1
), 10 mM MgCl
2
,25mM KCl, 2 mML-Glu, 0.004% BSA and
3.6 l
M tRNA
Glu
in a final volume of 150 lL and incubated at 37 °C
in the presence of different Mt-GluRS concentrations [6.7 n
M (cir-
cles), 76.3 n
M (squares) and 822 nM (triangles)]. At different times,
10 lL aliquots were rapidly applied onto poly(ethyleneimine)–cellu-
lose sheets, subjected to TLC and quantification of radiolabelled
ADP and AMP. The kinetics of [
3
H]AMP and [
3
H]ADP formation in
the absence of tRNA
Glu
(black symbols) or of both L-Glu and
tRNA
Glu
(grey symbols) were also determined in parallel samples.
(A) Time-course of AMP formation in the complete assay mixture
at the three different enzyme concentrations (open symbols). In
the absence of tRNA
Glu
no AMP formation above background was
detected (closed symbols). Similar results were obtained in the
absence of both tRNA
Glu
and L-Glu (not shown). Note that the reac-
tion velocity is independent of the Mt-GluRS concentration because
the formation of AMP is monitored at long incubation times and
with high Mt-GluRS concentrations when recharging of tRNA
derived from hydrolysis of Glu–tRNA
Glu
is being observed. (B, C) At
increasing Mt-GluRS concentrations, formation of ADP from ATP
could be detected at rates that were essentially independent from
the presence of the enzyme substrates. The time-course of ADP
formation in the complete assay mixture (not shown) was similar
to that obtained in the absence of tRNA
Glu
(B).
S. Paravisi et al. M. tuberculosis glutamyl–tRNA synthetase
FEBS Journal 276 (2009) 1398–1417 ª 2009 The Authors Journal compilation ª 2009 FEBS 1403
in vitro) in quantities sufficient to carry out kinetic
assays have not been successful, yet. Thus, in order to
study the discriminating or nondiscriminating nature
of Mt-GluRS we used the toxicity test developed by
Baick et al. [25]. Overproduction of the nondiscrimi-
nating Bacillus subtilis GluRS (Bs-GluRS) in E. coli
cells, which lack the Glu–tRNA
Gln
amidotransferase,
was found to be toxic. Supplementing the medium
with l-Gln protected the cells, presumably by allowing
the endogenous GlnRS to saturate the tRNA
Gln
with
l-Gln, thus avoiding the misacylation reaction. Diluted
cultures of E. coli BL21(DE3) cells containing pET-
GTS1 were plated on Luria–Bertani or M9 medium
(to measure the cells vitality) or medium containing
ampicillin (to count cells containing the plasmid) in
the absence or presence of isopropyl thio-b-d-galacto-
side (IPTG) (to establish the toxicity of the over-
production of Mt-GluRS). The effects of l-Gln
(2.5–25 mm, to relieve toxicity) and of l-Glu (2.5–
25 mm, to enhance the hypothesized misacylation reac-
tion of tRNA
Gln
) were also tested. In none of the
conditions (Table S4) was pETGTS1 toxic, nor was
the induction of the gene expression. This agrees well
with the fact that large amounts of soluble Mt-GluRS
were produced in E. coli BL21(DE3) cells for protein
production in both Luria–Bertani (Fig. S1) and M9
medium (not shown).
Structural studies on Mt-GluRS in solution
Several unsuccessful attempts were made to obtain
crystals of the protein for X-ray diffraction studies.
With the aim of gathering structural information (i.e.
oligomeric structure, conformational flexibility, effect
of ligands) we carried out limited proteolysis and
small-angle X-ray scattering (SAXS) measurements on
Mt-GluRS, using the Ec-GluRS species as a reference
protein and the available high-resolution structures of
Tt-GluRS [5,12,13] and Te-GluRS [15] as models.
Both Mt- and Ec-GluRS were found to be more sen-
sitive to trypsin than to chymotrypsin, with Mt-GluRS
being significantly more sensitive than Ec-GluRS to
the given protease. Incubation of Mt-GluRS with
chymotrypsin 0.1% (w ⁄ w) led to the formation of a
limited number of protein fragments with five main
species (bands M1-M5 of Fig. 5), of which M2
(27.5 kDa), M4 (18.4 kDa) and M5 ( 9 kDa) were
stable to further proteolytic attack. From the N-termi-
nal sequence and the mass of the fragments, and from
the kinetics of the process (Figs S7–S9 and Table S5)
we concluded that the main sites of proteolytic cleav-
age are at the C-terminus of the predicted catalytic
domain and in the stem-contact domain [5,12,13,15].
By projecting these cleavage sites on the Tt-GluRS
structures available, they are found to be close to the
ATP-binding site (not shown). Accordingly, GoA
(Fig. 5) and ATP (not shown) fully protected Mt-
GluRS from chymotryptic degradation. Interestingly,
MgCl
2
was not required for the binding of these nucle-
otides to GluRS. Ec- GluRS was less sensitive than
Mt-GluRS to chymotrypsin and a limited number of
fragments could be observed using 1% chymotrypsin
(Fig. 5). Analysis of the proteolytic fragments
(Figs S7–S9 and Table S5) indicated that the main
proteolytic site in Ec-GluRS is S238. From sequence
comparisons (Fig. S7), this residue is in the ‘KMSK’
fingerprint of GluRS, which identifies the ATP-binding
site [2]. At variance with the Mt-GluRS, GoA and
ATP had no effect on the proteolytic pattern observed
with Ec-GluRS. l-Glu did not have an effect on prote-
olysis with any of the enzymes.
In order to extract structural information, although
at a low resolution, protein samples were analysed by
SAXS. DLS provided an important set of information
preliminary to the SAXS experiments, allowing us to
establish working conditions and revealing that
Ec- and Mt-GluRS likely differed for their aggregation
state (Fig. S10 and accompanying text for details).
2
800
A
1
2
B
400
800
ATP (nmol)
0246
0
0
[
32
P]A
v/E (min
–1
)
Time (min)
0246
[PPi] (mM)
0.0 0.5 1.0
Fig. 4. Kinetic parameters of PP
i
⁄ ATP exchange reaction. The
time-course of the incorporation of [
32
P]PP
i
into ATP was deter-
mined as a function of PP
i
concentration (empty circle, 0.01 mM;
full circle, 0.1 mM; empty square, 0.5 mM; full square, 1.0 mM)in
100 m
M Hepes ⁄ NaOH buffer, pH 7.2, containing 0.3% glycerol,
2m
M ATP, 16 mM MgCl
2
,6mML-Glu, 25 mM KCl, 0.01–1 mM
Na-[
32
P]PP
i
(231 113 dpmÆnmol
)1
), 3.6 lM tRNA
Glu
and Mt-GluRS
(7.4 n
M) in a final volume of 50 lL, at 37 °C. Aliquots (1 lL) of the
reaction mixtures were withdrawn before and at different times
after tRNA addition. They were rapidly applied onto the poly(ethyl-
eneimine)–cellulose sheets, which were developed immediately.
After quantitation of [
32
P]ATP formed at the different times (left),
calculation of the initial reaction velocity and correction for the
amount of enzyme present, the rates of [
32
P]ATP formation at the
different PP
i
concentrations were fitted to the Michaelis–Menten
equation to calculate the apparent k
cat
(1101 ± 174 min
)1
) and K
M
for PP
i
(0.4 ± 0.17 mM) of the reaction (right). For comparison, the
velocity of Glu–tRNA formation under similar substrate concentra-
tions was calculated to be 89 min
)1
.
M. tuberculosis glutamyl–tRNA synthetase S. Paravisi et al.
1404 FEBS Journal 276 (2009) 1398–1417 ª 2009 The Authors Journal compilation ª 2009 FEBS
Ec-GluRS solutions (0.5–11 mgÆmL
)1
) yielded scatter-
ing patterns consistent with the presence of one species
in solution. The scattering curves computed from the
atomic coordinates of the Tt-orTe-GluRS monomers
by program crysol [26] yielded reasonable fits to the
experimental patterns (Table S6 and Fig. 6A, curve 1).
Mt-GluRS yielded more complex SAXS patterns
(Fig. 6A, curves 2–16). The calculated radius of gyra-
tion (R
g
) and molecular mass (MM) increased at
increasing protein concentration (Table S6), indicating
the presence of multiple species in solution. At protein
concentrations > 4 mgÆmL
)1
the calculated R
g
stabi-
lized at 3.8 nm suggesting the presence of a dimeric
species (Table S6 and Fig. 6A, curves 2 and 3).
Te-GluRS is a dimer in the crystal form [15], as
opposed to Tt-GluRS [5,12–14]. However, a poor fit to
the data was obtained by assuming for Mt-GluRS a
structure similar to that of the Te-GluRS dimer, even
taking into account a monomer–dimer equilibrium.
Therefore, a model Mt-GluRS dimer was built on the
basis of the structure of the Tt-GluRS subunit
extracted from that of the Tt-GluRS ⁄ tRNA complex
(PDB code 1g59). The scattering curve of the symmetric
homodimer shown in Fig. 6B clearly yielded the best fits
to the SAXS data of Mt-GluRS at concentrations
>4mgÆ mL
)1
. Based on this dimeric model of
Mt-GluRS, and using the program oligomer [27], it
was possible to quantify the relative distribution of
Mt-GluRS monomers and dimers at various protein
concentrations, confirming the concentration depen-
dence of the monomer–dimer equilibrium of Mt-GluRS
solutions (Fig. 6A, curves 2–6 and Table S6). The pres-
ence of l-Glu or GoA had no effect on the scattering
curves of Mt-GluRS solutions (not shown), whereas
ATP, either alone or in the presence of l-Glu, shifted
the equilibrium towards the monomer, without causing
full conversion (Fig. 6A, curves 7–10 and Table S6). By
contrast, MgCl
2
appears to stabilize the dimer (Fig. 6A,
Fig. 5. SDS ⁄ PAGE analysis of E. coli (upper) and M. tuberculosis GluRS (lower) limited proteolysis products. The enzymes (1 mgÆmL
)1
)
were incubated with 1% (Ec-GluRS) or 0.1% (Mt-GluRS) (w ⁄ w) N
a
-tosyl-L-lysyl chloromethyl ketone-treated chymotrypsin in 50 mM
Hepes ⁄ NaOH buffer, pH 8.0, in the absence or presence of 0.5 mM GoA at 25 °C in a final volume of 100–200 lL. At different incuba-
tion times, aliquots (10 lL) were analysed by SDS ⁄ PAGE after chymotrypsin inactivation. The mass of the peptides was calculated by
comparison with a calibration curve built with the 14–202 kDa molecular mass protein standard mix (*). E1 (45.3 kDa), E2 (30.3 kDa) and
E3 (26.6 kDa) are the main proteolysis products obtained with Ec-GluRS (54.0 kDa). From N-terminal sequencing E2 corresponds to the
N-terminal fragment of Ec-GluRS and E3 starts at position 238. M1 (28.9 kDa), M2 (27.5 kDa), M3 (23.4 kDa) and M4 (18.4 kDa) derive
from Mt-GluRS (54.3 kDa). The N-terminal sequences of M1 and M2 corresponds to the N-terminus of intact Mt-GluRS. M4 starts at
position 319.
S. Paravisi et al. M. tuberculosis glutamyl–tRNA synthetase
FEBS Journal 276 (2009) 1398–1417 ª 2009 The Authors Journal compilation ª 2009 FEBS 1405
curves 11–14 and Table S6) and reduces dissociation
into monomers when ATP is added (Fig. 6A, curves
15–16 and Table S6).
Interaction between M. tuberculosis GluRS and
GluTR
In those bacteria and plants that use the C5 pathway
for ALA biosynthesis it has been proposed that GluRS
and GluTR may form a complex in order to commit
Glu–tRNA
Glu
to tetrapyrrole biosynthesis. Complex
formation between GluRS and GluTR has been shown
with purified Chlamydomonas reinhardtii enzymes [11].
We tested complex formation between the M. tubercu-
losis enzymes by using affinity chromatography.
Although homogeneous preparations of Mt-GluRS
can be obtained as described above, all attempts to
produce large amounts of the putative Mt-GluTR
(Rv0509) in a soluble form in E. coli or M. smegmatis
cells were unsuccessful (not shown). However, clon-
ing of Rv0509 in pET11a or in pET23b (to generate
a C-terminally His
6
-tagged version of Mt-GluTR,
Mt-GluTR–His) led to the production of a small
amount of soluble protein, which could be increased
by co-producing the E. coli chaperon proteins DnaJ,
DnaK and GrpE from plasmid p20 [28]. The identity
of Rv0509 with the Mt-GluRS was established indi-
rectly. E. coli cells overexpressing Rv0509 were red due
to the accumulation of heme, which was in part
released in the culture medium, as established from the
A
B
Fig. 6. SAXS analysis of GluRS oligomeriza-
tion in solution. (A) Scattering profiles of (1)
Ec-GluRS (the pattern merged from different
concentrations, no oligomerization effect
observed); (2–6) Mt-GluRS with no MgCl
2
and no ATP for concentrations (mg.mL
)1
)
c = 6.25, 4.16, 3.7, 1.8 and 0.9 (from top to
bottom); (7–10) Mt-GluRS with ATP (1 m
M)
and no MgCl
2
at c = 7.85, 4.16, 1.63 and
0.86; (11–14) Mt-GluRS with MgCl
2
(0.2 mM) and no ATP, c = 4.4, 3.96, 3.75
and 3.56; (15,16) Mt-GluRS with MgCl
2
(0.2 mM) and ATP (1 mM)(c = 3.9 and 3.67).
Experimental data are denoted by black dots
and the fits from
OLIGOMER [27] (or CRYSOL
[26] for Ec-GluRS) are shown as red solid
lines. The curves are appropriately displaced
in logarithmic scale for better visualization.
(B) The dimer composed by two adjacent
monomers (shown in red and blue), which
yields the best fit to Mt-GluRS data at
concentrations > 4 mgÆmL
)1
in the absence
of ligands. The monomer structure was
extracted from the crystal structure of
Tt-GluRS in complex with tRNA (PDB ID
1g59).
M. tuberculosis glutamyl–tRNA synthetase S. Paravisi et al.
1406 FEBS Journal 276 (2009) 1398–1417 ª 2009 The Authors Journal compilation ª 2009 FEBS
absorbance spectra of crude extracts and culture
medium. Such a red phenotype is expected for the
overproduction of the enzyme catalysing the first and
rate-limiting step of tetrapyrrole biosynthesis [8].
Interestingly, the red phenotype was lost when the
C50S and C50A variants of Rv0509 were overpro-
duced (not shown). C50 of Rv0509 corresponds to the
catalytically essential C48 of Methanopyrus kandlerii
GluTR, which together with the E. coli form is the
best characterized GluTR [29–32]. Attempts to purify
Mt-GluTR led to the isolation of aggregates of
> 1 MDa. Therefore, the interaction between
M. tuberculosis GluRS and GluTR had to be studied
using purified Mt-GluRS and Mt-GluTR forms con-
tained in crude extracts of overproducing cells. Addi-
tion of His
6
–GluRS to a crude exctract of cells that
had produced Mt-GluTR followed by affinity chroma-
tography on Ni-nitriloacetate–Sepharose allowed us to
demonstrate formation of the GluRS-GluTR complex
(Fig. 7). Similar results were obtained by adding
homogenous GluRS to a crude extract of cells that
had produced Mt-GluTR–His (not shown). Interestingly,
all column fractions containing Mt-GluTR (Fig. 7) or its
His
6
-tagged variant (not shown), exhibited an absor-
bance spectrum consistent with the presence of a pro-
tein-bound heme cofactor (Fig. S11A). Furthermore,
the DLS signal of the fractions containing Mt-GluTR
(Fig. 7, top, boxed lane) showed a single, although
broad, peak (r = 5.2 nm) corresponding to a mass of
only 180 kDa (Fig. S11B). This finding suggests that
complex formation with GluRS and GluTR may
isolate and stabilize a soluble GluTR form.
Fig. 7. GluRS–GluTR interaction. (Upper) The crude extract obtained from the homogenization of E. coli BL21 (DE3, pGTR, p20) cells (2 g)
that contained the native Mt-GluTR, was incubated with Mt–His
6
GluRS (2 mg) for 30 min at 4 °C and 10 r.p.m. on a rotary shaker. Two milli-
tres of a 50% Ni-nitrilotriacetic acid-Sepharose suspension in 20 m
M Hepes ⁄ NaOH buffer, pH 8.0, 10% glycerol, 1 mM b-ME was added.
After 1 h the suspension was poured into a chromatographic column and the packed resin was extensively washed with the equilibration
buffer. The column was developed with a 0–100 m
M imidazole gradient in 10 mM steps followed by a final wash with 500 mM imidazole.
Aliquots of the collected fractions were denatured for SDS ⁄ PAGE. The gels were stained with Coomassie Brilliant Blue and destained. (Mid-
dle) The cell extract was substituted by a crude extract of E. coli BL21 (DE3, pET23b, p20) cells. (Lower) The His
6
–GluRS solution was
substituted by the same volume of buffer. In all gels the fractions eluted with 50–100 m
M imidazole showed no detectable proteins so that
the corresponding lanes are not shown. The column flow-through has also been omitted. The dots mark an E. coli protein that migrates just
below Mt-GluTR. In the upper gel, the white box highlights the fraction containing both GluRS and GluTR, whose spectrum and DLS signal
are shown in Fig. S11. The migration positions of GluTR and GluRS, were determined by comparison with those of a homogeneous sample
of GluRS (S) and of a sample enriched in GluTR (R) obtained by solubilizing inclusion bodies from overproducing cells. The band correspond-
ing to GluTR has also been identified by western blots and immunodecoration with anti-GluTR IgG. The star indicates the standard proteins,
with the corresponding mass shown on the side of the gels (in kDa).
S. Paravisi et al. M. tuberculosis glutamyl–tRNA synthetase
FEBS Journal 276 (2009) 1398–1417 ª 2009 The Authors Journal compilation ª 2009 FEBS 1407
Discussion
Rv2992c gene product was demonstrated to encode
Mt-GluRS, which is capable of charging E. coli
tRNA
Glu
with l-Glu. The enzyme can be obtained in
large quantities and in a soluble and stable form using
a four-step purification procedure based on previously
described methods [17,18,33].
Mt-GluRS exhibits properties similar, but not identi-
cal, to those of the well-characterized GluRS from
E. coli, which we used as the prototype of bacterial
GluRS. The turnover number is similar to that
reported for Ec-GluRS, as are the K
M
values for ATP
and tRNA
Glu
. However, K
L-Glu
was found to be 20-
fold higher for Mt-GluRS than for the E. coli enzyme.
Such a difference cannot be ascribed to a different pH
dependence of the reaction, but rather to a difference
between the enzymes.
Like other GluRS, the M. tuberculosis enzyme
requires bound tRNA
Glu
to carry out the formation
of the Glu-AMP intermediate indicating that for
Mt-GluRS also binding of tRNA might induce the
conformational change observed with Tt-GluRS that
switches the binding mode of ATP to a productive one
[5]. Mt-GluRS is similar to other GluRS in that it
catalyses the PP
i
⁄ ATP exchange reaction, indicating
that reaction steps linking the enzyme ⁄ tRNA ⁄
Glu ⁄ ATP complex to yield the enzyme ⁄ tRNA ⁄ Glu-
AMP complex are reversible. The k
cat
value measured
during the PP
i
⁄ ATP exchange reaction is 10-fold
higher than that measured for the tRNA aminoacyla-
tion reaction, indicating that transfer of l-Glu from
Glu-AMP to the tRNA is slower than pyrophosphor-
olysis of the intermediate to yield ATP and l-Glu. A
similar conclusion was reached for Ec-GluRS. How-
ever, for Ec-GluRS, it has been reported that the pH
dependence of the PP
i
⁄ ATP exchange reaction follows
an inverse profile with respect to that of the tRNA
charging activity, so that the ratio between the veloci-
ties of the exchange and charging reactions was 30
at pH 6.2, but only 1.5 at pH 7.4 and 0.3 at pH 8.6
[22,24]. Thus, our finding that the PP
i
⁄ ATP exchange
is 10-fold faster than tRNA charging at pH 7.2,
while supporting a similar reaction mechanism for the
two enzymes, suggests a different pH dependence for
the individual reactions steps, perhaps reflecting differ-
ences in the fine structure of their active sites.
Mt-GluRS was found to be very specific for the
amino acid and the nucleotide substrate. It could use
l-Gln instead of l-Glu to charge tRNA
Glu
only at a
very low rate. Neither l-Gln nor 2-oxoglutarate are
inhibitors. Despite the presence of the a-b hydrolysable
bond, b,c-methylene-ATP could not replace ATP as
the substrate. Furthermore, the a,b- and b,c-methylene
analogs of ATP tested, and AMP and its analog decoi-
nine did not inhibit Mt-GluRS. This is at variance
with Ec- GluRS which was inhibited by both a,b-meth-
ylene-ATP and AMP, although with K
i
values in the
mm range [20].
As for the E. coli enzyme, PP
i
, which binds to the
enzyme ⁄ tRNA ⁄ Glu-AMP intermediate, was found to
be a noncompetitive inhibitor with respect to both
l-Glu and ATP. GoA was competitive with respect to
both Glu and ATP, but uncompetitive with respect to
tRNA
Glu
, with K
i
values of the same order of magni-
tude as those reported for Ec-GluRS [21]. GoA is one
of the glutamyl-AMP analogs being developed as a
GluRS inhibitor, and it will be of interest to test them
on Mt-GluRS in future studies of potential novel anti-
tubercular drugs, which are the long-term aim of this
project [21,34,35].
The precise definition of the kinetic mechanism of
Mt-GluRS was outside the scope of this work, particu-
larly in light of the complexity of the reaction, as
shown by the elegant work done with the E. coli
enzyme [20,22–24] and the expected overall similarity
between Mt- and Ec-GluRS. However, our data are
consistent with a minimal reaction scheme in which
tRNA binding to the free enzyme is followed by an
activatory conformational change [5] and random
binding of l-Glu and ATP to the latter species
(Scheme 1). In particular, the competitive inhibition
pattern observed with GoA versus l-Glu and ATP is
diagnostic for the random sequential portion of the
Scheme 1. Minimal kinetic scheme of the
Mt-GluRS reaction.
M. tuberculosis glutamyl–tRNA synthetase S. Paravisi et al.
1408 FEBS Journal 276 (2009) 1398–1417 ª 2009 The Authors Journal compilation ª 2009 FEBS
kinetic mechanism as discussed recently [36] for bisub-
strate inhibitors.
In the absence of tRNA and l-Glu, Mt-GluRS was
found to hydrolyse ATP to ADP + P
i
, although the
reaction velocity was only 0.1% that of the physiologi-
cal tRNA
Glu
charging reaction, under the same condi-
tions, leading to the conclusion that this reaction is
not biologically relevant.
Mt-GluRS differs from Ec- , Tt- and Te-GluRS for
the oligomeric state in that its monomer exists in solu-
tion in equilibrium with the dimeric species. At the low
concentrations used in the activity assays, the enzyme
monomer should prevail, indicating that this species is
catalytically active. By contrast, Ec-GluRS and
Tt-GluRS [5,12–14] appear to be strictly monomeric,
whereas the crystal structure of the Te-GluRS shows
dimers [15]. By using SAXS and the Tt- and Te-GluRS
structures for rigid body modeling, it was determined
that the overall shape of the Mt- and Ec-GluRS
subunits are similar to each other and to those of
Tt- and Te-GluRS. SAXS sensitivity is not sufficient to
distinguish among the conformations of Tt-GluRS
bound to the different ligands and that of the
Te-GluRS subunit. The crystallographically detected
conformations are indeed catalytically significant, but
structurally minor, implying rotations of domains of
just a few degrees (e.g. 7° interdomain rotations upon
tRNA binding to the Tt-GluRS and local limited
rearrangements in the active site) [5]. Interestingly, the
Mt-GluRS dimer found in solution appears to differ
from that found in the Te-GluRS crystals [15]. How-
ever, by fitting the SAXS curves a model could be built,
which indicates that this species may be catalytically
active because the tRNA binding surface and ATP and
l-Glu binding sites are solvent accessible. Despite the
structural similarity of the enzyme subunits, Mt-GluRS
is significantly more sensitive than Ec-GluRS to prote-
olysis, suggesting greater conformational flexibility. In
both enzymes, the sites sensitive to chymotryptic attack
are next to the ATP-binding site. However, only in the
case of Mt-GluRS are the chymotrypsin-sensitive sites
protected by ATP and GoA, highlighting another dif-
ference between the enzymes. Interestingly, ATP and
GoA had a similar effect on the proteolytic pattern of
Mt-GluRS, but only ATP appeared to stabilize the
monomeric form, as established by SAXS. The flexibil-
ity of Mt-GluRS coupled to the monomer ⁄ dimer equi-
librium may be the reason for the failure to obtain
crystals suitable for determination of the Mt-GluRS
structure by X-ray diffraction.
Despite M. tuberculosis genome analysis indicating
that Mt-GluRS is of the discriminatory type (see above
for details), overproduction of Mt-GluRS in E. coli cells,
which lack the Glu–tRNA
Gln
amidotransferase needed
to correct the misacylation of tRNA
Gln
caused by a ND-
GluRS, is not toxic. These results lead to the conclusion
that Mt-GluRS ⁄ tRNA
Gln
recognition is species specific.
Sequence analyses may provide a rationale for the
discriminating behaviour of Mt-GluRS in E. coli.
Studies on Tt-GluRS indicated that discriminating
and nondiscriminating GluRS can be distinguished on
the basis of the presence of a specific Arg residue
(Arg358 in Tt-GluRS, Arg350 in Ec-GluRS) in the
anticodon recognition region of GluRS [12] (Fig. S7).
Indeed, its substitution with a Gln, the residue found
at the equivalent position in Bs-GluRS, conferred non-
discriminating properties on Tt-GluRS [12]. Further-
more, Te-GluRS, a ND-GluRS, contains Gly366 in
the position equivalent to Arg358 of Tt-GluRS [15].
However, site-directed mutagenesis of the two GluRS
isoforms of Helicobacter pylori and comparative
sequence analyses [37] indicated that the Arg residue is
not sufficient to distinguish between D- and ND-
GluRS but, more likely, several residues are important.
One was identified as a Thr (Thr444 in Tt-GluRS)
found in most D-GluRS, which is often substituted by
Gly, Ala, Ser (e.g. Gly454 in Te-GluRS) in ND-
GluRS. A third candidate was found by Schultze et al.
[15] who observed that in Tt-GluRS Arg358 forms a
salt bridge with Glu443, which is not found in several
ND-GluRS even when they have an Arg residue equiv-
alent to Tt-GluRS Arg358. Comparison of the
sequence of Mt-GluRS with those of the T. thermophi-
lus, T. elongatus, E. coli and B. subtilis enzymes
showed that Arg372 of Mt-GluRS is at a position
equivalent to that of Arg358 in Tt-GluRS, and Ser461
substitutes Thr444 (Fig. S7). In Mt-GluRS the pre-
ceeding residue is Val460, which corresponds to
Glu443 of Tt-GluRS and His453 of Te-GluRS. Thus,
Mt-GluRS seems to obey to the rules established pre-
viously [15,37] for a ND-GluRS. However, these rules
do not seem sufficient to predict the discriminating
properties of a GluRS. In particular, the discriminat-
ing Ec-GluRS has a Gln437–Ser438 pair where a
Glu–Thr is expected. That Mt-GluRS may be of the
nondiscriminating type in M. tuberculosis (as sup-
ported by genome analyses), but its sequence shares
features with the discriminating Ec-GluRS (Arg372,
Val460 and Ser461 in Mt-GluRS versus Arg350,
Gln437 and Ser438 in Ec-GluRS), might explain the
absence of toxicity of its overproduction in E. coli
where it behaves as a D-GluRS like the endogenous
enzyme.
Finally, we found that M. tuberculosis GluRS
and GluTR can form a complex confirming the
results obtained with C. reinhardtii enzymes [11] and
S. Paravisi et al. M. tuberculosis glutamyl–tRNA synthetase
FEBS Journal 276 (2009) 1398–1417 ª 2009 The Authors Journal compilation ª 2009 FEBS 1409
supporting the concept that in M. tuberculosis forma-
tion of this complex may regulate the flux of Glu–
tRNA
Glu
toward tetrapyrrole biosynthesis as opposed
to that of proteins. During the course of these studies
we also demonstrated that Mt-GluTR contains bound
heme, a property previously ascribed only to the plant-
type enzyme [38,39]. Finally, the fact that Mt-GluTR
isolated using Mt-GluRS as bait does not seem to
aggregate or precipitate also opens the way to the iso-
lation and subsequent characterization of this enzyme
responsible for heme biosynthesis, which has also been
demonstrated to be essential in M. tuberculosis [16].
Materials and methods
Chemicals and materials
Restriction endonucleases were obtained from GE Health-
care (Chalfont St Giles, UK) and Promega (Madison, WI,
USA). Unless otherwise stated, chemicals were purchased
from Sigma-Aldrich (St Louis, MO, USA) or Merck
(Whitehouse Station, NJ, USA). TLC poly(ethyleneimine)–
cellulose sheets with fluorescent indicator (254 nm) were
from Macherey-Nagel (Du
¨
ren, Germany).
Cloning of M. tuberculosis GluRS gene
M. tuberculosis Rv2992c, corresponding to the putative
gltX gene encoding GluRS, was amplified by PCR using
cosmid BAC Rv30 from the Institut Pasteur collection as
the template in the presence of synthetic oligonucleotides
pairs.
Primer 1: 5¢-AAGAAGAAG
CATATGTCACCGTGCCCG
ACCAGCTG-3¢
Primer 2: 5¢-AAGAAGAAG
CATATGACCGCCACGG
AAACAGTCCGG-3¢
The primers introduced NdeI sites (underlined) for clon-
ing of the amplified fragment into pET11a (Novagen, San
Diego, CA, USA) digested with NdeI. The GTG start
codon was also changed into an ATG (bold in Primer 1)
by the insertion of the NdeI restriction site. PCR was set
up by mixing BAC Rv30 (30 ng), dNTPs (50 lm each), pri-
mer 1 and 2 (24 pmol each) and PfuTurbo Taq polymerase
(Stratagene, La Jolla, CA, USA) (15 U) in 20 mm
Tris ⁄ HCl buffer, pH 8.8, 10 mm KCl, 10 mm (NH
4
)
2
SO
4
,
2mm MgSO
4
, 0.1% Triton X-100 and 0.1 mgÆmL
)1
BSA.
PCR conditions were as follows: cycle 1, 5 min at 95 °C;
cycles 2–36, 1 min at 95 °C, 30 s at 60 °C and 4 min at
72 °C; cycle 37, 8 min at 72 °C. The amplified 1500 bp
fragment was purified using the QiaQuik Gel Extraction
Kit (Qiagen, Venlo, NL, USA) according to the manufac-
turer’s instructions, precipitated and digested with NdeI.
After purification by agarose gel electrophoresis the frag-
ment was ligated with pET11a that had been digested with
the same restriction enzyme and purified, yielding pET-
GTS1. The NdeI fragment was also cloned into pET28b
(Novagen) digested with the same enzyme. The resulting
plasmid (pETGTS2) encoded a fusion between an N-termi-
nal His
6
tag and the Rv2992c coding region with a ten resi-
dues spacer between the sixth His residue and the start
codon of the predicted Rv2992c gene product. The result-
ing protein is indicated as His
6
-GluRS. The insert of all
plasmids and the adjacent regions were sequenced by
PRIMM srl (Milan, Italy).
Production of M. tuberculosis GluRS in E. coli
BL21(DE3) cells
pETGTS1 and pETGTS2 were used to produce the
Rv2992c gene product or the N-terminally His
6
-tagged vari-
ant, respectively, in E. coli BL21(DE3) cells grown at 25 °C
in Luria-Bertani medium containing 0.1 mgÆmL
)1
ampicil-
lin. Overexpression of the heterologous gene was induced at
an D
600
value of 0.7 by adding IPTG to a final concentra-
tion of 0.1 mm. After 19 h, cells were harvested by centrifu-
gation at 6000 g and 4 °C for 15 min. The cell pellet was
washed with 0.9% NaCl and stored at )20 °C until protein
purification.
Production of E. coli GluRS in E. coli BL21(DE3)
cells
Plasmid pET-ERS was a kind gift of J. Lapointe (Univer-
site
´
Laval, Que
´
bec, Canada). It was transformed into
E. coli BL21(DE3, pLysS) cells, which were grown in Luri-
a–Bertani medium containing 60 lgÆmL
)1
kanamycin and
34 lgÆmL
)1
chloramphenicol at 37 °C until D
600
reached
0.3. Overproduction of the Ec-GluRS was induced by add-
ing IPTG at a final concentration of 0.1 mm. After 5 h,
cells were harvested and stored as described above.
Determination of protein concentration
Protein concentration of crude extracts was determined by
the biuret method [40] and that of purified samples using
the Bradford Reagent (Amresco, Solon, OH, USA) [41].
BSA (Sigma) was used as the standard. Using an electro-
phoretically homogeneous protein preparation it was deter-
mined that a 1 mgÆmL
)1
Mt-GluRS solution absorbs
0.79 ± 0.064 at 280 nm (average of 10 determinations), a
value similar to that reported for the Ec-GluRS
(e
280
= 0.87) [18]. To calculate the enzyme concentration a
mass of 53 685 was used for Mt-GluRS by taking into
account the post-translational removal of Met-1 to yield
the predicted 489 residues protein. A mass of 55 876 was
used for His
6
–GluRS (509 residues after removal of Met-1).
A mass of 53 669 was used for Ec-GluRS (470 residues for
the mature protein).
M. tuberculosis glutamyl–tRNA synthetase S. Paravisi et al.
1410 FEBS Journal 276 (2009) 1398–1417 ª 2009 The Authors Journal compilation ª 2009 FEBS
Purification of Mt-GluRS
The procedures of Lin et al. [17], Lapointe et al. [18] and
Kern et al. [18,33] for Ec-GluRS were combined to obtain
homogeneous preparations of Mt-GluRS. Purification con-
sisted of: (a) resuspension of 10–20 g cells in 20–40 mL
10 mm (K)PO
4
buffer, pH 7.5, 10% glycerol, 1 mm phen-
ylmethanesulfonyl fluoride, 1 mm dithiothreitol, and cell
disruption by sonication and centrifugation at 25 500 g for
1 h at 4 °C; (b) poly(ethylene glycol) 6000 (7%, w ⁄ v) ⁄ dex-
tran (1.4%, w ⁄ v) partitioning of the crude extract; (c)
recovery of the top poly(ethylene glycol)-rich phase after
centrifugation at 17 500 g for 20 min; (d) chromatography
on a first Q-Sepharose ion-exchange column (1.5 · 11.3 cm,
20 mL; GE Healthcare) equilibrated in buffer A (20 m m
Tris ⁄ HCl, pH 7.4 25 °C, 10% glycerol, 1 mm dithiothrei-
tol), eluted with buffer A + 0.2 m NaCl (5 vol) and a 0.2–
1.0 m NaCl gradient in buffer A (20 vol, 1 mLÆmin
)1
); (e)
concentration of the pooled GluRS-containing fractions by
ultrafiltration in an Amicon apparatus (Millipore, Billerica,
MA, USA) equipped with a YM10 membrane, and dialysis
against buffer B (50 mm Hepes ⁄ NaOH, pH 8.0, 10% glyc-
erol, 1 mm dithiothreitol, 2 L); (f) chromatography on a
second Q-Sepharose column (1.5 · 8.49 cm, 15 mL) equili-
brated in buffer C (20 mm (K)PO
4
buffer, pH 7.5, 10%
glycerol, 1 mm dithiothreitol), and eluted with buffer C
(1 vol) followed by a gradient in which the (K)PO
4
concen-
tration was varied from 20 to 250 mm and the pH from 7.5
to 6.5 in 20 vol at a flow-rate of 1 mLÆmin
)1
; (g) concentra-
tion of the GluRS-containing fractions by ultrafiltration to
20 mgÆmL
)1
and 4 mL; and and (h) dialysis against 1 L
of buffer B (5 h) followed by dialysis against 0.5 L of buf-
fer B containing 50% glycerol (14 h). The enzyme (typically
40 mgÆmL
)1
) was stored at )20 °C without significant activ-
ity loss for up to 2 years.
GluRS-containing fractions were pooled after each step
on the basis of their electrophoretic pattern. Mt-GluRS
eluted from the first column between 0.2 and 0.3 m NaCl,
and from the second at 150 mm (K)PO
4
and pH 7.2. The
same purification procedure was used to obtain Ec-GluRS
preparations.
E. coli BL21 (DE3, pETGTS2) cells (12 g) that had
overproduced His
6
–GluRS, were resuspended in 10 mm
Hepes ⁄ NaOH, pH 8.0, 10% glycerol, 5 mm b-mercaptoetha-
nol (b-ME), 1 mm phenylmethanesulfonyl fluoride (24 mL),
disrupted by sonication and centrifuged. Twenty milliliters
of a 50% Ni-nitrilotriacetic acid–Sepharose (Novagen-
Merck, Darmstadt, Germany) suspension equilibrated in the
homogenization buffer were added to the crude extract and
the suspension was incubated for 1 h at 12 r.p.m. and 4 °C
on a rotary shaker. The resin was packed into a chromato-
graphic column (inner diameter, 1.5 cm), washed with one
column volume of the equilibration buffer, 1 vol of the same
buffer containing 0.5 m NaCl, 5 vol of buffer containing
0.5 m NaCl and 10 mm imidazole and then developed with a
10–100 mm imidazole gradient in buffer + 0.5 m NaCl
(15 vol, 1 mLÆmin
)1
). The enzyme eluted from this column
at 70 mm imidazole. The His
6
–GluRS-containing
fractions were pooled on the basis of their electrophoretic
pattern, concentrated by ultrafiltration and dialysed against
buffer B (2 L, for 5 h) and buffer B + 50% glycerol (0.5 L,
19 h) as described for the native enzyme preparation. Also
in this case, the enzyme (20–40 mgÆmL
)1
) was stable for
years when stored at )20 °C.
Electrophoretic techniques and western blots
SDS ⁄ PAGE was performed according to Laemmli [42]
using 12% minigels and a GE Healthcare SE280 apparatus.
Protein samples were denatured by incubation at 100 °C
for 10 min in SDS sample buffer [62.5 mm Tris ⁄ HCl,
pH 6.8, 2% (w ⁄ v) SDS, 0.001% (w ⁄ v) bromophenol blue,
10% (w ⁄ v) glycerol, 0.8 mm b-ME] added from two- or
fourfold concentrated stock solutions (2· SDS sample
buffer or 4· SDS sample buffer). After the run, the gels
were stained by immersion in 0.1% Coomassie Brilliant
Blue in 40% methanol, 10% acetic acid and destained by
diffusion in 40% methanol and 10% acetic acid.
N-terminal sequence, mass and aggregation state
of GluRS
A Mt-GluRS aliquot was gel filtered through a Sephadex
G25 (medium, GE Healthcare) column equilibrated
in 10 mm Hepes ⁄ KOH, pH 7.5, and concentrated to
5–10 mgÆmL
)1
using a Centricon-10 (Millipore) microcon-
centrator. The protein mass was determined on diluted
samples by MALDI-TOF with a Bruker Daltonics Reflex
IV instrument (Brucker Daltonics, Bremen, Germany)
equipped with a nitrogen laser. N-terminal sequencing of
GluRS and proteolytic fragments was carried out with an
Applied Biosystems (Foster City, CA, USA) Procise Model
491 sequencer using aliquots of the Mt-GluRS solution or
protein samples resolved by SDS ⁄ PAGE and electrotrans-
ferred onto a Immobilon-P
SQ
(Millipore) membrane,
stained with Coomassie Brilliant Blue and thoroughly
destained [43].
DLS measurements were carried out using a DynaPro
instrument (Protein Solutions, Charlottesville, VA, USA) in
a50lL quartz cuvette at 17 °C (average of 20 30 s acquisi-
tions, sensitivity 70–100% depending on protein concentra-
tion). Data were analysed using the dynapro software
(version V5 or V6). The software uses Eqn (7) [44] to calcu-
late the mass of globular protein of 24–110 kDa.
MW ¼ 4=3ðÞpN
A
Rh=FricRatioðÞ
3
=SpecVol ð7Þ
where MW is the molecular mass, N
A
is Avogadro’s num-
ber (6.022 · 10
23
mol
)1
), Rh is the radius in cm, SpecVol is
the specific volume (0.726 cm
3
Æg
)1
) and FricRatio is the
S. Paravisi et al. M. tuberculosis glutamyl–tRNA synthetase
FEBS Journal 276 (2009) 1398–1417 ª 2009 The Authors Journal compilation ª 2009 FEBS 1411
frictional ratio (1.25707). Protein samples were centrifuged
in a microfuge at 15 000 g for 10 min at 4 °C before each
measurement.
Activity assays
tRNA charging reaction
The tRNA aminoacylation activity of Mt-GluRS was deter-
mined at 37 °C by measuring the rate of formation of acid-
precipitable l-[U
14
C]Glu–tRNA as described previously
[18,33]. Standard assays contained 35 mm Hepes ⁄ NaOH,
pH 7.3, 25 mm KCl, 2 mm dithiothreitol (buffer C), 0.5–
2mm l-[U
14
C]Glu (11 431 dpmÆnmol
)1
; GE Healthcare),
10 mm MgCl
2
,1mm ATP, 3.6 lm E. coli tRNA
Glu
, 0.1%
BSA and enzyme (typically, 10–100 ng, 0.19–1.9 pmol,
1.24–12.4 nm) in a volume of 150 lL. E. coli tRNA
Glu
(55–
60% specific tRNA
Glu
; Sigma) was resuspended in buffer C
to yield a 160 lm stock solution, which was stored in small
aliquots at )20 °C. The amount of tRNA
Glu
present in each
batch and its stability were checked by quantifying the
amount of l-[U
14
C]Glu–tRNA obtained in assays in which
the charging of the tRNA present was brought to comple-
tion. Mt-GluRS stock solutions (typically 20–40 mgÆmL
)1
)
were first diluted to 1 mgÆmL
)1
in 40 mm Hepes ⁄ NaOH,
pH 8.0, 10% glycerol. The protein concentration was deter-
mined with the Bradford reagent at this stage. The enzyme
solution was then serially diluted to up to 10 lgÆmL
)1
in the
same buffer containing 0.1% BSA. For each assay, the reac-
tion mixture (145.5 lL) lacking tRNA was equilibrated at
37 °C for 5 min. A 20 lL aliquot was withdrawn and spot-
ted on a 1 · 1 cm square of Whatman 3MM filter paper
(GE Healthcare), which was immediately transferred to a
beaker containing 10% trichloroacetic acid and kept under
vigorous stirring until the end of the assay. The reaction
was started by adding tRNA
Glu
(4.5 lL). At different times
20-lL aliquots were withdrawn, spotted on the Whatman
3MM filters, which were transferred into 10% trichloroace-
tic acid with magnetic stirring. At the end of the assay, all
filters were transferred to fresh 10% trichloroacetic acid
(500 mL, 10 min). Washings in 5% trichloroacetic acid and
95% ethanol, with interval stirring (10 min each) followed.
Dried filters were placed in an 8 mL plastic vial. Radioactiv-
ity was determined by scintillation counting in a TriCarb
2100-TR (Perkin–Elmer, Wellesley, MA, USA) after addi-
tion of 5 mL of Ultima Gold (Perkin–Elmer) scintillation
fluid. dpm were calculated from cpm using a calibration
curve made with a [
14
C] standard (Perkin–Elmer). The
amount of l-[U
14
C]Glu–tRNA
Glu
(in nmol) formed in the
20 lL aliquot at the different times was calculated. The ini-
tial velocity (v) of reactions was determined by interpolating
the initial linear portion of the curve of Glu–tRNA
Glu
formed as a function of time. Activity was expressed as
apparent turnover number (v ⁄ E in min
)1
) by taking into
account the amount of enzyme (E) present in the 20 lL
aliquot (in nmol).
Steady-state kinetic analyses and inhibition studies
The apparent k
cat
and K
M
values of Mt-GluRS for tRNA
Glu
,
ATP and l-Glu were determined in the tRNA aminoacyla-
tion reaction at 37 °C as described above, except that the
concentration of one of the substrates was varied and the lev-
els of the others fixed. In these assays the amount of enzyme
was chosen in order to observe linearity up to 10 min, and
aliquots were typically withdrawn at 1, 2, 3, 5 and 10 min.
The grafit 4.3 software package (Erithacus Software Ltd,
East Grinstead, UK) was used to fit the v ⁄ E values as a func-
tion of the varied substrate concentration (S) to the Michael-
is–Menten equation (Eqn 8) after inspection of the
Lineweaver–Burk (double reciprocal) plot (Eqn 9), and to
obtain the values and the associated errors of the steady-state
kinetic parameters [45].
v/E = (k
cat
S)/(K
M
+S) ð8Þ
v/E = (1/ k
cat
ÞþðK
M
=k
cat
)(1/S) ð9Þ
Inhibition studies were performed by measuring the
initial velocity of reactions that contained fixed levels of the
inhibitor (I), varying concentration of one of the substrates
and constant concentration of others. After inspection of
the Dixon or the double-reciprocal plots, the data were fit-
ted to the equation describing competitive (Eqn 10), non-
competitive (Eqn 11) or uncompetitive (Eqn 12) inhibition.
In Eqn (10), K
is
and K
ii
are the inhibition constants affect-
ing the slopes and the intercepts of the double reciprocal
plots, respectively [45].
v/E = (k
cat
S)/[S + K
M
(1 + I/K
i
Þ ð10Þ
v/E = (k
cat
S)/[S(1 + I/K
ii
ÞþK
M
(1 + I/K
is
Þ ð11Þ
v/E = (k
cat
S)/[S(1 + I/K
ii
ÞþK
M
ð12Þ
The pH dependence of the apparent k
cat
and k
cat
⁄ K
l-Glu
values was measured at fixed levels of ATP (1 mm) and
tRNA
Glu
(3.6 lm) and varying l-Glu (0.2–2.0 mm)in
35 mm Hepes ⁄ NaOH buffer at pH 6.5–8.5. All other condi-
tions were as stated for the standard activity assay. The cal-
culated values of k
cat
and k
cat
⁄ K
l-Glu
were fitted to Eqns
(13,14), respectively [45].
Y ¼
Limit 10
ðpHpK
a
Þ
10
ðpHpK
a
Þ
þ 1 ð13Þ
Y ¼
Limit 10
ðpK
a
pHÞ
10
ðpK
a
pHÞ
þ 1 ð14Þ
In Eqns (13,14), Limit is the pH independent value of the
steady-state kinetic parameter under analysis (Y).
M. tuberculosis glutamyl–tRNA synthetase S. Paravisi et al.
1412 FEBS Journal 276 (2009) 1398–1417 ª 2009 The Authors Journal compilation ª 2009 FEBS
Chromatographic separation of reaction components
using [2,5¢,8
3
H]ATP and L-[U
14
C]Glu
GluRS (0.5–61 lg; final concentration, 0.06–7.5 lm) from a
stock solution prepared as described for the tRNA charging
reaction was incubated in 35 mm Hepes ⁄ NaOH buffer
pH 7.3, 2 mm dithiothreitol, 10% glycerol, 1 mm
[2,5¢,8
3
H]ATP (33 300 dpmÆnmol
)1
; Perkin–Elmer), 10 mm
MgCl
2
,25mm KCl, 2 mml-Glu in the presence or absence
of 3.0 lm tRNA
Glu
(final volume: 150 lL). After 1–20 min
at 37 °C, aliquots were injected directly or after dilution
with cold water onto a MonoQ column connected to an
AKTA apparatus (GE Healthcare) equipped with an absor-
bance detector set at 254 nm. The column was equilibrated
with 20 mm triethanolamine ⁄ HCl buffer, pH 7.7 [46]. Elu-
tion was performed by washing the column with 14 vol of
the equilibrating buffer and then increasing KCl concentra-
tion in the buffer from 0 to 0.3 m in 30 vol and from 0.3 to
1 m in 8 vol. After 3 vol of buffer containing 1 m KCl, the
column was re-equilibrated in the starting buffer. The flow
rate was 1 mLÆ min
)1
and fractions (1 mL) were directly col-
lected in 8 mL plastic vials. The radioactivity was deter-
mined by scintillation counting. Assays were also carried
out under the same conditions using unlabeled ATP and
l-[U
14
C]Glu. In preliminary experiments, 200 lL aliquots
of ATP, ADP and AMP (1 mm each), l-[U
14
C]Glu (2 mm)
and tRNA
Glu
(3.0 lm) were loaded onto the MonoQ col-
umn to identify their elution positions. Control experiments
also showed that addition of unlabeled nucleotides, as
carrier, to the samples under analyses did not alter the
chromatography nor the distribution and recovery of
radioactivity.
TLC separation of reaction components
AMP, ADP, ATP, P
i
and PP
i
were resolved by TLC on
poly(ethyleneimine)–cellulose sheets as described previously
[47]. The enzyme (0.05–6.4 lg, 0.9–118 pmol, final concen-
tration, 6–790 n m) was incubated in 35 mm Hepes ⁄ NaOH
buffer, pH 7.3, 10% glycerol, 2 mm dithiothreitol, 25 mm
KCl, 1 mm [2, 5¢,8
3
H]ATP (33 300 dpmÆnmol
)1
; Perkin-
Elmer), 10 mm MgCl
2
,2mml-Glu, 0.004% BSA in the
presence or absence of 3.6 lm tRNA
Glu
(final volume:
150 lL). Parallel samples, lacking one or more of the com-
ponents were also set up. At different times of incubation
at 37 °C10lL aliquots were removed and applied onto the
poly(ethyleneimine)-cellulose sheets, which were immedi-
ately developed with 0.75 m NaH
2
PO
4
⁄ H
3
PO
4
buffer,
pH 3.4, as the mobile phase. For optimal resolution and
minimal background, the poly(ethyleneimine)–cellulose
sheets had to be pre-developed in 1.75 m K
2
PO
4
⁄ H
3
PO
4
buffer, pH 3.4, washed with water, dried and stored at 4 °C
for at least 19 h [48]. Spots corresponding to AMP, ADP
and ATP were identified with a UV lamp at 254 nm. Strips
corresponding to the sample lanes were cut into 1.5 cm
squares and transferred to 8 mL vials for scintillation
counting.
[
32
P]PP
i
⁄ ATP exchange assay
Incorporation of [
32
P]PP
i
into ATP was determined in reac-
tion mixtures containing 100 mm Hepes ⁄ NaOH, pH 7.2,
2mm ATP, 16 mm MgCl
2
,6mml-glutamate, 0.3% glyc-
erol, 25 mm KCl, 1 mm Na-[
32
P]-PP
i
(from a 85 mm stock
solution, 231 113 dpmÆnmol
)1
), 3.2 lm tRNA
Glu
and
Mt-GluRS (0-0.7 lm) [23]. After incubation at 37 °C for
different times, 1–10 lL aliquots were applied onto the
poly(ethyleneimine)–cellulose sheets, which were developed
as described above. The migration position of the nucleo-
tides was determined by irradiation with UV light. It was
marked on the sheet by spotting 1 lL of the radioactive
PP
i
solution (2000 dpm) on a lane in which a mixture of
AMP, ADP and ATP was resolved. The autoradiographic
image was recorded on a storage phosphor screen
(Molecular Dynamics, Sunnyvale, CA, now GE Healthcare)
for 5–10 min, and analysed with a Typhoon 9400 (GE
Healthcare) phosphoimager using the manufacturer’s
software. Quantitation of [
32
P]ATP was carried out with
imagequant 5.2 (GE Healthcare) software. Phosphoimager
counts were converted into dpm using a calibration curve
made for each TLC sheet by spotting aliquots of [
32
P]PP
i
solutions of known radioactivity onto a free lane of the
sheet before data collection.
Limited proteolysis
Ec-GluRS or Mt-GluRS (1 mgÆmL
)1
) were incubated with
0.1–10% (w ⁄ w) N
a
-tosyl-l-phenyl chloromethyl ketone-
treated trypsin (Sigma) in 50 mm Hepes ⁄ NaOH buffer,
pH 8.0, at 25 °C, in a final volume of 100–200 lL. Before
trypsin addition, and at different incubation times, 10 lL
aliquots of the reaction mixture were transferred into
eppendorf tubes containing 20 lL2· SDS sample buffer,
N
a
-tosyl-l-lysyl chloromethyl ketone, 20 mm, 10 lL).
Proteins were immediately denatured by incubation at
100 °C for 10 min. This procedure was found to be suffi-
cient to block proteolysis. Similar experiments were carried
out using N
a
-tosyl-l-lysyl chloromethyl ketone-treated chy-
motrypsin instead of trypsin, except for the fact that the
reaction was blocked by transferring the 10 lL aliquots in
eppendorf tubes containing N
a
-tosyl-l-phenyl chloromethyl
ketone instead of N
a
-tosyl-l-lysyl chloromethyl ketone.
Proteolysis products were resolved by SDS ⁄ PAGE, visu-
alized by Coomassie Brilliant Blue staining. Their mass was
calculated from a calibration curve built with the 14–
202 kDa molecular mass protein standard mix (Sigma). To
identify the sites of proteolysis, the proteins were blotted
onto Immobilon P
SQ
(Millipore) membranes after
SDS ⁄ PAGE, and subjected to N-terminal sequencing.
Sequences were compared with the known sequences of
S. Paravisi et al. M. tuberculosis glutamyl–tRNA synthetase
FEBS Journal 276 (2009) 1398–1417 ª 2009 The Authors Journal compilation ª 2009 FEBS 1413
Mt-GluRS (UniProtKB accession number P0A636) and
Ec-GluRS (UniProtKB accession number P04805).
Small angle X-ray scattering data collection and
modeling
Synchrotron X-ray scattering data from solutions of
Mt- and Ec-GluRs in the presence or absence of ligands
were collected at the X33 beamline (DESY, Hamburg,
Germany) [49] at protein concentrations (c) ranging from
11 to 0.5 mgÆmL
)1
. At a sample-detector distance of 2.7 m,
the range of momentum transfer 0.1 < s <5nm
)1
was
covered [s =4p sin(h) ⁄ k, where 2h is the scattering angle
and k = 0.15 nm is the X-ray wavelength]. The data were
processed using standard procedures by the program pack-
age primus [27]. The forward scattering I(0) and R
g
were
evaluated using the indirect transform package gnom [50].
The effective molecular mass of the solute (MM) was esti-
mated by comparison of the forward scattering I(0) with
that from reference solutions of BSA (MM = 66 kDa).
The scattering intensities for monomeric and dimeric mod-
els of Mt-GluRS were computed by crysol [26] from the
atomic coordinates of the discriminating Tt-GluRS (PDB
files: 1n75 for the complex with ATP; 1j09 for the complex
with ATP and Glu; 1n77 for the complex with tRNA and
ATP; 1n78 for the complex with tRNA and GoA; 1g59 for
the complex with tRNA) and of the nondiscriminating
Te-GluRS (PDB file 2cfo for the complex with Glu) and
were used to analyse the oligomeric composition of all the
samples. The program oligomer [27] was used to find the
volume fractions of components minimizing the discrepancy
v
2
(normalized sum of the reduced standard deviations)
between the linear superposition of the weighted intensities
of the components and the experimental data from the
mixture.
GluRS ⁄ GluTR interaction
Rv0509 encoding the putative Mt-GluTR was amplified
from cosmid MTCY20G9 (Institut Pasteur) following a
scheme similar to that described for the construction of
pETGTS1. The insert of the resulting plasmid (pGTR) was
also reamplified in order to remove the stop codon and
engineer a XhoI site at the 3¢-end of the ORF to allow for
cloning in pET23b digested with NdeI and XhoI. The
resulting plasmid (pGTRHis) encodes a GluTR species car-
rying a C-terminal His
6
tag (Mt-GluTR–His). With both
plasmids the amount of soluble protein increased by
co-transforming E. coli BL21(DE3) cells with pGTR6 or
pGTRHis and p20 [28]. The latter plasmid encodes the
E. coli chaperons DnaJ, DnaK and GrpE. Transformed
E. coli cells were grown in Luria–Bertani medium supple-
mented with 100 lgÆmL
)1
ampicillin, 25 lgÆmL
)1
chloram-
phenicol until the D
600
of the culture reached a value of
1. The culture was transferred at 15 °C and induction of
the plasmid-encoded proteins was obtained with 0.1 mm
IPTG. Cells were harvested after 17 h.
To study the GluTR-GluRS interaction, 2 g of E. coli
BL21 (DE3, pGTR, p20) cells that had produced the
native Mt-GluTR, were resuspended in 20 mm
Hepes ⁄ NaOH buffer, pH 8.0, 10% glycerol, 5 mm b-ME
and 1 mm phenylmethanesulfonyl fluoride (4 mL). Glass
beads (12 g; 0.3 mm diameter) were added and cells were
disrupted by applying five cycles of vigorous vortexing
(1 min) followed by 1 min on ice. After twofold dilution,
the homogenate and a 2 mL rinse of the glass beads were
centrifuged for 1 h at 22 500 g at 4 °C. The crude extract
(13–15 mL) was diluted fivefold in 20 mm Hepes ⁄ NaOH
buffer, pH 8.0, 10% glycerol. Mt-His
6
-GluRS (2 mL of a
1mgÆ mL
)1
solution in the same buffer + 1 mm b-ME)
was added. After incubation for 30 min at 4 °C and
10 r.p.m. on a rotary shaker, 2 mL of a 50% Ni-nitrilotri-
acetic acid-Sepharose suspension in the same buf-
fer + 1 mm b-ME was added. After 1 h the suspension
was poured into a small chromatographic column (inner
diameter, 1.6 cm) and the packed resin was extensively
washed with the equilibration buffer. The column was
developed with a stepwise 0–500 mm imidazole gradient in
20 mm Hepes ⁄ NaOH buffer, pH 8.0, 1 mm b-ME. Aliqu-
ots of the collected fractions were denatured for
SDS ⁄ PAGE as described above. For each condition two
controls were also performed: (a) the His
6
-GluRS solution
was substituted by the same volume of buffer; (b) the cell
extract was substituted by a crude extract of E. coli BL21
(DE3, pET23b, p20) cells. The gels were stained with Coo-
massie Brilliant Blue, destained and the images were
scanned with a ImageScanner (GE Healthcare). GluTR
and GluRS proteins in the various fractions were quanti-
fied using GluRS and GluTR standards as the reference.
Bands corresponding to GluTR were identified by western
blotting and immunodecoration with rabbit anti-Mt-
GluTR IgG prepared for us by PRIMM srl (Milan) using
samples of electrophoretically homogeneous Mt-GluTR–
His
6
. The latter was prepared by Ni-nitrilotriacetic acid–
Sepharose affinity chromatograhy under denaturing
conditions (6 m urea) from E. coli BL21 (DE3) cells trans-
formed with pGTRHis and grown at 25 °C with the addi-
tion of IPTG when D
600
was 1 and harvested after 15 h.
A similar experimental scheme was followed by using
extracts of cells that had overproduced GluTR–His and
purified GluRS.
Testing the toxicity of Mt-GluRS in E. coli BL21(DE3)
cells
The method described by Baick et al. [25] to establish the
toxicity of the expression of B. subtilis nondiscriminating
GluRS in E. coli was adapted. E. coli BL21 (DE3, pET-
GTS1) cells were grown in Luria–Bertani medium contain-
ing 0.1 mgÆmL
)1
ampicillin medium at 30 °C and
M. tuberculosis glutamyl–tRNA synthetase S. Paravisi et al.
1414 FEBS Journal 276 (2009) 1398–1417 ª 2009 The Authors Journal compilation ª 2009 FEBS
220 r.p.m. until the culture reached an D
600
of 1.0. Serial
dilutions (to 10
)5
and 2 · 10
)6
) were done in Luria–
Bertani broth. Aliquots (200 lL) of the 10
)5
dilution were
added to 3 mL 0.7% top agar made with Luria–Bertani
medium containing 0.1 mm IPTG or IPTG and
0.1 mgÆmL
)1
ampicillin. The top agar was poured onto
Luria–Bertani plates without ampicillin or with
0.1 mgÆmL
)1
ampicillin, respectively. Aliquots (200 lL) of
the 2 · 10
)6
diluted culture were mixed with top agar with
0 or 0.1 mgÆmL
)1
ampicillin, and the top agar was poured
on Luria–Bertani or Luria–Bertani medium containing
0.1 mgÆmL
)1
ampicillin plates, respectively. The plates were
incubated for up to 48 h at 37 or 25 °C (the latter to mim-
ick large scale growth conditions). The effect of l-Glu or
l-Gln (2.5 and 25 mm) in the Luria–Bertani medium was
also tested. In separate experiments, the toxicity caused by
the expression of Mt-GluRS in E. coli cells was determined
in M9 minimal medium in the presence of different l-Gln
or l-Glu concentrations. For these experiments E. coli
BL21 (DE3, pETGTS1) was grown in Luria–Bertani med-
ium containing 0.1 mgÆmL
)1
ampicillin serially diluted in
0.9% NaCl to 10
)5
and 2 · 10
)6
. Aliquots (200 lL) were
mixed with top agar and then poured on plates as
described above except for the fact that M9 medium was
used and that three series of samples were prepared con-
taining 0, 2.5 and 25 mml-Gln or l-Glu in both top agar
and plates. After incubation at 37 or 25 °C for up to 48 h,
the formed colonies were counted.
Miscellaneous techniques
UV–Vis absorbance measurements were done on HP8453
(Agilent Technologies, Santa Clara, CA, USA), Cary219 or
Cary100 (Varian, Palo Alto, CA, USA) spectrophotometers
connected to water baths.
Acknowledgements
This work was carried out thanks to funds from the
Ministero dell’Istruzione, Universita’ e Ricerca MIUR-
PRIN2003 (Rome, Italy), the European Union Con-
tract QLK2-CT-2000-01761 to BC and Fondazione
Cariplo (Milano, Italy) Contract 2004-1580 to MAV.
G. Riccardi, E. De Rossi and A. Aliverti are thanked
for the initial cloning of Rv0909. We are grateful to
J. Lapointe for the gift of pERS, to Dr Rizzi for the
gift of decoyinine and of the pyrophosphate analogs
tested, to A. Mattevi and M. Nardini for carrying out
crystallization trials, to G. Tedeschi and A. Negri for
performing MALDI-TOF analyses and N-terminal
sequencing, and to G. Deho
`
for helpful discussions.
PVK, MVP and DIS acknowledge support from the
EU design study SAXIER (contract RIDS No.
011934).
References
1 Jain A & Mondal R (2008) Extensively drug-resistant
tuberculosis: current challenges and threats. FEMS
Immunol Med Microbiol 53, 145–150.
2 Ibba M & Soll D (2000) Aminoacyl–tRNA synthesis.
Annu Rev Biochem 69, 617–650.
3 Schimmel P, Tao J & Hill J (1998) Aminoacyl tRNA
synthetases as targets for new anti-infectives. FASEB J
12, 1599–1609.
4 Ibba M, Losey HC, Kawarabayasi Y, Kikuchi H,
Bunjun S & Soll D (1999) Substrate recognition by class I
lysyl–tRNA synthetases: a molecular basis for gene
displacement. Proc Natl Acad Sci USA 96, 418–423.
5 Sekine S, Nureki O, Dubois DY, Bernier S, Chenevert
R, Lapointe J, Vassylyev DG & Yokoyama S (2003)
ATP binding by glutamyl–tRNA synthetase is switched
to the productive mode by tRNA binding. EMBO J 22,
676–688.
6 Salazar JC, Zuniga R, Raczniak G, Becker H, Soll D &
Orellana O (2001) A dual-specific Glu–tRNA(Gln) and
Asp–tRNA(Asn) amidotransferase is involved in decod-
ing glutamine and asparagine codons in Acidithiobacil-
lus ferrooxidans. FEBS Lett 500, 129–131.
7 Curnow AW, Hong K, Yuan R, Kim S, Martins O,
Winkler W, Henkin TM & Soll D (1997) Glu–tRNA
Gln
amidotransferase: a novel heterotrimeric enzyme
required for correct decoding of glutamine codons dur-
ing translation. Proc Natl Acad Sci USA 94 , 11819–
11826.
8 Heinemann IU, Jahn M & Jahn D (2008) The biochem-
istry of heme biosynthesis. Arch Biochem Biophys 474,
238–251.
9 Jahn D, Verkamp E & Soll D (1992) Glutamyl-transfer
RNA: a precursor of heme and chlorophyll biosynthe-
sis. Trends Biochem Sci 17, 215–218.
10 Levican G, Katz A, Valenzuela P, Soll D & Orellana O
(2005) A tRNA(Glu) that uncouples protein and tetra-
pyrrole biosynthesis. FEBS Lett 579, 6383–6387.
11 Jahn D (1992) Complex formation between glutamyl–
tRNA synthetase and glutamyl–tRNA reductase during
the tRNA-dependent synthesis of 5-aminolevulinic acid
in Chlamydomonas reinhardtii. FEBS Lett 314, 77–80.
12 Sekine S, Nureki O, Shimada A, Vassylyev DG &
Yokoyama S (2001) Structural basis for anticodon rec-
ognition by discriminating glutamyl–tRNA synthetase.
Nat Struct Biol 8, 203–206.
13 Sekine S, Shichiri M, Bernier S, Chenevert R, Lapo-
inte J & Yokoyama S (2006) Structural bases of
transfer RNA-dependent amino acid recognition and
activation by glutamyl–tRNA synthetase. Structure 14,
1791–1799.
14 Nureki O, Fukai S, Sekine S, Shimada A, Terada T,
Nakama T, Shirouzu M, Vassylyev DG & Yokoyama S
(2001) Structural basis for amino acid and tRNA
S. Paravisi et al. M. tuberculosis glutamyl–tRNA synthetase
FEBS Journal 276 (2009) 1398–1417 ª 2009 The Authors Journal compilation ª 2009 FEBS 1415
recognition by class I aminoacyl–tRNA synthetases.
Cold Spring Harbor Symp Quant Biol 66, 167–173.
15 Schulze JO, Masoumi A, Nickel D, Jahn M, Jahn D,
Schubert WD & Heinz DW (2006) Crystal structure of
a non-discriminating glutamyl–tRNA synthetase. J Mol
Biol 361, 888–897.
16 Sassetti CM, Boyd DH & Rubin EJ (2003) Genes
required for mycobacterial growth defined by high den-
sity mutagenesis. Mol Microbiol 48, 77–84.
17 Lin SX, Brisson A, Liu J, Roy PH & Lapointe J (1992)
Higher specific activity of the Escherichia coli glutamyl–
tRNA synthetase purified to homogeneity by a six-hour
procedure. Protein Expr Purif 3, 71–74.
18 Lapointe J, Levasseur S & Kern D (1985) Glutamyl–
tRNA synthetase from Escherichia coli. Methods Enzy-
mol 113, 42–49.
19 Nakamura J & Lou L (1995) Biochemical characteriza-
tion of human GMP synthetase. J Biol Chem 270,
7347–7353.
20 Kern D & Lapointe J (1981) The catalytic mechanism of
glutamyl–tRNA synthetase of Escherichia coli. A steady-
state kinetic investigation. Eur J Biochem 115, 29–38.
21 Desjardins M, Garneau S, Desgagnes J, Lacoste L,
Yang F, Lapointe J & Chenevert R (1998) Glutamyl
adenylate analogues are inhibitors of glutamyl–tRNA
synthetase. Bioorg Chem 26, 1–13.
22 Kern D & Lapointe J (1980) Catalytic mechanism of
glutamyl–tRNA synthetase from Escherichia coli. Reac-
tion pathway in the aminoacylation of tRNAGlu. Bio-
chemistry 19, 3060–3068.
23 Kern D & Lapointe J (1980) The catalytic mechanism
of the glutamyl–tRNA synthetase from Escherichia coli.
Detection of an intermediate complex in which gluta-
mate is activated. J Biol Chem 255, 1956–1961.
24 Kern D & Lapointe J (1980) The catalytic mechanism
of glutamyl–tRNA synthetase of Escherichia coli. Evi-
dence for a two-step aminoacylation pathway, and
study of the reactivity of the intermediate complex. Eur
J Biochem 106, 137–150.
25 Baick JW, Yoon JH, Namgoong S, Soll D, Kim SI,
Eom SH & Hong KW (2004) Growth inhibition of Esc-
herichia coli during heterologous expression of Bacil-
lus subtilis glutamyl–tRNA synthetase that catalyzes the
formation of mischarged glutamyl–tRNA1 Gln.
J Microbiol 42, 111–116.
26 Svergun DI, Barberato C & Koch MHJ (1995) CRY-
SOL – a program to evaluate X-ray solution scattering
of biological macromolecules from atomic coordinates.
J Appl Crystallogr 28, 768–773.
27 Konarev PV, Volkov VV, Sokolova AV, Koch MHJ &
Svergun DI (2003) PRIMUS – a Windows-PC based
system for small-angle scattering data analysis. J Appl
Crystallogr 36, 1277–1282.
28 Castanie MP, Berges H, Oreglia J, Prere MF & Fayet
O (1997) A set of pBR322-compatible plasmids allowing
the testing of chaperone-assisted folding of proteins
overexpressed in
Escherichia coli. Anal Biochem 254,
150–152.
29 Moser J, Lorenz S, Hubschwerlen C, Rompf A & Jahn
D (1999) Methanopyrus kandleri glutamyl–tRNA reduc-
tase. J Biol Chem 274, 30679–30685.
30 Moser J, Schubert WD, Beier V, Bringemeier I, Jahn D
& Heinz DW (2001) V-shaped structure of glutamyl–
tRNA reductase, the first enzyme of tRNA-dependent
tetrapyrrole biosynthesis. EMBO J 20, 6583–6590.
31 Moser J, Schubert WD, Heinz DW & Jahn D (2002)
Structure and function of glutamyl–tRNA reductase
involved in 5-aminolaevulinic acid formation. Biochem
Soc Trans 30, 579–584.
32 Schauer S, Chaturvedi S, Randau L, Moser J, Kitaba-
take M, Lorenz S, Verkamp E, Schubert WD, Nakaya-
shiki T, Murai M et al. (2002) Escherichia coli
glutamyl–tRNA reductase. Trapping the thioester inter-
mediate. J Biol Chem 277, 48657–48663.
33 Kern D, Potier S, Boulanger Y & Lapointe J (1979)
The monomeric glutamyl–tRNA synthetase of Escheri-
chia coli. Purification and relation between its structural
and catalytic properties. J Biol Chem 254, 518–524.
34 Balg C, Blais SP, Bernier S, Huot JL, Couture M,
Lapointe J & Chenevert R (2007) Synthesis of
b-ketophosphonate analogs of glutamyl and glutaminyl
adenylate, and selective inhibition of the corresponding
bacterial aminoacyl–tRNA synthetases. Bioorg Med
Chem 15, 295–304.
35 Bernier S, Dubois DY, Habegger-Polomat C, Gagnon
LP, Lapointe J & Chenevert R (2005) Glutamylsulfa-
moyladenosine and pyroglutamylsulfamoyladenosine
are competitive inhibitors of E. coli glutamyl–tRNA
synthetase. J Enzyme Inhib Med Chem 20, 61–67.
36 Yu M, Magalhaes ML, Cook PF & Blanchard JS
(2006) Bisubstrate inhibition: theory and application to
N-acetyltransferases. Biochemistry 45, 14788–14794.
37 Lee J & Hendrickson TL (2004) Divergent anticodon
recognition in contrasting glutamyl–tRNA synthetases.
J Mol Biol 344, 1167–1174.
38 Srivastava A & Beale SI (2005) Glutamyl–tRNA reduc-
tase of Chlorobium vibrioforme is a dissociable homodi-
mer that contains one tightly bound heme per subunit.
J Bacteriol 187, 4444–4450.
39 Srivastava A, Lake V, Nogaj LA, Mayer SM, Willows
RD & Beale SI (2005) The Chlamydomonas reinhardtii
gtr gene encoding the tetrapyrrole biosynthetic enzyme
glutamyl–tRNA reductase: structure of the gene and
properties of the expressed enzyme. Plant Mol Biol 58,
643–658.
40 Gornall AG, Bardewill CJ & David MM (1949) Deter-
mination of serum proteins by means of the biuret reac-
tion. J Biol Chem 177, 751–766.
41 Bradford MM (1976) A rapid and sensitive method for
the quantitation of microgram quantities of protein
M. tuberculosis glutamyl–tRNA synthetase S. Paravisi et al.
1416 FEBS Journal 276 (2009) 1398–1417 ª 2009 The Authors Journal compilation ª 2009 FEBS
utilizing the principle of protein–dye binding. Anal Bio-
chem 72, 248–254.
42 Laemmli UK (1970) Cleavage of structural proteins
during the assembly of the head of bacteriophage T4.
Nature 227, 680–685.
43 Matsudaira P (1987) Sequence from picomole quantities
of proteins electroblotted onto polyvinylidene difluoride
membranes. J Biol Chem 262, 10035–10038.
44 Cantor CR & Schimmel PR (1980) Biophysical
Chemistry. Freeman, San Francisco, CA.
45 Segel IH (1975) Enzyme Kinetics. Wiley, New York,
NY.
46 Orr GA & Blanchard JS (1984) High-performance ion-
exchange separation of oxidized and reduced nicotin-
amide adenine dinucleotides. Anal Biochem 142,
232–234.
47 Ogawa T & Okazaki T (1979) RNA-linked nascent
DNA pieces in phage T7-infected Escherichia coli. III.
Detection of intact primer RNA. Nucleic Acids Res 7,
1621–1633.
48 Marini F & Wood RD (2002) A human DNA helicase
homologous to the DNA cross-link sensitivity protein
Mus308. J Biol Chem 277 , 8716–8723.
49 Roessle MW, Klaering R, Ristau U, Robrahn B, Jahn
D, Gehrmann T, Konarev PV, Round A, Fiedler S,
Hermes C et al. (2007) Upgrade of the small-angle
X-ray scattering beamline X33 at the European Molecu-
lar Biology Laboratory, Hamburg. J Appl Crystallogr
40, s190–s194.
50 Svergun DI (1992) Determination of the regularization
parameter in indirect-transform methods using percep-
tual criteria. J Appl Crystallogr 25, 495–503.
Supporting information
The following supplementary material is available:
Fig. S1. Mt-GluRS production and purification.
Fig. S2. tRNA aminoacylation activity of Mt-GluRS.
Fig. S3. Determination of the steady-state kinetic
parameters of the Mt-GluRS reaction.
Fig. S4. Inhibition of Mt-GluRS by GoA and pyro-
phosphate.
Fig. S5. Chromatographic separation of Mt-GluRS
reaction components.
Fig. S6. PP
i
⁄ ATP exchange reaction of Mt-GluRS.
Fig. S7. Alignment of selected GluRS sequences and
identification of the limited chymotryptic cleavage
sites.
Fig. S8. Analysis of the kinetics of proteolysis of
Mt- and Ec-GluRS.
Fig. S9. Minimal models of the proteolytic events lead-
ing to fragments M1–M5 of Mt-GluRS and E1-E3 of
Ec-GluRS.
Fig. S10. DLS analysis of GluRS aggregation state.
Fig. S11. Spectral properties of Mt-GluTR isolated by
using immobilized His
6
–GluRS and aggregation state.
Table S1. Alternate substrates and inhibitors of Mt-
GluRS: l-Glu, l-Gln and 2-oxoglutarate.
Table S2. Alternate substrates and inhibitors of Mt-
GluRS: ATP, AMP, pyrophosphate and their analogs.
Table S3. Effect of metal ions on the Mt-GluRS
activity.
Table S4. Testing the toxicity of Mt-GluRS in E. coli
BL21(DE3) cells.
Table S5. Summary of the properties of the fragments
obtained during limited chymotryptic cleavage of
Mt- and Ec-GluRS as deduced from the gels shown
in Fig. 5, main text.
Table S6. Summary of molecular parameters deduced
by SAXS.
This supplementary material can be found in the
online version of this article.
Please note: Wiley-Blackwell is not responsible for
the content or functionality of any supplementary
materials supplied by the authors. Any queries (other
than missing material) should be directed to the corre-
sponding author for the article.
S. Paravisi et al. M. tuberculosis glutamyl–tRNA synthetase
FEBS Journal 276 (2009) 1398–1417 ª 2009 The Authors Journal compilation ª 2009 FEBS 1417