Báo cáo khoa học: Fluorescence studies of the replication initiator protein RepA in complex with operator and iteron sequences and free in solution pdf
Bạn đang xem bản rút gọn của tài liệu. Xem và tải ngay bản đầy đủ của tài liệu tại đây (3.68 MB, 15 trang )
Fluorescence studies of the replication initiator protein
RepA in complex with operator and iteron sequences
and free in solution
Rutger E. M. Diederix
1,2
, Cristina Da
´
vila
1,2
, Rafael Giraldo
2
and M. Pilar Lillo
1
1 Departamento de Biofı
´
sica, Instituto de Quı
´
mica Fı
´
sica ‘Rocasolano’, CSIC, Madrid, Spain
2 Departamento de Microbiologı
´
a Molecular, Centro de Investigaciones Biolo
´
gicas, CSIC, Madrid, Spain
RepA is the DNA replication initiator protein of the
Pseudomonas plasmid pPS10. It is representative of a
family of plasmid replication initiators active in many
Gram-negative bacteria, including the initiators from
plasmids such as pSC101, F and R6K [1]. The opera-
tor region preceding the repA gene contains a partially
palindromic sequence (inverted repeat, IR) to which
RepA can bind, which acts as an autogenous repressor
of transcription [2]. The plasmid also carries an origin
of replication, containing a sequence with four conti-
guous tandem repeats (direct repeats, DR; termed
iterons) of the same 6 bp sequence found inverted in
the operator region of RepA. RepA thus has dual
DNA-binding activity: it can bind as a dimer to its
operator region, in which case it functions in trans-
cription repression; and it can bind in a highly cooper-
ative fashion to the four directly repeated iterons, in
which case it functions in replication initiation [3].
Keywords
anisotropy; DNA replication; fluorescence;
hydrodynamics; RepA
Correspondence
M. P. Lillo, Departamento de Biofı
´
sica,
Instituto de Quı
´
mica Fı
´
sica ‘Rocasolano’,
CSIC, Serrano 119, 28006 Madrid, Spain
Fax: +34 91 564 2431
Tel: +34 91 561 9400, ext. 1027
E-mail:
(Received 26 June 2008, revised 8 August
2008, acccepted 5 September 2008)
doi:10.1111/j.1742-4658.2008.06669.x
RepA, the replication initiator protein from the Pseudomonas plasmid
pPS10, regulates plasmid replication and copy number. It is capable of
autorepression, in which case it binds as a dimer to the inverted repeat oper-
ator sequence preceding its own gene. RepA initiates plasmid replication by
binding as a monomer to a series of four adjacent iterons, which contain the
same half-repeat as found in the operator sequence. RepA contains two
domains, one of which binds specifically to the half-repeat. The other is the
dimerization domain, which is involved in protein–protein interactions in
the dimeric RepA–operon complex, but which actually binds DNA in the
monomeric RepA–iteron complex. Here, detailed fluorescence studies on
RepA and an N-(iodoacetyl)aminoethyl-8-naphthylamine-1-sulfonic acid-
labeled single-cysteine mutant of RepA (Cys160) are described. Using time-
resolved fluorescence depolarization measurements, the global rotational
correlation times of RepA free in solution and bound to the operator and to
two distinct iteron dsDNA oligonucleotides were determined. These provide
indications that, in addition to the monomeric RepA–iteron complex, a
stable dimeric RepA–iteron complex can also exist. Further, Fo
¨
rster reso-
nance energy transfer between Trp94, located in the dimerization domain,
and N-(iodoacetyl)aminoethyl-8-naphthylamine-1-sulfonic acid-Cys160,
located on the DNA-binding domain, is observed and used to estimate the
distance between the two fluorophores. This distance may serve as an indica-
tor of the orientation between both domains in the unbound protein and
RepA bound to the various cognate DNA sequences. No major change in
distance is observed and this is taken as evidence for little to no re-orienta-
tion of both domains upon complex formation.
Abbreviations
(I)AEDANS, N-(iodoacetyl)aminoethyl-8-naphthylamine-1-sulfonic acid; FRET, Fo
¨
rster resonance energy transfer.
FEBS Journal 275 (2008) 5393–5407 ª 2008 The Authors Journal compilation ª 2008 FEBS 5393
Interestingly, in the latter case, the protein binds as
a monomer [2–6].
Free in solution, the protein is essentially dimeric,
but it dissociates and binds as a monomer in the pres-
ence of even a single iteron sequence [2,3]. The mecha-
nism by which this occurs is unclear, but it involves
considerable conformational changes in RepA [3,4]
judged by comparison of crystal structures of (trun-
cated) RepA dimer [5] and the monomeric RepA–
iteron complex that was modeled on the complex
structure of the close homolog RepE from the F plas-
mid [2,7–9]. For the latter protein, the crystal struc-
tures of both the monomer–iteron and dimer–operator
complexes are available, indicating secondary struc-
tural changes in the linker connecting the dimerization
and DNA-binding domains, and rearrangement of the
relative orientation of the two domains [7,9]. The con-
formational change upon iteron binding may expose a
recognition site for protein–protein interaction,
enabling coupling of recently replicated origins from
different plasmid molecules [10,11]. This so-called
handcuffing is thought to be the mechanism for repli-
cation inhibition in iteron-containing plasmids [12].
Following our series of biophysical studies of RepA
[3–6], we report hydrodynamic and structural studies
on RepA and its complexes with operator and
single iteron sequences. Global rotational correlation
times were determined by fluorescence anisotropy
decay experiments using the extrinsic fluorophore
N-(iodoacetyl)aminoe thyl-8-naphthylamine-1-sul fonic
acid (AEDANS), specifically coupled to Cys160 in the
single-cysteine mutant C160–RepA. The AEDANS
probe was also used as a Fo
¨
rster resonance energy
transfer (FRET) acceptor to monitor putative interdo-
main movements in RepA upon binding the various
DNA sequences. We show that, despite the extensive
structural rearrangement that is known to occur upon
monomerization and DNA binding to the iteron
sequence [3–6], an appreciable change in the inter-
domain organization is not actually observed. Finally,
it appears that monomerization does not occur effi-
ciently in very short oligonucleotides that contain few
bases more than the iteron sequence, and RepA binds
as a dimer instead.
Results
Labeling and characterization of C160–RepA
C160–RepA is a double-mutant of His
6
-tagged wild-
type RepA [4] in which two wild-type Cys residues
(C29 and C106) have been changed to Ser. The single
remaining Cys160 is located on the C-terminal DNA-
binding domain of RepA, also called the WH2
domain, which specifically recognizes the operator and
iteron sequences [1,2]. Most C160–RepA is expressed
in inclusion bodies, and the His
6
-tagged protein was
purified from solubilized inclusion bodies using Ni(II)-
affinity chromatography under denaturing conditions.
As shown previously [3,4], the His
6
-tag does not inter-
fere with protein function or structure, and it was not
removed after purification. Refolding of C160–RepA is
by rapid 20-fold dilution in buffer (0.15 m (NH
4
)
2
SO
4
,
15 mm Na-acetate, 0.03 mm EDTA, 3% glycerol,
pH 6.0). Almost all the protein is recovered and is
present as a single, soluble species. Refolded C160–
RepA is dimeric, as judged by size-exclusion chromato-
graphy, where it elutes at exactly the same volume as
wild-type RepA (not shown).
Labeling of the single Cys of native C160–RepA
with IAEDANS gives very low yields (< 5%). The
yield can be improved significantly (to 50%) by per-
forming the labeling reaction under conditions where
the protein is unfolded, i.e. in the presence of 5.6 m
guanidinium hydrochloride. Presumably, this poor
reactivity is related to the low solubility of the native
protein (up to 10–20 lm). Under denaturing condi-
tions, RepA can easily be concentrated 10- to 100-fold,
thus favoring the bimolecular labeling reaction greatly
under the conditions of $ 15-fold excess IAEDANS.
The CD spectrum of unlabeled or AEDANS-labeled
C160–RepA is indistinguishable from that of wild-type
RepA at 5 °C (Fig. 1A), indicating that the secondary
structure is not affected by the mutation or by
AEDANS labeling. Thermal denaturation analysis of
the protein variants suggests a lower stability of the
mutant (Fig. 1B). The C160–RepA variants show a
lower melting temperature than wild-type RepA (60
versus 67 °C for wild-type RepA), and the thermal
transition of unlabeled C160–RepA has a substantially
lower slope (reduced co-operativity) than wild-type
RepA and the labeled variant. However, room temper-
ature is well below the melting transition, and as the
experiments described here have been performed at or
below this temperature, it can safely be assumed that
the mutant protein is fully folded. This is supported by
the observation that the fluorescence emission spec-
trum of the unique Trp residue (W94), a sensitive indi-
cator of the folding state of the dimerization domain
of RepA [4], is unchanged in the mutant with
respect to that of wild-type RepA (Fig. 1C). Finally,
AEDANS C160–RepA and wild-type RepA show
identical binding to the operator sequence (Fig. 1D),
confirming that mutation and labeling do not affect
the function, and by implication therefore also the
structure, of RepA.
Fluorescence studies of RepA R. E. M. Diederix et al.
5394 FEBS Journal 275 (2008) 5393–5407 ª 2008 The Authors Journal compilation ª 2008 FEBS
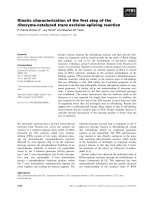
Figure 2A shows the emission spectrum of AEDANS
C160–RepA excited at 295 and 375 nm, respectively.
When excited at 295 nm, fluorescence contributions
from both AEDANS and W94 are visible. Figure 2B
shows the excitation spectrum of the acceptor
(k
em
= 480 nm). There is a clear contribution from
W94 visible as a shoulder at 280–290 nm, which is
assignable to FRET from W94 to C160-AEDANS.
A
B
Fig. 2. (A) Fluorescence emission spectra of AEDANS-labeled
C160–RepA, excited at 295 nm (solid line) and 375 nm (dashed
line). The spectra are normalized with respect to the emission
intensity at 484 nm. (B) Excitation spectrum of AEDANS C160–
RepA, measured at 480 nm. The arrow indicates the contribution of
Trp fluorescence. The spectra were recorded at 23.5 °C, in 0.15
M
(NH
4
)
2
SO
4
,15mM NH
4
-acetate, 0.03 mM EDTA, 3% glycerol;
pH 6.0. [RepA] was $ 2 l
M.
A
B
C
D
Fig. 1. (A) Near- and far-UV CD spectra of wild-type RepA (solid
line) and C160–RepA both unlabeled (dashed line) and AEDANS-
labeled (dash-dots). The spectra were recorded at 5 °C with
$ 3.5 l
M wild-type and unlabeled C160–RepA, and 7 lM AEDANS
C160–RepA. The buffer spectrum is subtracted and the spectra
have been transformed to mean residual ellipticity units. (B) Ther-
mal denaturation curves for wild-type RepA (solid lines) and C160–
RepA unlabeled (dashed line) and AEDANS-labeled (dash-dots). The
temperature dependence of the ellipticity at 220 nm is shown, nor-
malized to help compare the different proteins. (C) Fluorescence
emission spectra (k
ex
= 295 nm) of wild-type RepA (solid line),
C160–RepA both unlabeled (dashed line) and AEDANS labeled
(dash-dots), recorded at 23.5 °C with $ 2 l
M protein and with
intensities normalized with respect to their emission maximum at
327 nm. (D) Binding of wild-type RepA (
) and AEDANS C160–
RepA (s) to 10 nm Alexa568-labeled 1IR, monitored by Alexa568
fluorescence anisotropy (k
ex
= 535 nm, k
em
= 605 nm). Data for
both proteins were fitted (see Eqns 3 and 5) together (solid line) to
a 2 : 1 RepA : 1IR binding equilibrium using the quadratic equation.
This yielded K
d
=5±2nm, compatible with previous reports [3].
Experiments were carried out in 0.15
M (NH
4
)
2
SO
4
,15mM NH
4
-
acetate, 0.03 m
M EDTA, 3% glycerol; pH 6.0.
R. E. M. Diederix et al. Fluorescence studies of RepA
FEBS Journal 275 (2008) 5393–5407 ª 2008 The Authors Journal compilation ª 2008 FEBS 5395
Binding of C160–RepA to operator and iteron
sequences followed by AEDANS fluorescence
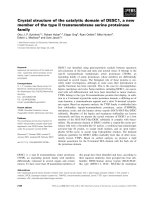
The fluorescence of AEDANS–C160 was studied as a
function of DNA concentration for the operator and
two distinct iteron sequences (described in Table 1).
RepA binding to 1IR and 1DR has been studied in
detail previously [3,6]. When increasing amounts of
1IR, 1DR or 1DR-short are added to AEDANS
C160–RepA, no effect is seen on the shape or intensity
of the ‘pure’ AEDANS fluorescence, i.e. the emission
spectrum excited at 375 nm (not shown). There is,
however, a clear increase in the fluorescence anisotropy
for each of the sequences (Fig. 3D–F), indicating a
decrease in the rotational mobility of AEDANS C160–
RepA. The anisotropy increase is slightly different for
each of the three sequences, and relates to an increased
global rotational correlation time for the AEDANS
probe caused by C160–RepA binding to DNA (see
below). Addition of DNA also induces a change in the
shape of the excitation spectra. This is caused by a
decrease in the Trp contribution to AEDANS fluores-
cence, as illustrated by the difference spectra between
free and bound RepA, which are typical of Trp
(Fig. 3A–C).
The increase in directly excited AEDANS anisotropy
matches very well with the decrease in W94 contribu-
tion to AEDANS fluorescence for each of the three
Table 1. Sequence of the oligonucleotides used in this study. IR (operator, half sites in bold), 1DR (single iteron underlined, with the half
site also present in the operator in bold, purported DnaA box dashed underlined), 1DR-short (single iteron underlined, with the half site also
present in the operator in bold).
Name Length (bp) Sequence
1IR 39 GAACAAGGACAGGGCATTGACTTGTCCCTGTCCCTTAAT
1DR 45 ATACCC
GGGTTTAAAGGGGACAGATTCAGGCTGTTATCCACACCC
1DR-short 30 GCCC
GGGTTTAAAGGGGACAGATTCAGGCC
A D
B E
C F
Fig. 3. Excitation spectra (k
em
= 480 nm) of
AEDANS C160–RepA with increasing con-
centrations of 1IR, 1DR and 1DR-short (A, B
and C, respectively), causing changes in the
direction of the arrows. The spectra are
inner filter corrected and normalized to the
intensity at 340 nm. Difference spectra
between free and DNA-bound RepA are
shown as dashed lines. RepA was 1.25 l
M
and 0, 0.2, 0.4, 0.6 and 1 lM 1IR (A), 0, 0.4,
1.2, 2.4 and 4 l
M 1DR (B), and 0, 0.8, 1.8,
3.2 and 6 l
M 1DR-short (C). (D) Fluores-
cence intensity (k
ex
= 280 nm,
k
em
= 480 nm), corrected and normalized as
in (A) (
), and AEDANS fluorescence anisot-
ropy (k
ex
= 375 nm, k
em
= 480 nm) of
AEDANS C160–RepA as a function of [1IR]
(s). Data were fit using the quadratic bind-
ing equation (see Eqns 3–4). (E) and (F) as
(D), except they refer to titrations with 1DR
and 1DR-short, respectively. Experiments
were performed at 23.5 °C, in 0.15
M
(NH
4
)
2
SO
4
,15mM NH
4
-acetate, 0.03 mM
EDTA, 3% glycerol, pH 6.0.
Fluorescence studies of RepA R. E. M. Diederix et al.
5396 FEBS Journal 275 (2008) 5393–5407 ª 2008 The Authors Journal compilation ª 2008 FEBS
tested oligonucleotides (Fig. 3D–F). The change in flu-
orescence and anisotropy were fit simultaneously for
each titration. In the fits, the protein concentration
was left free, to serve as an indicator of stoichiometry.
In the case of 1IR, the fit resulted in a binding stoichi-
ometry of 2 : 1, i.e. dimer binding. The reactant con-
centrations were too high to obtain relevant
information on the binding affinity. For binding to
1DR, the best fit yielded a binding stoichiometry of
$ 1 : 1, i.e. monomer binding, with a K
d
between 0.2
and 0.6 lm. With 1DR-short, a reliable estimate for
the stoichiometry of binding could not be made.
Assuming binding as monomer or as dimer, respec-
tively, the dissociation constants obtained were
2.1 ± 0.2 and 2.9 ± 0.2 lm, without an apparent dif-
ference in goodness of fit. However, in a separate
experiment involving inter-monomeric homoFRET
(see below) the binding stoichiometry was confirmed as
dimeric RepA to the 1IR and IDR-short sequences,
and monomeric RepA to 1DR. The binding affinity
under these conditions is thus 2.9 lm.
FRET between Trp94 and the AEDANS
As mentioned above, DNA binding induces an appar-
ent decrease in FRET efficiency between W94 and
AEDANS–C160. Along with this decrease, there is
also a considerable degree of quenching of W94 fluo-
rescence. This residue has a relatively high quantum
yield for Trp [13] that is strongly quenched upon bind-
ing to its cognate DNA sequences (see Table 2). This
quenching is unrelated to FRET, as it also occurs with
unlabeled RepA. Furthermore, it does not decrease the
lifetime of W94 fluorescence significantly (see Table S1),
indicating that it is static in nature. We do not have
an unequivocal interpretation of the origin of the static
quenching. However, judging from the binding stoichi-
ometry together with the shape of the binding curves
(Fig. 3), it is safe to conclude that the quenching does
not affect the RepA–DNA binding equilibria, and thus
that dark state(s) of W94 are present in the RepA–
DNA complexes. Because the fraction of non-fluores-
cent donor molecules does not contribute to the
Trp fi AEDANS energy transfer process, a correc-
tion of the FRET efficiencies for the presence of non-
fluorescent W94 is required (see Eqn 1, Experimental
procedures). After doing so, it appears that the differ-
ence in FRET efficiency between free RepA and its
DNA complexes is actually relatively minor (see
Table 2). Accordingly, the resulting distance calculated
between W94 and AEDANS–C160 does not display
large variations between the different species.
However, there are a number of caveats that should
be taken into account. First, there are several tyrosine
residues in RepA. As the fluorescence was excited at
280 nm, there is the possibility that some of the five
tyrosines present in the W94-containing N-terminal
domain of RepA also contribute to the experimental
FRET efficiency, by Tyr fi Trp energy transfer. As
the distance between W94 and the nearest Tyr residue
is $ 15 A
˚
[5], this contribution is negligible, however.
This conclusion is well supported by the apparent lack
of contribution of Tyr to the excitation spectrum of
acceptor AEDANS indicated in the excitation differ-
ence spectra seen in Fig. 3A–C. Second, the Fo
¨
rster
and donor-acceptor distances determined here, relate
to the R
0
value determined assuming hj
2
i =2⁄ 3,
R
0
(
2
/
3
) (see Experimental procedures). This value was
calculated to be 25 ± 1 A
˚
. The value of hj
2
i is not
known exactly, leading to additional uncertainty. The
maximum and minimum limits of the value of hj
2
i for
the W94 ⁄ AEDANS–C160 couple in RepA were esti-
mated as described previously [14,15], from the depo-
larization factors determined from time-resolved
fluorescence anisotropy recorded for wild-type RepA
W94 and AEDANS C160–RepA (see below, and
Table S1). It appears that the factor hj
2
i for RepA–
DNA complexes would have a value between 0.06 and
3.51, which in turn yields an uncertainty in the abso-
lute distance between 0.7 and 1.3 times the value of
R(
2
/
3
), presented in Table 2.
Nevertheless, the R(
2
/
3
) value in the complex with
1DR is in excellent agreement with the distance mea-
sured between the C
b
atoms of both residues in the
structural model of RepA [2] based on the monomer–
iteron complex structure of the homologous RepE pro-
tein [7]. W94 and C160 are each located on one of the
Table 2. Fluorescence and FRET parameters of the W94–
AEDANS–C160 pair and resulting average inter-probe distances, in
free RepA and RepA bound to various cognate DNA sequences.
FRET efficiency was determined using Eqn (1), and assuming
e
W 94
280 nm
e
AEDANS
340 nm
= 1 and e
AEDANS
280 nm
e
AEDANS
340 nm
= 0.17 (see Experimental
procedures). The apparent quantum yield of W94 (F
W94
) was deter-
mined both for wild-type RepA and unlabeled C160–RepA. The
degree of quenching, i.e. the ratio of F
W94
in free and DNA-bound
RepA was used to determine the fraction of fluorescent donor
(d
+
in Eqn 1).
Species
F
W94
(± 0.02)
d
+
(± 0.08)
FRET efficiency
(± 0.15)
R(
2
/
3
)(A
˚
)
(± 7)
b
free RepA 0.29 1.00 0.7 22
+ 1IR 0.14 0.48 0.8 20
+ 1DR 0.21 0.72 0.6 23
+ 1DR-short 0.16
a
0.55
a
0.8
a
20
a
Values based on extrapolations from binding curves and as such
not experimentally confirmed.
b
Using R
0
(
2
/
3
) = 25 ± 1 A
˚
.
R. E. M. Diederix et al. Fluorescence studies of RepA
FEBS Journal 275 (2008) 5393–5407 ª 2008 The Authors Journal compilation ª 2008 FEBS 5397
two different domains of RepA, and therefore changes
in distance between both residues can be interpreted in
terms of domain movements. Because no relevant
change is observed, it can be concluded that no signifi-
cant reorientation takes place between the two domains
of RepA upon binding to the operator or iteron DNA
or as a result of the monomerization of RepA that
accompanies binding to 1DR. We can not currently
exclude a rotation centered about C160, as this will also
not affect the distance between both residues. Also,
note that, in theory, inter-monomeric FRET may occur
in the case of RepA dimers. This is unlikely however,
considering the distance between both W94 residues
($ 20 A
˚
) and that both DNA binding domains con-
taining the AEDANS probes are located roughly on
opposing ends of the dimerization domains [5].
Time-resolved fluorescence depolarization and
rotational correlation times of RepA and its DNA
complexes
Time-resolved depolarization measurements were per-
formed to obtain information on global and local
dynamics of the AEDANS and W94 probes in free
and DNA-bound RepA. The decay of the total fluores-
cence intensity was recorded, as well as the decays of
its vertically and horizontally polarized components.
The anisotropy decay of the fluorophore can be
described in terms of its slow and fast components, i.e.
of global and local re-orientational motions, respec-
tively. This was carried out for both W94 in wild-type
RepA and AEDANS-labeled C160–RepA. AEDANS
has a much longer fluorescence lifetime than Trp,
allowing a much greater level of confidence in the
determination of correlation times pertaining to the
global rotational motion. Nevertheless, the global rota-
tional information obtained from Trp fluorescence
anisotropy decays (see Fig. S1 and Table S1) shows a
trend in agreement with the data from the AEDANS
experiments. Furthermore, despite the relatively poor
photon-counting statistics, the local dynamics of W94
have been characterized from the Trp decays. In
Fig. 4, anisotropy decays (k
em
= 480 nm) are shown
for the different AEDANS C160–RepA species,
together with best fits assuming a bi-exponential
function for r(t) (see Experimental procedures). The
A
B
C D
Fig. 4. Anisotropy decays R(t)
(k
ex
= 375 nm, k
em
= 480 nm) of AEDANS
C160–RepA free in solution (A) and bound
to 1IR (B), 1DR (C) and 1DR-short (D).
Experiments were performed at 23.5 °Cin
0.15
M (NH
4
)
2
SO
4
,15mM NH
4
-acetate,
0.03 m
M EDTA, 3% glycerol, pH 6.0. Experi-
mental data (s) were reconstructed from
the fluorescence decays that were polarized
parallel and perpendicular to the polarization
plane of the excitation beam, after subtract-
ing their respective dark counts. Fits to the
data are shown as solid gray lines. AEDANS
C160–RepA was $ 2 l
M in each experiment
and with 2.5 l
M 1IR, 8 lM 1DR and 12 lM
1DR-short, respectively. Weighted residuals
for the fits between experimental and calcu-
lated R(t) are shown below the curves.
Fluorescence studies of RepA R. E. M. Diederix et al.
5398 FEBS Journal 275 (2008) 5393–5407 ª 2008 The Authors Journal compilation ª 2008 FEBS
analogous decays with k
em
= 530 nm, with corre-
sponding best fits and tabulated parameters, are sup-
plied in Fig. S2 and Table S1.
The AEDANS data confirm the presence of discrete
complexes under the conditions of the experiment,
and that binding is complete, in agreement with the
binding curves (Fig. 3), except for the case of the
complex with 1DR-short, which under these condi-
tions should contain $ 20% free RepA. As expected,
the global rotational correlation time, /
2
, increases
upon binding of RepA to its cognate DNA. Apart
from the RepA–1DR-short complex, the observed val-
ues easily fall within the range reasonably expected
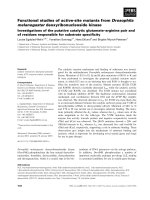
from molecules of this size and shape (Table 3). The
expected values for free RepA and the dimeric RepA–
1IR complex were calculated on basis of hydro-
dynamic shapes and volumes corresponding to prior
[3] sedimentation velocity measurements as shown in
Fig. 5. Both can be characterized as rigid elongated
shapes. For the monomer RepA–1DR complex, the
structure modeled on the homologous mRepE–DNA
crystal structure [7] was used directly to calculate the
expected global rotational correlation time. The calcu-
lated values for the RepA–1DR-short complex pertain
to a monomer, i.e. the modeled structure as above,
but with a truncated oligonucleotide having 30 bp
instead of the 45 bp of 1DR. This purported complex
of monomeric RepA with 1DR-short is not shown,
but it is easily imagined that this complex is quite
spherical and that it should have a relatively short
global rotational correlation time. This is clearly not
what is observed. Note that because the orientation of
the AEDANS probe in the complex is not known, we
provide a range of calculated values, i.e. the minimum
and maximum of the correlation times corresponding
to the complex (see Experimental procedures). Never-
theless, even given this significant uncertainty, the
measured value of the complex with 1DR-short clearly
exceeds the maximum value that was calculated for a
hypothetical complex involving RepA monomer.By
contrast, a correlation time around 100 ns fits well
with a complex involving dimeric RepA and a 30 bp
oligonucleotide. It should further be noted that the
presence of 20% free RepA in the case of the 1DR-
short complex will lead to a slight underestimation of
the rotational correlation time. There appears to be
linear correlation between oligonucleotide size (zero
for free RepA) and experimental correlation time for
the complexes involving dimeric RepA (Table 3). Only
the complex between 1DR and RepA does not fit this
Table 3. Fluorescence lifetimes, time-resolved and steady-state anisotropy parameters for AEDANS–C160 in free RepA and RepA bound to
various cognate DNA sequences.
a
Sample
hr
ss
i
± 0.002
hsi
c
(ns)
± 0.4
b
1
± 0.05
/
1
(ns)
±3
b
2
±0.05
/
2
(ns)
±10
/
2
calc (ns)
(max–min)
Free RepA 0.209 13.1 0.234 4.5 0.766 56 (42–89)
d
+ 1IR 0.239
b
12.2 0.156 2.7 0.844 109 (61–131)
d
+ 1DR 0.237
b
13.4 0.160 4.2 0.840 97 (43–138)
d
+ 1DR-short 0.238
b
13.5 0.150 7.3 0.850 98 (35–59)
e
a
Estimated errors at the 67% confidence level [30].
b
Steady-state anisotropy from fits to the data in Fig. 3.
c
k
ex
= 375 nm, k
em
= 480 nm;
r
0
(from the fits) = 0.31 ± 0.015); T = 23.5 °C.
d
Minimum and maximum calculated rotational correlation times assuming a prolate ellipsoid
shape, and using shape factors from frictional ratios previously [3] determined using sedimentation velocity experiments.
e
Minimum and
maximum calculated rotational correlation times calculated using the
HYDROPRO program [17] using as input homology models of the RepA–
1DR and 1DR-short complexes, respectively, based on the crystal structure [7] of monomeric RepE in complex with iteron DNA.
Fig. 5. Prolate ellipsoids equivalent to (non-hydrated) free RepA
(upper) and RepA–1IR complex (lower), with axial ratio and volumes
corresponding to frictional ratios determined from prior sedimenta-
tion velocity analysis (3) and molecular mass (23) respectively. The
modeled structure of monomeric RepA–1DR is shown in two orien-
tations (center). For clarity, the purported structure of RepA mono-
mer with 1DR-short is not shown. The length of 1DR-short only
allows for five nucleotides (half a helical turn) to protrude from
either end of the protein–DNA interface.
R. E. M. Diederix et al. Fluorescence studies of RepA
FEBS Journal 275 (2008) 5393–5407 ª 2008 The Authors Journal compilation ª 2008 FEBS 5399
correlation, in line with the fact that it is the only
complex involving monomeric RepA.
Finally, we note that the range of global rotational
correlation times calculated for the dimer–operator
complex of the F plasmid RepE protein, which is
highly homologous to RepA and of which the crystal
structure is known [9], is shorter (57–83 nucleotides)
than observed here for the RepA–1IR complex. This
could mean that there are significant differences
between the RepE– and RepA–operator complexes,
which are possibly related to the different spacing
between the half repeats in both operator DNA
sequences [9].
Oligomerization state of free and complexed
RepA determined by homoFRET
In order to understand the oligomerization state of
RepA in the different DNA complexes better, homo-
FRET experiments were carried out. Herein, use is
made of C160–RepA specifically labeled with Atto532.
In a double-labeled sample, FRET is expected to occur
between the two Atto532 moieties whenever the inter-
probe distance is not greater than $ 1.5 times the
Fo
¨
rster distance. The calculated R
0
(
2
/
3
) = 55 A
˚
for
Atto532–Atto532 homoFRET, and thus energy trans-
fer is expected to occur in double-labeled RepA
dimers. Thus, no FRET is expected when RepA is
monomeric, or in single-labeled Atto532–RepA dimers.
HomoFRET between the fluorophores is detected
through depolarization of their emission, but note that
this occurs only if they do not happen to be aligned
more-or-less parallel to each other in the dimer.
C160–RepA samples labeled with 60% Atto532 (i.e.
with 43% of Atto532 residing on double-labeled RepA
dimers) show clearly different excitation anisotropy
spectra from C160–RepA samples labeled with only
10% Atto532, i.e. with very little double-labeled RepA
dimers (< 5%). This is shown in Fig. 6A, where there
is an evident decrease in anisotropy for the sample
containing the double-labeled C160–RepA dimers,
which is less pronounced at longer excitation wave-
lengths (red-edge excitation). The enhanced fluores-
cence depolarization in the double-labeled dimers with
respect to the single-labeled samples is a clear indica-
tion of homoFRET in the double-labeled samples [16].
The increase in steady-state anisotropy observed upon
decreasing the degree of Atto532-labeling from 60% to
10% is also observed when excess 1DR is added to
60% labeled Atto532 C160–RepA, but not upon the
addition of excess 1IR and 1DR-short (Fig. 6B). This
means that addition of 1DR abolishes the homoFRET,
by inducing RepA monomerization. In fact, the addi-
tion of 1IR and 1DR-short causes a small decrease in
anisotropy which may be related to enhanced homo-
FRET caused by slight rearrangement of the mono-
mers in the RepA dimers or by minor aggregation.
Thus, RepA is dimeric free in solution and when
bound to its operator sequence, but also when bound
to 1DR-short. In the presence of excess 1DR, mono-
merization of RepA takes place.
Discussion
One of the striking properties of RepA is that it is able
to recognize two types of DNA sequence, either the
operator – with inverted repeats – or the iteron, in
which the same 6 bp sequence half-site found in the
operator is specifically recognized. Upon binding to
the operator, RepA remains dimeric; it thus retains its
symmetry matching the inverted repeats of the oligo-
nucleotide. When this symmetry is absent, i.e. for the
A
B
Fig. 6. (A) Excitation anisotropy spectra of Atto532–C160 RepA
labeled to different degrees (solid line: 60% label, dashed line:
10%). [RepA] is 0.5 l
M in either case, and conditions are 0.5 M
(NH
4
)
2
SO
4
,50mM NH
4
-acetate pH 6.0, 30 lM EDTA, 10% glycerol,
T =6°C. (B) Average changes in steady state fluorescence anisot-
ropy between 60% Atto532–C160 RepA and, from left to right,
10% Atto532–C160 RepA, 60% Atto532–C160 RepA in the pres-
ence of 2 l
M 1IR, 1–4 lM 1DR-long and 8–16 lM 1DR-short. Condi-
tions: 0.15
M (NH
4
)
2
SO
4
,15mM NH
4
-acetate pH 6.0, 10 lM EDTA,
3% glycerol, T =6°C. In the experiments with DNA,
[RepA] = 15 nm
.
Fluorescence studies of RepA R. E. M. Diederix et al.
5400 FEBS Journal 275 (2008) 5393–5407 ª 2008 The Authors Journal compilation ª 2008 FEBS
iteron sequence, RepA binds as a monomer instead of
a dimer.
When operator or iteron DNA is added to AE-
DANS C160–RepA, discrete complexes are formed
(Fig. 3), characterized by higher AEDANS fluores-
cence anisotropy values and decreased apparent Trp-
AEDANS FRET (see below). RepA binds operator
DNA (1IR) with a clear stoichiometry of 2 : 1, i.e. the
protein binds as a dimer. With the iteron sequence
1DR, which includes an additional stretch of bases
(see Table 1), a stoichiometry of 1 : 1 is found, i.e.
monomer binding. When the number of bases flanking
the iteron sequence is considerably shorter, as with
1DR-short, the binding affinity is significantly
decreased (2.9 lm), and nears that of non-specific
DNA [6]. Still, a discrete complex is formed in this
case, as corroborated by fluorescence anisotropy decay
measurements.
Fluorescence anisotropy decay analysis is a potent
method to obtain information on the local and global
dynamics of species in solution. Here, it is used to
characterize the discrete species discussed above. For
free RepA and RepA in complex with 1IR or 1DR,
experiments were performed with AEDANS. The anal-
ysis, summarized in Table 3, yields global rotational
correlation times for free RepA and the complex with
1IR corresponding to species involving dimeric RepA,
as expected. In the case of the complex with 1DR, a
fair correlation is also found between the experimental
and calculated global rotational correlation times. For
the latter, the hydropro program was employed,
which is able to extract hydrodynamic parameters
using the protein’s atomic co-ordinates [17]. A homo-
logy model based on the RepE–iteron structure was
used as input. Note that the bending angle of the 1DR
as observed by EMSA (52°) is significantly larger than
in the crystal structure (20°) which was used for the
homology model [6,7]. Furthermore, the crystal stru-
cture has a much shorter DNA oligonucleotide than
the 1DR sequence: the latter is $ 3–4 times longer
than the protein itself and may thus form a source of
significant flexibility, difficult to account for in model
building.
However, using the same structure as a basis to
construct a potential complex between 1DR-short and
monomeric RepA is not realistic. The observed global
rotational correlation time for the RepA–1DR-short
complex cannot conceivably be justified assuming a
complex similar to the RepE–iteron complex. How-
ever, the purported dimeric RepA–1DR-short complex
fits very well into the linear correlation between oligo-
nucleotide size and experimental correlation time for
the complexes involving dimeric RepA. The complex
between 1DR and RepA does not fit this correlation,
in line with the fact that it involves monomeric RepA.
It is thus tempting to assume that dimeric RepA is
actually involved in binding the 1DR-short sequence,
despite the fact that it contains the full 22 bp iteron.
This last conclusion is corroborated by the observa-
tion that inter-monomeric homoFRET is observable
with 1DR-short, but not 1DR (Fig. 6). That dimer-
binding to iterons is, in principle, possible has previ-
ously been shown by us. According to EMSAs carried
out under crowded conditions, a fraction of RepA
dimers was observed to bind to the 1DR sequence [6].
This fraction is obviously much larger in the case of
1DR-short, and the extra bases on the longer, mono-
mer-binding, oligonucleotide 1DR seem to play a role
in aiding monomerization. The presence of bases
downstream of the iteron sequence has also previously
been shown to promote binding of Rep to pSC101
[18].
The related replication initiator protein p from R6K
plasmid is a well-documented case where not only
monomers, but also dimers, are known to bind to the
iteron [19]. Interestingly, dimers of p protein occupy a
much shorter stretch of the iteron sequence than do
monomers; whereas almost the entire 22 bp iteron
sequence is occupied by the p monomers, only half of
this – notably including the specific 6 bp recognition
sequence (repeat) – is occupied when dimeric p protein
is bound [19]. This may occur here as well. As there is
only one half of the inverted repeat of the operator
sequence present in 1DR-short, it is likely that only
one of two WH2 DNA-binding domains in RepA
dimers is involved in binding. This also makes sense
energetically, the RepA dimer binds operator DNA
with K
d
= 0.7 nm i.e. DG = )21.2 kJÆmol
)1
[6]. Sub-
tracting from this a penalty of $ 7.8 kJÆmol
)1
for the
DNA bending [20] induced by dimer binding (61°), a
free energy of ()21.2 to 7.8) ⁄ 2=)14.5 kJÆmol
)1
is
expected for binding of a single DNA-binding domain
without the need to force DNA bending. This trans-
lates to K
d
= 1.3 lm, which is reasonably close to the
value of 2.9 lm observed here for 1DR-short.
It is clear that in vitro, the effect of decreased length
of the iteron flanking sequence is to weaken the iteron-
binding affinity of monomeric RepA so that, at high
[RepA], dimer binding occurs. In vivo, this effect may
be comparable in the sense that monomer-binding
affinity is attenuated by the length or identity of the
flanking sequence. It is well established that Rep pro-
tein dimers do not act as initiators in plasmid replica-
tion [21]. A positive effect on monomer-binding
affinity thus provides a way of selecting against
dimer binding, favoring monomer binding and thus
R. E. M. Diederix et al. Fluorescence studies of RepA
FEBS Journal 275 (2008) 5393–5407 ª 2008 The Authors Journal compilation ª 2008 FEBS 5401
initiation. It should be mentioned that the four iterons
in pPS10 are contiguous, thus limiting the degree to
which the flanking sequences may contribute to bind-
ing. In other replicons, however, there are spacer
sequences between the iterons, which in addition may
have some sequence variability [22]. It would be inter-
esting to see whether our findings for RepA can be
extrapolated to other Rep proteins.
An attractive feature of using AEDANS as an
extrinsic label is that, besides its use to analyze the
global rotational correlation times of macromole-
cules, it is useful as a FRET acceptor for intrinsic
Trp residues. RepA fortunately has only one Trp,
making this use of the AEDANS probe more mean-
ingful and helping interpretation of the FRET in
terms of distances between the two fluorophores.
Moreover, W94 and C160 are located on the dimer-
ization and DNA-binding domains of RepA, respec-
tively, allowing us to interpret any observed changes
in FRET in terms of relative movements between
the two domains.
It emerges that the average estimated distance
between the C160–AEDANS and W94 is $ 22 A
˚
in
the free RepA dimer, and this distance decreases by a
few angstroms upon binding either the 1IR, or 1DR-
short oligonucleotides and increases slightly upon
monomerization and binding to 1DR (see Table 2).
The average distance observed in the complex with
1DR is in very good agreement with the value mea-
sured between the C
b
atoms of residues W94 and C160
in the homology model of RepA, supporting the esti-
mated value. It is interesting that within the error, the
distance between the AEDANS and indole moieties
apparently does not change significantly between
unbound RepA and RepA bound to either 1IR (as a
dimer with both DNA-binding domains involved in
binding), or 1DR-short (as a dimer, but presumably
with only one domain involved), or indeed when
bound as a monomer to 1DR. This suggests that bind-
ing to both inverted half-repeats, as in the operator
sequence, does not trigger large conformational rear-
rangements with respect to the free dimeric protein or
to the dimer purportedly bound via one DNA-binding
domain (1DR-short). Although significant structural
rearrangements of RepA occur upon monomerization
[3–5], these do not appear to grossly alter the relative
orientation of the two domains with respect to each
other. Naturally, it should be noted that manifold rela-
tive orientations of the two domains may exist, satisfy-
ing the observed distance, but which are still
significantly different. We are currently working
towards a more comprehensive understanding of inter-
domain orientations using FRET.
Experimental procedures
Cloning, expression and purification of wild-type
RepA and C160–RepA
In all cases, the concentration of protein is expressed in
monomer units. What is referred to as wild-type RepA is the
His
6
-tagged variant of RepA, which was expressed and
purified as described previously [4]. This protein is indistin-
guishable from that without His-tag, except that it has a
higher solubility [3,4]. It was therefore used without sub-
sequent removal of the tag. C160–RepA also has the
His
6
-tag and is a single-cysteine variant of wild-type RepA
in which two of the three wild-type Cys residues (C29, C106)
have been successively replaced by Ser using the PCR-based
QuickChange Kit (Stratagene, Cedar Creek, CA, USA).
Mutations were verified by sequencing. C160–RepA was
expressed as wild-type RepA [4] but almost all C160–RepA
was present in the form of insoluble aggregates. The protein
was isolated by solubilization of the inclusion bodies and
purification by Ni(II)-affinity chromatography under dena-
turing conditions, similarly as described previously [4]. This
results in pure protein, exhibiting a single band on
SDS ⁄ PAGE. After purification, the protein was reduced by
addition of 2 mm 2-mercaptoethanol and exchanged to
unfolding buffer (5.6 m guanidinium hydrochloride, 0.56 m
(NH
4
)
2
SO
4
, 0.2 m NH
4
-acetate, 0.2 mm EDTA, 1.2%
Chaps, pH 6.0). Immediate refolding is achieved by fast
20-fold dilution in 0.15 m (NH
4
)
2
SO
4
,15mm NH
4
-acetate,
0.03 mm EDTA, 3% glycerol, pH 6.0. A small amount of
precipitate generated by the refolding procedure was spun
down at 14 000 g for 20 min. The latter buffer was used both
for storage ()80 °C) and experiments.
Protein labeling
C160–RepA was labeled with IAEDANS (Molecular
Probes, Leiden, The Netherlands) under denaturing condi-
tions, as follows. C160–RepA was concentrated to
$ 150 lm in unfolding buffer by ultrafiltration (10 kDa
cut-off). A small amount of 1 m Tris ⁄ HCl (pH 8.5) was
added to increase the pH to 7.2, and Tris(2-carboxyethyl)
phosphine to keep the single Cys reduced (1 mm). The end
volume was 1.6 mL. IAEDANS was dissolved (40 mm) in
unfolding buffer and quickly mixed with the reduced pro-
tein to a final concentration of 2 mm. The reaction was
allowed to proceed for 2 h at room temperature, and then
12.3 mg of glutathione was added to quench the reaction.
The reaction mixture was exchanged for fresh unfolding
buffer by extensive ultrafiltration. The labeling efficiency
was close to 50%, as judged from UV ⁄ Vis spectroscopy.
AEDANS C160–RepA was refolded in the same way as
unlabeled RepA. Similarly, C160–RepA was labeled with
maleimide Atto532 (Atto-Tec, Siegen, Germany), with 60%
labeling efficiency. Here, the degree of labeling in the folded
Fluorescence studies of RepA R. E. M. Diederix et al.
5402 FEBS Journal 275 (2008) 5393–5407 ª 2008 The Authors Journal compilation ª 2008 FEBS
protein was important and varied from 60% to 10% by
mixing the appropriate amounts of Atto532-labeled and
unlabeled C160RepA before refolding. Correct refolding
of Atto532 C160RepA was conrmed by determining its
binding efciency and stoichiometry to Alexa647-labeled
1IR, using FRET (not shown).
DNA purication and labeling
1DR (Table 1) was prepared as described previously [36].
The 1IR and 1DR-short duplexes were prepared by anneal-
ing their constituent complementary strands (Sigma-Geno-
sys, Cambridge, UK) in equimolar amounts. The duplexes
were puried using a MA7 column (BioRad, Hercules, CA,
USA) followed by desalting using C
18
Sep-PaK columns
(Waters, Milford, MA, USA). Also, 5Â-amine modied vari-
ants of the 1IR and 1DR-short oligonucleotides were rst
reacted with NHS-Alexa568 and Alexa647 (Molecular
Probes) respectively, according to the manufacturers
instructions. Unreacted Alexa568 or Alexa647, and DNA,
were removed by chromatography (MA7), and the oligo-
nucleotides were subsequently annealed with their comple-
mentary strands, and puried as above.
UV
Vis and CD spectroscopy
CD spectra and melting curves of wild-type RepA and
AEDANS-labeled, as well as unlabeled, C160RepA were
recorded as described elsewhere [3]. Protein concentrations
were 2.55 lm, and the optical path length was 0.1 cm.
Room temperature UV Vis spectra were recorded using a
Cary 3E UV Vis spectrophotometer with 1 cm path-length
cuvettes.
Size-exclusion chromatography
Gel-ltration assays were performed at room temperature,
with a Superdex HR 10 30 column (Amersham Biosciences,
Freiburg, Germany). Sample volumes were 50 lL and pro-
tein concentrations $ 4 lm.
Steady-state uorescence spectroscopy
Fluorescence measurements were performed with an ISS PC1
or an SLM 8000D photon counting spectrouorimeter at 6
or 23.5 C using 3 ã 3 mm path-length quartz cuvettes (Star-
na, Hainault, UK). Spectra were recorded using magic angle
conditions (Glan-Taylor polarizers, excitation polarizer verti-
cal, emission polarizer 54.7 to vertical). Bandwidths were
4 nm (excitation) and 10 nm (emission). Steady-state emis-
sion anisotropies of uorescent probes were measured using
Glan-Taylor polarizers, as described previously [6].
For AEDANS C160RepA, FRET between the single
Trp residue, (W94, the donor) and AEDANS (the acceptor)
was quantied by the (ratio)
A
approach [23,24] using excita-
tion spectra measured at an emission wavelength where
W94 uorescence does not contribute (480 nm). This per-
mits several simplications, among them disregard of uncer-
tainties in the degree of labeling. Because of signicant
static quenching of the W94 donor upon complex forma-
tion, a correction was necessary to account for the fraction
(d
+
) of uorescent donor remaining. The FRET efciency
was calculated as follows:
E ẳ
1
d
ỵ
F
280 nm
F
340 nm
e
AEDANS
280 nm
e
AEDANS
340 nm
e
AEDANS
340 nm
e
W94
280 nm
1ị
The AEDANS uorescence intensity for 340 nm excita-
tion (F
340 nm
) arises from direct excitation of the acceptor.
It is independent of FRET and depends only on the accep-
tor concentration. The extinction coefcients of W94 [25]
and AEDANS [26] are assumed constant as a function of
labeling and or protein complexation state. Because of rela-
tively low signal intensity for 295 nm excitation caused by
the poor solubility of RepA, we measured it for 280 nm
excitation instead. The disadvantage of this is that Tyr
absorbs at 280 nm, and thus may, in principle, contribute
to the measured intensities. This would occur, because no
Tyr emission is observed, via FRET to W94 followed by
W94 AEDANS energy transfer. The FRET efciencies
determined using Eqn (1) thus strictly represent an upper
limit for the W94 AEDANS process. However, the
closest TyrW94 distance is $ 15 A
, based on the crystal
structure [5], and thus any contribution of Tyr was not
taken into account in the efciency calculations. The W94
uorescence decay could be analyzed assuming three dis-
crete lifetime components with $ 80% of the uorescence
from one of these species (s $ 4 ns) (see below and
Table S1). The decay can thus be approximated as mono-
exponential, allowing use of simple FRET theory.
The Fo
ă
rster radius, R
0
,inA
, for the W94AEDANS
pair was calculated as follows:
R
0
ẳ 0:211n
4
U
D
j
2
Jị
1=6
2ị
Here, n is the refractive index, with a value of 1.4. The
orientation factor j
2
depends on the relative orientation of
the donor emission and acceptor absorption transition
moments with respect to the donoracceptor vector. As a
rst approximation, a value of 2 3 for j
2
was taken in this
work, equivalent to assuming rapid isotropic averaging [27].
J is the overlap integral between Trp emission and
AEDANS absorbance spectra (expressed as nm
4ặ
m
)1
cm
)1
).
F
D
is the uorescence quantum yield of W94 (F
W94
). This
was determined for unlabeled C160RepA by calibration
with a NATA solution in 10 mm sodium phosphate,
pH 7.0, using F
NATA
= 0.14 [28]. The apparent value for
F
W94
in the various DNA complexes was derived from the
value of free RepA by comparing the uorescence intensity
R. E. M. Diederix et al. Fluorescence studies of RepA
FEBS Journal 275 (2008) 53935407 ê 2008 The Authors Journal compilation ê 2008 FEBS 5403
(k
ex
= 295 nm) of free and bound unlabeled C160–RepA
and wild-type RepA, with the protein concentration con-
stant. The ratio of the apparent F
W94
of bound and free
RepA was then used to estimate the fraction of fluorescent
donor remaining upon DNA complexation (d
+
in Eqn 1).
For the R
0
calculation we used the quantum yield deter-
mined for free C160–RepA (see above).
Titrations were performed with increasing amounts of
DNA added to AEDANS C160–RepA, or with increasing
amounts of wild-type RepA or unlabeled C160–RepA
added to Alexa568–1IR. Fresh solutions were prepared for
each data point, and equilibrated 10 min before measuring.
Binding curves were fit to the quadratic expression given in
Eqn (3) for the amount of RepA–DNA complex, with
[RepA] divided by the expected stoichiometry n. The
amount of bound protein or DNA is related to the instru-
ment signal (AEDANS C160–RepA anisotropy and the flu-
orescence intensity ratio for excitation at 280 and 340 nm
F
280 nm
⁄ F
340 nm
) via the corresponding signals S
bound
and
S
free
(Eqn 4) or the equivalent for bound and free
Alexa568–1IR (Eqn 5).
RepA À DNA½
¼ 0:5 c À
ffiffiffiffiffiffiffiffiffiffiffiffiffiffiffiffiffiffiffiffiffiffiffiffiffiffiffiffiffiffiffiffiffiffiffiffiffiffiffiffiffiffiffiffiffiffiffiffiffiffiffiffiffiffiffiffiffiffiffiffiffiffiffiffiffiffiffiffiffiffiffiffi
c
2
À 4 Â RepA½
T
n
 DNA½
T
q
ð3aÞ
c ¼ K
d
þ RepA½
T
n
þ DNA½
T
ð3bÞ
signal
AEDANS
¼
RepA À DNA½
RepA½
T
n
!
S
bound
þ 1 À
RepA À DNA½
RepA½
T
n
!
S
free
ð4Þ
signal
Alexa568
¼
RepA À DNA½
DNA½
T
S
bound
þ 1 À
RepA À DNA½
DNA½
T
S
free
ð5Þ
The Fo
¨
rster distance R
0
(
2
/
3
) for Atto532–Atto532 homo-
FRET was calculated using Eqn (2), with F
D
(F
Atto532
)=
0.9 and calculating the overlap integral between Atto532
emission and excitation using spectral data provided by the
manufacturer.
Time-resolved fluorescence spectroscopy
Time-resolved fluorescence intensity and depolarization
measurements were made using the time-correlated single-
photon counting technique, using the set-up described pre-
viously [29]. For Trp fluorescence depolarization measure-
ments (k
ex
= 297 nm, k
em
= 345 nm), the excitation light
source was a Ti : sapphire picosecond laser (Tsunami, Spec-
tra Physics, Mountain View, CA, USA), pumped with a
5 W Nd : YVO
4
diode laser (Millennia, Spectra Physics),
and associated with a third harmonic generator. The pulses
had 1–2 ps width and a repetition rate of 0.8–4 MHz, with
an average power of 20 lW reaching the cuvette. The tem-
perature of the sample was thermostated at 5 °C for
increased sample stability, required because of long acquisi-
tion times. The timing calibration was 6.1 ps per channel,
with 4096 data channels. Typical polarized decay curves
had $ 4000–10 000 counts in the peak (1–2 · 10
6
total pho-
tons). The quality of photon counting statistics in the Trp
experiments was limited by the sample stability. For
AEDANS measurements (T = 23.5 °C; k
ex
= 375 nm,
k
em
= 480 and 530 nm), the excitation light source was an
LDH-P-C-375 diode laser head (PicoQuant, Berlin, Ger-
many), operating at 375 nm with a 5 MHz repetition rate,
with on average 75 lW power reaching the cuvette. The flu-
orescence was collected in the plane perpendicular to the
vertical orientation of the linearly polarized excitation, and
at 90º to the excitation beam and focused on a monochro-
mator (f = 100 mm, 16 nm bandwidth) through a cut-off
filter, a Polaroid HNP’B polarizer and a quartz depolarizer
(Acton Research Corp., Acton, MA, USA). The total fluo-
rescence intensity decay, I(t)=I
m
(t), was measured with
the emission polarizer set at 54.7°, relative to the vertically
polarized excitation beam. The two emission components,
polarized parallel I
VV
(t) and perpendicular I
VH
(t) to the
plane of polarization of the excitation beam, were recorded
sequentially by alternating the orientation of the emission
polarizer every 10–20 min. The timing calibration was
48.8 ps per channel, with 4096 data channels. Typical
polarized decay curves had $ 6000–40 000 counts in the
peak (2–11 · 10
6
total photons).The experimental anisot-
ropy decay R (t) is related to the experimental emission
decay of the polarized components by:
RðtÞ¼
I
VV
ðtÞÀGI
VH
ðtÞ½
I
VV
ðtÞþ2GI
VH
ðtÞ½
ð6Þ
In this instrumental setup, G is a scaling factor which is
independent of the emission wavelength and, in general,
has values near 1. It takes in account small instabilities of
the laser and ⁄ or differences in accumulation times for the
two polarized intensities. It was determined by correlating
the steady-state anisotropy value measured separately, to
the anisotropy value resulting from integration of the I
VV
(t)
and I
VH
(t) traces.
Decays I
m
(t) were fit to a sum of n exponential functions
(n = 1, 2) by iterative convolution, using nonlinear global
least-squares methods from the program globals
unlimited (Urbana, IL, USA) [30]. The emission
Fluorescence studies of RepA R. E. M. Diederix et al.
5404 FEBS Journal 275 (2008) 5393–5407 ª 2008 The Authors Journal compilation ª 2008 FEBS
anisotropy function, r(t) was determined by global analysis
of the two polarized components of the fluorescence inten-
sity, I
VV
(t) and I
VH
(t), as well as I
m
(t), using the same
routines. The analysis consisted in finding the r(t) numerical
parameters that best fit the two polarized decay functions
i
VV
(t)=[i(t) ⁄ 3][1+2r(t)] and i
VH
(t)=[i(t) ⁄ 3][1)r(t)],
where i(t)=i
VV
(t)+2i
VH
(t)=3i
m
(t), to the experimental
traces. Lower case letters refer to the mathematical func-
tions, whereas upper case letters refer to the convoluted
experimental data and resulting fits. In the case of
AEDANS, individual analysis of 480 and 530 nm decays
gave very similar lifetime values. Therefore, anisotropy data
from two emission wavelengths (480 and 530 nm) were fit-
ted simultaneously, linking the corresponding component
lifetimes to get a better defined set of fitting parameters.
The adequacy of the analyses was determined from the
reduced weighted sum of squares of residuals, and visual
inspection of the distribution of weighted residuals. The
general expression used for the emission anisotropy param-
eters in the fits is given by Eqn (7), in which /
i
are correla-
tion times, and the pre-exponential factors b
i
are
normalized. In all the AEDANS anisotropy experiments
the time zero anisotropy, r
0
, from the fit had an average
value of 0.31 ± 0.015. In the case of Trp anisotropy analy-
sis, r
0
was kept fixed at a reasonable value, 0.28 [31], to
suppress the contribution of otherwise unaccounted for
scatter to useful parameters.
rðtÞ¼r
0
X
b
i
exp Àt=/
i
½ ð7Þ
Estimates of the global rotational correlation times for free
dimeric RepA, and the complexes with 1IR, 1DR and
1DR-short were calculated in one of two ways: based on
the 3D structure and based on a prolate ellipsoid shape
with dimensions derived from sedimentation velocity experi-
ments [3]. In the case of iteron complexes, a crystal struc-
ture of the homologous protein F plasmid RepE in
complex with its cognate iteron sequence is available [7].
Using this, we built an homology model of the RepA–1DR
structure [2,10] and simply elongated the DNA sequence
assuming rigid DNA with no additional bending, to con-
struct the complexes with 1DR and 1DR-short. Note that
the elongation is symmetric for 1DR-short, but asymmetric
in the case of 1DR. We did not account for the much
stronger DNA bending observed in EMSA experiments
(52°) than in the crystal structure (20°) [6]. The structures
thus obtained were used as input to the hydropro pro-
gram, which calculates hydrodynamic parameters on the
basis of atomic co-ordinates [17]. Other input factors
included the specific protein volume (0.702 mLÆg
)1
), solu-
tion density (1.019 gÆmL
)1
) and solvent viscosity (1.096 cP).
The latter value was determined for the buffer at 23.5 °C
using a capillary viscosimeter (Schott, Mainz, Germany).
The lowest and highest of the five output global rotational
correlation times for each geometry are included in Table 3
for comparative purposes. The global rotational correlation
times for the F plasmid RepE–operator complex were cal-
culated in the same way, using its recently published crystal
structure [9]. Note that the correlation time actually mea-
sured depends on the orientation of the AEDANS absorp-
tion and emission transition dipoles with respect to the
protein axes. For a case where any of these are parallel to
the long axis, the value takes the maximum limit. For the
other extreme, i.e. transition dipoles perpendicular to the
protein long axis, the correlation time takes a value slightly
higher than the minimum value [32].
For free RepA and the complex RepA–1IR, no (homolo-
gous) structures are available. A prolate ellipsoid shape was
assigned to both structures, with dimensions based on fric-
tion coefficients determined previously by sedimentation
velocity experiments (f ⁄ f
0
= 1.2 for free and 1IR-bound
RepA), in which special care was taken regarding complex
dissociation during the analytical ultracentrifugation [3].
This value implies a ratio of long versus short axes of 4 in
the prolate ellipsoid, giving an observed average global
rotational correlation time that is 1.6–3.4 times higher than
expected if the molecule were spherical, depending on probe
orientation [33,34]. Just like for the cases where correlation
times were calculated using hydropro, the limiting mini-
mum and maximum rotational correlation times have been
included in Table 3. Partial specific volumes used for pro-
tein, DNA and hydration were 0.703, 0.55 and 0.28 mLÆg
)1
,
respectively.
Acknowledgements
We thank Guillermo Bernabeu for excellent technical
assistance and Dr Silvia Zorrilla for helpful discus-
sions. Financial support was from the Spanish Minis-
try for Education and Science (MEC grant nos.:
BMC2003-00088 (to RG and MPL), BFU2006-00494
(to RG), and BFU2006-0395 ⁄ BMC (REMD and
MPL)). REMD is supported by a ‘Juan de la Cierva’
fellowship (MEC grant no.: JCI-2005-1721-2).
References
1 Giraldo R (2003) Common domains in the initiators of
DNA replication in Bacteria, Archaea and Eukarya:
combined structural, functional and phylogenetic per-
spectives. FEMS Microbiol Rev 26, 533–554.
2 Giraldo R & Ferna
´
ndez-Tresguerres ME (2004) Twenty
years of the pPS10 replicon: insights on the molecular
mechanism for the activation of DNA replication in
iteron-containing bacterial plasmids. Plasmid 52,
69–83.
3Dı
´
az-Lo
´
pez T, Lages-Gonzalo M, Serrano-Lo
´
pez A,
Alfonso C, Rivas G, Dı
´
az-Orejas R & Giraldo R (2003)
Structural changes in RepA, a plasmid replication
R. E. M. Diederix et al. Fluorescence studies of RepA
FEBS Journal 275 (2008) 5393–5407 ª 2008 The Authors Journal compilation ª 2008 FEBS 5405
inititator, upon binding to origin DNA. J Biol Chem
278, 18606–18616.
4 Giraldo R, Andreu JM & Dı
´
az-Orejas R (1998) Protein
domains and conformational changes in the activation
of RepA, a DNA replication initiator. EMBO J 17,
4511–4526.
5 Giraldo R, Ferna
´
ndez-Tornero C, Evans PR, Dı
´
az-
Orejas R & Romero A (2003) A conformational switch
between transciptional repression and replication initia-
tion in the RepA dimerization domain. Nat Struct Biol
10, 565–571.
6Dı
´
az-Lo
´
pez T, Da
´
vila-Fajardo C, Blaesing F, Lillo MP
& Giraldo R (2006) Early events in the binding of the
pPS10 replication protein RepA to single iteron and
operator DNA sequences. J Mol Biol 364, 909–920.
7 Komori H, Matsunaga F, Higuchi Y, Ishiai M, Wada
C & Miki K (1999) Crystal structure of a prokaryotic
replication initiator bound to DNA at 2.6 A
˚
resolution.
EMBO J 18, 4597–4607.
8 Swan MK, Bastia D & Davies C (2006) Crystal struc-
ture of p initiator protein–iteron complex of plasmid
R6K: implication for initiation of plasmid DNA
replication. Proc Natl Acad Sci USA 103, 18481–
18486.
9 Nakamura A, Wada C & Miki K (2007) Structural
basis for regulation of bifunctional roles in replication
initiator protein. Proc Natl Acad Sci USA 104, 18484–
18489.
10 Urh M, Wu J, Wu J, Forest K, Inman RB & Filutowicz
M (1998) Assemblies of replication initiation protein on
symmetric and asymmetric DNA sequences depend on
multiple protein oligomerisation surfaces. J Mol Biol
283, 619–631.
11 Park K, Han E, Paulsson J & Chattoraj DK (2001)
Origin pairing (‘handcuffing’) as a mode of negative
control of P1 plasmid copy number. EMBO J 20,
7323–7332.
12 Paulsson J & Chattoraj DK (2006) Origin inactivation
in bacterial DNA replication control. Mol Microbiol 61,
9–15.
13 Callis PR & Vivian JT (2003) Understanding the vari-
able fluorescence quantum yield of tryptophan in pro-
teins using QM–MM simulations. Quenching by charge
transfer to the peptide backbone. Chem Phys Lett 369,
409–414.
14 Dale RE, Eisinger J & Blumberg WE (1979) The orien-
tational freedom of molecular probes. The orientational
factor in intramolecular energy transfer. Biophys J 26,
161–194.
15 Lillo MP, Beechem JM, Szpikowska BK, Sherman MA
& Mas MT (1997) Design and characterization of a
multisite fluorescence energy-transfer system for protein
folding studies: a steady-state and time-resolved study
of yeast phosphoglycerate kinase. Biochemistry 36,
11261–11272.
16 Weber G & Shinitzky M (1970) Failure of energy trans-
fer between identical aromatic molecules on excitation
at the long wave edge of the absorption spectrum. Proc
Natl Acad Sci USA 65, 823–830.
17 Garcia de la Torre J, Huertas ML & Carrasco B (2000)
Calculation of hydrodynamic properties of globular
proteins from their atomic-level structure. Biophys J
78,
719–730.
18 Fueki T, Sugiura S & Yamaguchi K (1996) Open
strands to iterons promote the binding of the replication
initiator protein (Rep) of pSC101 to the unit sequence
of the iterons in vitro. Biochim Biophys Acta 1305, 181–
188.
19 Kunnimalaiyaan S, Kru
¨
ger R, Ross W, Rakowski SA
& Filutowicz M (2004) Binding modes of the initiator
and inhibitor forms of the replication protein p to the c
ori iteron of plasmid R6K. J Biol Chem 279, 41058–
41066.
20 Williams LD & Maher LJ III (2000) Electrostatic mech-
anisms of DNA deformation. Annu Rev Biophys Biomol
Struct 29, 497–521.
21 Kru
¨
ger R, Rakowski SA & Filutowicz M (2004) Partici-
pating elements in the replication of iteron containing
plasmids. In Plasmid Biology (Funnell BE & Phillips
GJ, eds), pp. 25–45. ASM Press, Washington DC.
22 Chattoraj DK (2000) Control of plasmid DNA replica-
tion by iterons: no longer paradoxical. Mol Microbiol
37, 467–476.
23 Clegg RM (1992) Fluorescence resonance energy trans-
fer and nucleic acids. Methods Enzymol 211, 353–388.
24 Majumdar ZK, Hickerson R, Noller HF & Clegg RM
(2005) Measurements of internal distance changes of the
30S ribosome using FRET with multiple donor–accep-
tor pairs: quantitative spectroscopic methods. J Mol
Biol 351, 1123–1145.
25 Demchenko AP (1986) Ultraviolet Spectroscopy of Pro-
teins. Springer-Verlag, Berlin.
26 Hudson EN & Weber G (1973) Synthesis and character-
ization of two fluorescent sulfhydryl reagents. Biochem-
istry 12, 4154–4161.
27 van der Meer BW (2002) Kappa-squared: from nuisance
to new sense. J Biotechnol 82, 181–196.
28 Szabo AG & Rayner DM (1980) Fluorescence decay of
tryptophan conformers in aqueous solution. J Am Chem
Soc 102, 554–563.
29 Lillo MP, Can
˜
adas O, Dale RE & Acun
˜
a AU (2002)
Location and properties of the taxol binding center in
microtubules: a picosecond laser study with fluorescent
taxoids. Biochemistry 41, 12436–12449.
30 Beechem JM, Gratton E, Ameloot M, Knutson JR &
Brand L (1991) The global analysis of fluorescence
intensity and anisotropy decay data: second generation
theory and programs. In Topics in Fluorescence
Spectroscopy, Vol. 2 (Lakowicz JR, ed.), pp. 241–305.
Plenum Press, New York, NY.
Fluorescence studies of RepA R. E. M. Diederix et al.
5406 FEBS Journal 275 (2008) 5393–5407 ª 2008 The Authors Journal compilation ª 2008 FEBS
31 Ruggiero AJ, Todd DC & Fleming GR (1990) Subpico-
second fluorescence anisotropy studies of tryptophan in
water. J Am Chem Soc 112, 1003–1014.
32 Lakowicz JR (1999) Principles of Fluorescence Spectro-
scopy, 2nd edn. Kluwer Academic, New York, NY.
33 Zorrilla S, Rivas G & Lillo MP (2004) Fluorescence
anisotropy as a probe to study tracer proteins in
crowded solutions. J Mol Recog 17, 408–416.
34 Waxman E, Laws WR, Laue TM, Nemerson Y & Ross
JBA (1993) Human factor VIIa and its complex with
soluble tissue factor: evaluation of asymmetry and con-
formational dynamics by ultracentrifugation and fluo-
rescence anisotropy decay methods. Biochemistry 32,
3005–3012.
Supporting information
The following supplementary material is available:
Fig. S1. Anisotropy decays R(t)(k
ex
= 297 nm, k
em
=
345 nm) of wild-type RepA free in solution (A) and
bound to 1IR (B), 1DR (C).
Fig. S2. Anisotropy decays R(t)(k
ex
= 375 nm, k
em
=
530 nm) of AEDANS C160–RepA free in solution (A)
and bound to 1IR (B), 1DR (C) and 1DR-short (D).
Table S1. Fluorescence lifetimes and decay amplitudes
for W94 and AEDANS–C160, respectively, in free
RepA and RepA bound to various cognate DNA
sequences.
This supplementary material can be found in the
online version of this article.
Please note: Wiley-Blackwell is not responsible for
the content or functionality of any supplementary
materials supplied by the authors. Any queries (other
than missing material) should be directed to the corre-
sponding author for the article.
R. E. M. Diederix et al. Fluorescence studies of RepA
FEBS Journal 275 (2008) 5393–5407 ª 2008 The Authors Journal compilation ª 2008 FEBS 5407