Báo cáo khoa học: Secondary structure of lipidated Ras bound to a lipid bilayer pptx
Bạn đang xem bản rút gọn của tài liệu. Xem và tải ngay bản đầy đủ của tài liệu tại đây (594.72 KB, 9 trang )
Secondary structure of lipidated Ras bound to
a lipid bilayer
Jo
¨
rn Gu
¨
ldenhaupt
1,
*, Yekbun Adigu
¨
zel
1,
*, Ju
¨
rgen Kuhlmann
2
, Herbert Waldmann
2
,
Carsten Ko
¨
tting
1
and Klaus Gerwert
1
1 Lehrstuhl fu
¨
r Biophysik, Ruhr-Universita
¨
t Bochum, Germany
2 Max Planck Institute of Molecular Physiology, Dortmund, Germany
Ras proteins are molecular switches [1] that operate in
distinct cellular activities as mediators in cell signalling
cascades from receptor tyrosine kinases to the nucleus,
through the activation of downstream effectors, to
stimulate, for example, growth and differentiation
[2,3]. During its activity, Ras is bound to the inner
leaflet of the cellular membrane with its C-terminus
[4]. The C-terminus is hypervariable and this, in turn,
results in different Ras isoforms (H-, N- and K-Ras),
which are recruited to different membrane platforms.
All isoforms are otherwise very similar in structure
and function. They terminate in a CAAX (C, Cys; A,
aliphatic; X, variety of amino acids) motif initially,
which undergoes sequential farnesylation at Cys186,
Keywords
FTIR; GTPases; lipid anchor; membrane;
proteins
Correspondence
K. Gerwert, Lehrstuhl fu
¨
r Biophysik,
Ruhr-Universita
¨
t Bochum, Universita
¨
tsstr.
150, D-44801 Bochum, Germany
Fax: +49 234 32 14238
Tel: +49 234 32 24461
E-mail:
*These authors contributed equally to this
work
(Received 28 August 2008, revised
25 September 2008, accepted
1 October 2008)
doi:10.1111/j.1742-4658.2008.06720.x
Ras proteins are small guanine nucleotide binding proteins that regulate
many cellular processes, including growth control. They undergo distinct
post-translational lipid modifications that are required for appropriate
targeting to membranes. This, in turn, is critical for Ras biological func-
tion. However, most in vitro studies have been conducted on nonlipidated
truncated forms of Ras proteins. Here, for the first time, attenuated total
reflectance-FTIR studies of lipid-modified membrane-bound N-Ras are
performed, and compared with nonlipidated truncated Ras in solution.
For these studies, lipidated N-Ras was prepared by linking a farnesylated
and hexadecylated N-Ras lipopeptide to a truncated N-Ras protein (resi-
dues 1–181). It was then bound to a 1-palmitoyl-2-oleoyl-sn-glycero-
3-phosphocholine bilayer tethered on an attenuated total reflectance
crystal. The structurally sensitive amide I absorbance band in the IR was
detected and analysed to determine the secondary structure of the pro-
tein. The NMR three-dimensional structure of truncated Ras was used to
calibrate the contributions of the different secondary structural elements
to the amide I absorbance band of truncated Ras. Using this novel
approach, the correct decomposition was selected from several possible
solutions. The same parameter set was then used for the membrane-
bound lipidated Ras, and provided a reliable decomposition for the mem-
brane-bound form in comparison with truncated Ras. This comparison
indicates that the secondary structure of membrane-bound Ras is similar
to that determined for the nonlipidated truncated Ras protein for the
highly conserved G-domain. This result validates the multitude of investi-
gations of truncated Ras without anchor in vitro. The novel attenuated
total reflectance approach opens the way for detailed studies of the inter-
action network of the membrane-bound Ras protein.
Abbreviations
ATR, attenuated total reflectance; FWHH, full width at half-height; GFP, green fluorescent protein; IRE, internal reflection element; POPC,
1-palmitoyl-2-oleoyl-sn-glycero-3-phosphocholine.
5910 FEBS Journal 275 (2008) 5910–5918 ª 2008 The Authors Journal compilation ª 2008 FEBS
AAX proteolysis and methylesterification. H-Ras is
then palmitoylated at Cys181 and Cys184, whereas
N-Ras is palmitoylated at Cys181 only. K-Ras has
a polybasic domain instead, which spans residues
175–180 [5].
In vitro studies on lipidated Ras have included the
NMR characterization of farnesylated versus nonfarn-
esylated H-Ras in solution, but not membrane bound
[6], NMR studies on the dynamics of the lipid anchor
in the membrane [7,8], studies of membrane binding
by surface plasmon resonance [9] and grazing incidence
X-ray diffraction [10], molecular dynamics simulations
[11] and orientation of membrane-bound Ras by inter-
nal reflection IR spectroscopy [12]. Two lipid anchors
are necessary for stable membrane insertion [9]. Mem-
brane localization has been investigated using fluores-
cence labels and atomic force microscopy [13]. Either
green fluorescent protein (GFP)–Ras constructs [14] or
chemically modified anchors [15] have been used. It
has been shown that lipid modification governs mem-
brane localization. After S-palmitoylation of H-Ras
and N-Ras at the Golgi, vesicular transport towards
the plasma membrane follows. The subsequent hydro-
lysis of the ester closes this cycle [14]. Acyl protein
thioesterase 1 is probably important for this process
[16]. In addition to localization, lipid anchors may also
be involved directly in protein–protein interactions
with guanine nucleotide exchange factors [17] and
effectors [18].
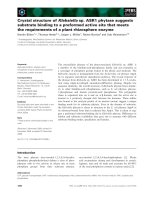
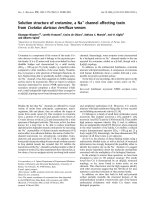
We used double lipid-anchored N-Ras protein pos-
sessing one farnesyl and one hexadecyl lipid moiety [9].
The Ras lipopeptide was attached to the C-terminus
with a maleimidocaproyl group (Fig. 1). The natural
palmitoyl moiety was replaced by the nonhydrolysable
hexadecyl moiety during our measurements. Binding of
this protein to solid supported 1-palmitoyl-2-oleoyl-sn-
glycero-3-phosphocholine (POPC) model membranes
was investigated using attenuated total reflectance
(ATR)-FTIR spectroscopy. For comparison, C-termi-
nally truncated Ras (H-Ras 1–166) without lipid modi-
fication was used. This form has been used in most
in vitro investigations so far. We present a novel
approach for the decomposition of the amide I band
into its secondary structural elements [19]. First, we
calibrated the parameter set of the decomposition with
an X-ray or NMR structural model. Using this param-
eter set, only the peak heights of the absorptions of
the secondary structural elements need to be optimized
in further decompositions. By doing this, the intrinsic
underestimation of the decomposition is largely
reduced and clear-cut for the relative changes. Here,
the structural differences between the secondary struc-
ture of Ras in solution and membrane bound were
determined within an accuracy of 3%, because the
same parameter set was used.
Results
Lipid bilayer formation and protein adsorption
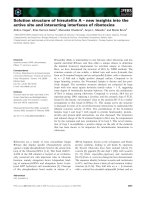
For the measurements of membrane-bound lipidated
Ras, the lipid layer was first formed on the ATR sur-
face. Lipid self-assembly was directly monitored by the
time-dependent absorbance increase in its methylene
stretching vibrations (Fig. 2A).
The buffer spectrum was subtracted as the reference.
The stability of the evolved bilayer was attained in
10–15 min (Fig. 2B). The time-dependent absorption
was the same as observed previously with a quartz crys-
tal microbalance by Richter et al. [20], who showed by
atomic force microscopy (AFM) that a single bilayer
was formed. Thus, we are confident that we have a
single bilayer of a similar quality. We checked the
completeness of our layer using BSA. The latter
strongly adsorbs at germanium, giving a strong amide I
absorbance. The same experiment with the POPC layer
gave an increase of less than 1% compared with the
latter experiment. Thus, it was concluded that the
POPC layer was at least 99% complete. Further,
the lipid layer durability was assured by monitoring the
absorbance of the lipid during the experiment. Specific
A
B
Fig. 1. (A) Natural N-Ras protein with the lipid anchors at residues
181 and 186. (B) For the lipidated Ras in this investigation, we used
a peptide attached to Cys181 of N-Ras via a maleimidocaproyl
group and the anchors attached to residues 183 and 188, leading
to two additional residues (encircled).
J. Gu
¨
ldenhaupt et al. Secondary structure of Ras bound to lipid bilayer
FEBS Journal 275 (2008) 5910–5918 ª 2008 The Authors Journal compilation ª 2008 FEBS 5911
binding of the double lipid-anchored N-Ras protein on
solid supported POPC model membranes was attained
and the IR spectra were measured. Truncated Ras was
used as a control and showed no binding.
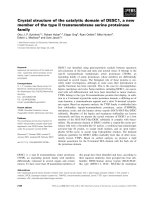
In Fig. 3, the absorbance increase in the amide I
band with time is shown for the membrane-anchored
and truncated Ras. The membrane-bound N-Ras pro-
tein was fully active within our set-up, as shown by an
activity test based on the ability to catalyse GTP
hydrolysis. For this purpose, the change in time of the
GDP ⁄ GTP ratio was determined by HPLC. The lipid
to protein ratio was calculated as described above,
and found to be about 150 ± 30 lipid molecules per
lipidated Ras protein. This corresponds to a mono-
layer with relatively densely packed Ras.
Curve-fitting analysis
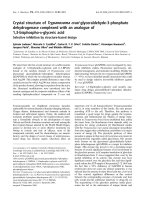
The original absorbance spectrum in the amide I¢ and
II regions with the side-chain contribution is shown in
Fig. 4. The side-chain contribution was subtracted
until the tyrosine side-chain absorbance at 1515 cm
)1
disappeared. Side-chain absorbances were removed
from the amide I¢ region because they overlap with the
amide I¢ absorption.
Our parameter set was calibrated by decomposition
of the truncated wild-type H-Ras transmission
A
B
Fig. 2. (A) ATR-FTIR absorbance of POPC methylene stretching
vibrations. (B) Model membrane adsorption kinetics on the IRE
surface observed at 2924 cm
)1
.
Fig. 3. Protein adsorption kinetics of lipidated Ras and truncated
Ras on the POPC model membrane observed by the amide I absor-
bance at 1650 cm
)1
.
Fig. 4. Amide I¢ and II regions of the original spectrum (black), its
side-chain spectrum (blue) and the side-chain-corrected spectrum
(red). A transmission measurement of truncated Ras is shown.
Secondary structure of Ras bound to lipid bilayer J. Gu
¨
ldenhaupt et al.
5912 FEBS Journal 275 (2008) 5910–5918 ª 2008 The Authors Journal compilation ª 2008 FEBS
spectrum with the corresponding NMR structure in
solution (pdb 1CRP [21]). The number and positions
of the individual secondary structural elements under-
lying the amide I¢ curve can be estimated using the
local minima of its second derivative and the local
maxima of its Fourier self-deconvolution (Fig. 5).
First, a decomposition with four components was
attempted, but the fit was not in agreement with the
NMR structural model (rmsd = 9.2 %). However, a
fit using five components yielded a standard deviation
from the measured spectrum of 6.25 · 10
)6
and rmsd
between IR and NMR of 1.1%. The bands obtained
were assigned to the respective secondary structures
that they represented: 1666.6 cm
)1
(turn), 1652.1 cm
)1
(a-helix), 1649.4 cm
)1
(a-helix), 1637.4 cm
)1
(random
coil) and 1631.6 cm
)1
(b-sheet). This parameter set
with fixed band positions, full widths at half-height
(FWHHs) and Gaussian ⁄ Lorentzian fractions was used
to decompose the membrane-bound form by optimiz-
ing only the peak heights for each component,
as described previously [19]. Therefore, the error of
the secondary structure change is much lower
than the error of the absolute secondary structure
determination.
The decomposition of truncated Ras in solution and
of membrane-bound Ras is shown in Fig. 6. It was
assumed for the decomposition that the extinction
coefficients were equal for all of the secondary struc-
tural elements of the protein. The two very similar
amide I¢ bands showed no unusual broadening, which
would point to protein denaturation. The results of the
secondary structural analyses are summarized in
Table 1. Much larger changes are observed, for
example, in the prion protein folding from a-helix to
b-sheet [22].
For our calibration, we favoured the NMR (pdb
1CRP [21], column 3) over the X-ray (pdb 4Q21 [23],
column 2) structural model, because it was also mea-
sured in solution. Furthermore, it resembles the mean
of an ensemble of 20 structures and thus indicates the
dynamics of the protein, leading to changes in second-
ary structure according to the stride algorithm by 3%.
It should be noted that the X-ray structure deviates by
up to 6% from the NMR structure. In particular, the
random coil content of the NMR structure increases
by 10 amino acids as compared to the X-ray structure.
In our calibration, good agreement of the decomposi-
tion of our transmission FTIR measurement (column
4, rmsd less than 3%) with the NMR data (pdb
1CRP) was obtained. It is also possible to calibrate the
decomposition by means of the X-ray structure, lead-
ing to another parameter set. However, the overall fit
is slightly better for the NMR structure-based
calibration set.
Fig. 5. The side-chain-corrected amide I¢ absorbance of a trans-
mission measurement of truncated Ras (black) and its second
derivative (blue) and its Fourier self-deconvolution [red, with
FWHH = 30 cm
)1
(Gaussian) and 13.6 cm
)1
(Lorentzian)]. The latter
was scaled by a factor of 0.4. The minima of the second derivative
and the maxima of the Fourier self-deconvolution were used as
starting positions for the fitting procedure.
Fig. 6. The amide I¢ regions of an ATR-FTIR measurement of mem-
brane-bound lipidated Ras and a transmission measurement of trun-
cated Ras are shown in comparison with their underlying backbone
absorbance of the secondary structural elements. Secondary struc-
ture volume differences are indicated with the same colour as their
respective spectra. The spectra were normalized to give an area of
unity for the amide I band.
J. Gu
¨
ldenhaupt et al. Secondary structure of Ras bound to lipid bilayer
FEBS Journal 275 (2008) 5910–5918 ª 2008 The Authors Journal compilation ª 2008 FEBS 5913
The secondary structure analysis of membrane-
bound lipidated Ras using the same parameter set,
optimizing only the five peak heights, is shown in
column 5. Here, we have taken into account the addi-
tional residues 167–188. Thus. it is easier to compare
the corresponding number of amino acids, instead of
the percentages of secondary structure. Overall, the
secondary structures of truncated and lipidated Ras
are in very good agreement. Because the same para-
meter set was used for all decompositions, possible
structural changes are reliably determined.
In principle, secondary structure analysis using an
ATR set-up contains a systematic error if the sample is
oriented, as the electric fields for vertical and perpen-
dicular polarized light are different [24]. However, Ras
is less oriented compared with transmembrane proteins
or even surface-adsorbed small organic molecules. In
order to probe this effect, we performed polarized
measurements and used the correction recommended
by Marsh [24]. This led to no significant deviations
(< 1%) from our analysis. Therefore, we neglected
this effect.
Discussion
As shown in Fig. 6 and Table 1, the secondary struc-
tures of truncated Ras and full-length membrane-bound
Ras are very similar. Therefore, it seems reasonable to
assume that the G-domain is conserved. If we assume
that there is no change within the G-domain, we can
estimate the secondary structure of the additional resi-
dues 167–188, as shown in column 6 of Table 1. We
have an increase in a-helical content of about six resi-
dues. This agrees with an NMR investigation [6,7],
which showed an extension of the C-terminal a-helix to
residue 172. Although only a very small random coil
increase was observed, a significant b-sheet content of
the anchor region was detected. Interestingly, an NMR
investigation of the C-terminal heptapeptide [7]
(D. Huster, Universita
¨
t Leipzig, Germany; personal
communication) also showed, despite the extensive
dynamics of this region, mainly b-sheet structure.
As summarized in Fig. 7, truncated Ras and mem-
brane-anchored full-length Ras show the same second-
ary structure within the accuracy of our method.
Meister et al. [12] investigated lipidated Ras binding to
a lipid layer using IR reflection-absorption spectros-
copy. In this study, it was assumed that the secondary
structure remains unaltered, and the observed changes
in the spectra were assigned to different orientations.
An advantage of the IR reflection-absorption spectros-
copy set-up is that the air–water interface is always
flat. Therefore, changes in the orientation can be reli-
ably determined. However, this is possible only at the
expense of the signal-to-noise ratio, and the signal of
membrane-anchored Ras was outside the detection
limit. Instead, the structure of Ras at the air–water
interface was analysed. With the largely increased
signal-to-noise ratio of ATR-FTIR, we have, for the
Table 1. X-Ray and NMR-based secondary structure of Ras in comparison with the protein spectra curve-fitting results of this work (col-
umns 5 and 6) (aa, amino acid).
Truncated Ras
1–166 from
X-ray (4Q21
cut to 1–166)
Truncated Ras
1–166 from NMR
(1CRP, average
of 20 models)
Truncated Ras
1–166 (average of
four measurements)
Membrane-bound
lipidated Ras 1–188
(average of three
measurements)
Estimated
structure of
the anchor
region 167–188
b-sheets 25.9% = 43 aa 22.3 ± 1.9% = 37 ± 3 aa 21.0 ± 3% = 35 ± 5 aa 25.1 ± 3% = 47 ± 6 aa 12
Random coils 13.3% = 22 aa 19.4 ± 2.6% = 32 ± 4 aa 20.0 ± 3% = 33 ± 5 aa 18.1 ± 3% = 34 ± 6 aa 1
a-helices 37.3% = 62 aa 35.5 ± 1.1% = 59 ± 2 aa 34.5 ± 3% = 57 ± 5 aa 33.3 ± 3% = 63 ± 6 aa 6
Turns 23.5% = 39 aa 22.8 ± 2.5% = 38 ± 4 aa 24.6 ± 3% = 41 ± 5 aa 23.5 ± 3% = 44 ± 6 aa 3
Standard deviation 6.25 · 10
)6
1.45 · 10
)5
Fig. 7. Secondary structure of the anchor region of membrane-
bound N-Ras according to our results, assuming a structurally
unchanged G-domain. The three-dimensional model was built
according to NMR structures [6,8,21].
Secondary structure of Ras bound to lipid bilayer J. Gu
¨
ldenhaupt et al.
5914 FEBS Journal 275 (2008) 5910–5918 ª 2008 The Authors Journal compilation ª 2008 FEBS
first time, obtained a high-quality IR spectrum of Ras
bound by its lipid anchors to a membrane. We found
that the secondary structure is not affected by mem-
brane binding when compared with the NMR struc-
ture of truncated Ras. Thus, the assumption of
Meister et al. [12], to assign the observed changes to
the orientation changes of the Ras protein, is con-
firmed. Interestingly, molecular dynamics simulations
of membrane-bound Ras protein gave similar results
[11]. Two modes of binding were found, which again
differ mainly in orientation but not in secondary struc-
ture. Recently, combined fluorescence resonance
energy transfer measurements on live cells and mole-
cular dynamics simulations of membrane-bound Ras
protein have suggested that the b2–b3-loop and the
a5-helix act as a novel switch by conformational
changes [25].
Conclusions
For the first time, the secondary structure of the
N-Ras protein bound with two anchors to a lipid
bilayer has been determined and compared with the
secondary structures of truncated Ras, from which the
X-ray and NMR structures were determined. Both
agree well within experimental error. Thus, our results
validate the numerous in vitro investigations of trun-
cated Ras carried out previously. Further, we propose
that the secondary structure of the anchor region is
mainly a-helix and b-sheet.
This study establishes FTIR spectroscopy of
membrane-bound Ras protein as a new tool, paving
the way to revealing the dynamic interactions of mem-
brane-bound N-Ras protein with its effectors and regu-
lators (i.e. Ras binding domain of Raf, guanine
nucleotide exchange factors and GTPase activating
proteins), including possible influences of Ras orienta-
tion. Such studies can be used to study the influence of
small molecules for molecular therapy on the Ras
interaction network.
Experimental procedures
Materials
POPC was purchased from Lipoid (Lipoid GmbH, Ludwig-
shafen, Germany). Lipid solutions at a concentration of
about 32 mm were prepared using chloroform. Lipid vesicle
solutions were prepared in D
2
O (Deutero GmbH, Kastel-
laun, Germany) buffer (20 mm Tris ⁄ HCl, pD 7.4, 5 mm
MgCl
2
,2mm dithioerythritol). A 40.8 gÆL
)1
protein stock
solution was used for the injection of N-Ras protein onto
the buffer solution of the adsorbed POPC model
membrane. All experiments were carried out in the same
deuterated buffer medium as given above at room temper-
ature. The absence of H
2
O was checked in the O–H stretch-
ing region of the spectrum.
A vertical ATR multireflection unit (Specac, Orpington,
UK) mounted in an IFS66 spectrometer (BrukerOptics,
Ettlingen, Germany) was used for the measurements. The
internal reflection element (IRE) was a 52 · 20 · 2mm
trapezoidal germanium ATR plate with an aperture angle
of 45° yielding 25 internal reflections.
The expression and purification of truncated H-Ras have
been described elsewhere [26]. For the synthesis of the farn-
esylated and hexadecylated N-Ras lipopeptide, truncated
(residues 1–181) wild-type N-Ras was expressed in Escheri-
chia coli CK600K strain, and then purified using DEAE
ion exchange chromatography and gel filtration. Chemically
synthesized N-Ras lipopeptide [27–29] was coupled to the
protein in 20 mm Tris ⁄ HCl, pH 7.4, 5 mm MgCl
2
, satu-
rated with the detergent Triton X 114. The detergent was
removed by DEAE ion exchange chromatography and the
lipoprotein was concentrated in 20 mm Tris ⁄ HCl, pH 7.4,
5mm MgCl
2
,2mm dithioerythritol by size exclusion filtra-
tion, using AmiconÒ concentrators. All protein batches
were analysed by SDS-PAGE and MALDI-TOF-MS.
Preparation of the ATR crystal
The germanium IRE of the ATR was cleaned chemically
with a mixture of chloroform and methanol, followed
by rinsing; the hydrophilic character of the crystal surface
was obtained by dipping it in sulfuric acid solution. The
crystal was rinsed again with double-distilled water and the
surface was dried under a nitrogen flow. Finally, an organic
solvent was applied to remove the lipid remnants. The
temperature was set to 292 K for all experiments.
Bilayer formation
POPC (12.9 lL) in chloroform was taken from a
25 mgÆmL
)1
stock solution in an Eppendorf tube, and two
volumes of chloroform were added for POPC small unila-
mellar vesicle preparation. Chloroform was then evaporated
under a mild nitrogen flow and subsequently kept under
vacuum for 2 h for complete removal of the chloroform
remnants. Deuterated buffer solution (50 lL) was added to
the multilayered dry lipid film and incubated for 1 h at
room temperature with shaking in a Thermomixer (Eppen-
dorf, Hamburg, Germany) at 1200 min
)1
. The resulting
solution after this treatment was a multilamellar vesicle
solution. A small unilamellar vesicle solution was prepared
from the multilamellar vesicle solution by sonification in an
ice-cold water bath for 7 min. Clearance of the opaque lipid
solution indicated the formation of vesicles with a radius of
less than 100 nm, and was checked by measurement with a
J. Gu
¨
ldenhaupt et al. Secondary structure of Ras bound to lipid bilayer
FEBS Journal 275 (2008) 5910–5918 ª 2008 The Authors Journal compilation ª 2008 FEBS 5915
High-Performance Particle Sizer using NIBSÔ Technology
from Malvern Instruments (Malvern, Worcestershire, UK).
POPC small unilamellar vesicles ( 0.3 mm, 1.2 mL)
were brought into contact with the clean hydrophilic
surface of the solid support to initiate the vesicle fusion
process on IRE [20]. Spectral collection was started imme-
diately after sample application. The incubation period for
lipid layer assembly was 30 min. The system was then
flushed with 10 mL of deuterated buffer through the
sampling system using a peristaltic pump-induced flow.
Protein incorporation
After the formation of the model membrane, protein incor-
poration was initiated by mixing the protein into the
sample solution on the surface. The starting bulk concen-
tration of the protein was approximately 2.0 lm in a buffer
containing 20 mm Tris ⁄ Cl, 5 mm MgCl
2
,1mm dithiothrei-
tol and 0.1 mm GDP at pD 7.8. Protein adsorption on to
the membrane was followed by the evolution of the amide I
and II (amide I¢ and II¢ in the case of deuterated buffer)
bands. The measurements were performed with the protein
in deuterated buffer. Measurements were carried out at
room temperature and performed at an instrument resolu-
tion of 2 cm
)1
with four times zero filling. Three-term
Blackman–Harris apodization was applied and 600 scans
were averaged for each spectrum.
Lipid to protein ratio
The lipid to protein ratio was estimated from the ratio of
the areas of the lipid (C=O) absorption at around
1750 cm
)1
and the side-chain absorbance-corrected protein
amide I¢ absorption. This ratio was divided by the ratio of
the respective number of carbonyl groups per molecule
(two for POPC and 188 for lipidated Ras). This result is a
rough estimate, neglecting differences in extinction coeffi-
cients and evanescent wave decay.
Curve-fitting analysis
First, all spectra were corrected for water vapour contribu-
tion manually and smoothed by apodization with a Gaussian
band shape with 4 cm
)1
FWHH. Then, the contribution of
the side-chains to the protein spectrum was computed within
the amide I¢ and II¢ regions. This was performed using the
kinetics software (provided by E. Goormaghtigh) running
under matlab (version R12, Mathworks, Natick, MA,
USA). The contributions of the side-chains were then rebuilt
according to the data given in the literature [30], and were
scaled and subtracted to eliminate the tyrosine ring vibration
band at 1515 cm
)1
. In addition, a linear baseline correction
between 1600 and 1700 cm
)1
was performed. Before curve
fitting, the second derivatives of the smoothed spectra were
inspected in order to estimate the number and positions of
the bands needed to deconvolute the amide I¢ absorption.
Least-squares iterative curve fitting was performed to fit a
mixture of Lorentzian and Gaussian line shapes to the spec-
trum between 1700 and 1600 cm
)1
, as initially described by
Goormaghtigh et al. [31] and improved by Ollesch et al. [19].
The decomposition of the amide I band does not provide an
unequivocal result, because the analysis is, in principle,
as in CD spectroscopy, experimentally underdetermined.
However, a novel approach was introduced in which the
decomposition of the truncated form of Ras is calibrated by
an NMR structure (pdb 1CRP [21]). This selects from several
possible decompositions that which agrees with the second-
ary structure as determined by NMR in solution. The
obtained parameter set (number of bands and positions,
FWHHs and Gaussian ⁄ Lorentzian fractions for each band)
was then used to decompose the amide I band of membrane-
bound Ras, where only the peak heights were fitted. They
reflect the contributions of the secondary structure elements.
Our novel approach provides a reliable analysis, especially of
the changes in secondary structure, and is described in detail
in Ollesch et al. [19]. Each experimental set was repeated
three times and the curve-fitting analyses were performed
with randomly selected spectra from each set. The results
showed less than 3% deviation. This value is the approximate
error. It was the same as that reported previously [19] for this
method.
The quality of curve fitting was evaluated through the
standard deviation of the fit, as the mean displacement of
the curve-fitted resultant spectrum from the original. The
rmsd values for the secondary structure content were calcu-
lated according to the formula:
rmsd ¼
ffiffiffiffiffiffiffiffiffiffiffiffiffiffiffiffiffi
1
N
X
i¼N
i¼1
d
2
i
v
u
u
t
; ð1Þ
where N is the total number of components, namely the
number of secondary structural elements, and d
i
is the devi-
ation of the structural component from its reported value
in the literature.
ATR measurements
We have presented in this study the sample preparation
of membrane-bound lipidated N-Ras protein on solid
supported POPC model membranes as a tool for mem-
brane protein interaction studies performed with the
ATR-FTIR technique [32]. The refractive index of germa-
nium IRE is 4.0 at 1000 cm
)1
and the penetration depth
of the evanescent wave at 1650 cm
)1
is approximately
1.5 lm. It should be noted that the usual linear ATR
correction for the wavelength dependence of the penetra-
tion depth is not necessary, because our sample is only a
monolayer close to IRE. Within a 10 nm layer, the
Secondary structure of Ras bound to lipid bilayer J. Gu
¨
ldenhaupt et al.
5916 FEBS Journal 275 (2008) 5910–5918 ª 2008 The Authors Journal compilation ª 2008 FEBS
intensity of the electric field changes by only 0.1%
between 1600 and 1700 cm
)1
.
Acknowledgements
The authors wish to acknowledge the Max Planck
Institute of Molecular Physiology in Dortmund and
SFB 642 for financial support. We thank Angela Kal-
lenbach for providing H-Ras (1–166) and Till Rudack
for help with Fig. 7.
References
1 Vetter IR & Wittinghofer A (2001) Signal transduction
– the guanine nucleotide-binding switch in three dimen-
sions. Science 294, 1299–1304.
2 Downward J (2003) Targeting RAS signalling pathways
in cancer therapy. Nat Rev Cancer 3, 11–22.
3 Malumbres M & Barbacid M (2003) Timeline – RAS
oncogenes: the first 30 years. Nat Rev Cancer 3, 459–
465.
4 Willumsen BM, Christensen A, Hubbert NL, Papa-
george AG & Lowy DR (1984) The P21 Ras C-termi-
nus is required for transformation and membrane
association. Nature 310, 583–586.
5 Wittinghofer A & Waldmann H (2000) Ras – a molecu-
lar switch involved in tumor formation. Angew Chem
Int Edit 39, 4192–4214.
6 Thapar R, Williams JG & Campbell SL (2004) NMR
characterization of full-length farnesylated and non-
farnesylated H-ras and its implications for raf activa-
tion. J Mol Biol 343, 1391–1408.
7 Reuther G, Tan KT, Kohler J, Nowak C, Pampel A,
Arnold K, Kuhlmann J, Waldmann H & Huster D
(2006) Structural model of the membrane-bound
C terminus of lipid-modified human N-ras protein.
Angew Chem Int Edit 45, 5387–5390.
8 Reuther G, Tan KT, Vogel A, Nowak C, Arnold K,
Kuhlmann J, Waldmann H & Huster D (2006) The
lipidated membrane anchor of full length N-Ras
protein shows an extensive dynamics as revealed by
solid-state NMR spectroscopy. J Am Chem Soc 128,
13840–13846.
9 Bader B, Kuhn K, Owen DJ, Waldmann H, Wittingho-
fer A & Kuhlmann J (2000) Bioorganic synthesis of
lipid-modified proteins for the study of signal transduc-
tion. Nature (London) 403, 223–226.
10 Bringezu F, Majerowicz M, Wen SY, Reuther G, Tan
KT, Kuhlmann J, Waldmann H & Huster D (2007)
Membrane binding of a lipidated N-Ras protein
studied in lipid monolayers. Eur Biophys J Biophys 36,
491–498.
11 Gorfe AA, Hanzal-Bayer M, Abankwa D, Hancock JF
& McCammon JA (2007) Structure and dynamics of
the full-length lipid-modified H-ras protein in a
1,2-dimyristoylglycero-3-phosphocholine bilayer. J Med
Chem 50, 674–684.
12 Meister A, Nicolini C, Waldmann H, Kuhlmann J,
Kerth A, Winter R & Blume A (2006) Insertion of lipi-
dated Ras proteins into lipid monolayers studied by
infrared reflection absorption spectroscopy (IRRAS).
Biophys J 91, 1388–1401.
13 Nicolini C, Baranski J, Schlummer S, Palomo J, Lumbi-
erres-Burgues M, Kahms M, Kuhlmann J, Sanchez S,
Gratton E, Waldmann H et al. (2006) Visualizing asso-
ciation of N-Ras in lipid microdomains: influence of
domain structure and interfacial adsorption. JAm
Chem Soc 128, 192–201.
14 Rocks O, Peyker A, Kahms M, Verveer PJ, Koerner C,
Lumbierres M, Kuhlmann J, Waldmann H, Wittingho-
fer A & Bastiaens PIH (2005) An acylation cycle regu-
lates localization and activity of palmitoylated Ras
isoforms. Science 307, 1746–1752.
15 Reents R, Wagner M, Kuhlmann J & Waldmann H
(2004) Synthesis and application of fluorescence-labeled
Ras-proteins for live-cell imaging. Angew Chem Int Edit
43, 2711–2714.
16 Deck P, Pendzialek D, Biel M, Wagner M, Popkirova
B, Ludolph B, Kragol G, Kuhlmann J, Giannis A &
Waldmann H (2005) Development and biological evalu-
ation of acyl protein thioesterase 1 (APT1) inhibitors.
Angew Chem Int Edit 44, 4975–4980.
17 Porfiri E, Evans T, Chardin P & Hancock JF (1994)
Prenylation of Ras proteins is required for efficient
Hsos1-promoted guanine-nucleotide exchange. J Biol
Chem 269, 22672–22677.
18 Rubiol I, Wittig U, Meyer C, Heinze R, Kadereit D,
Waldmann H, Downward L & Wetzker R (1999) Farn-
esylation of Ras is important for the interaction with
phosphoinositide 3-kinase gamma. Eur J Biochem
266,
70–82.
19 Ollesch J, Kunnemann E, Glockshuber R & Gerwert K
(2007) Prion protein alpha-to-beta transition monitored
by time-resolved Fourier transform infrared spectros-
copy. Appl Spectrosc 61, 1025–1031.
20 Richter R, Mukhopadhyay A & Brisson A (2003) Path-
ways of lipid vesicle deposition on solid surfaces: a
combined QCM-D and AFM study. Biophys J 85,
3035–3047.
21 Kraulis PJ, Domaille PJ, Campbell-Burk SL, Van Aken
T & Laue ED (1994) Solution structure and dynamics
of Ras p21.GDP determined by heteronuclear three-
and four-dimensional NMR spectroscopy. Biochemistry
33, 3515–3531.
22 Elfrink K, Ollesch J, Sto
¨
hr C, Willbold D, Riesner D &
Gerwert K (2008) Structural changes of membrane
anchored PrPC. Proc Natl Acad Sci USA 105, 10815–
10819.
J. Gu
¨
ldenhaupt et al. Secondary structure of Ras bound to lipid bilayer
FEBS Journal 275 (2008) 5910–5918 ª 2008 The Authors Journal compilation ª 2008 FEBS 5917
23 Milburn MV, Tong L, Devos AM, Brunger A, Yamaiz-
umi Z, Nishimura S & Kim SH (1990) Molecular switch
for signal transduction – structural differences between
active and inactive forms of protooncogenic Ras pro-
teins. Science 247, 939–945.
24 Marsh D (1999) Quantitation of secondary structure
in ATR infrared spectroscopy. Biophys J 77, 2630–
2637.
25 Abankwa D, Hanzal-Bayer M, Ariotti N, Plowman SJ,
Gorfe AA, Parton RG, McCammon JA & Hancock JF
(2008) A novel switch region regulates H-ras membrane
orientation and signal output. EMBO J 27, 727–735.
26 Tucker J, Sczakiel G, Feuerstein J, John J, Goody RS
& Wittinghofer A (1986) Expression of p21 proteins in
Escherichia coli and stereochemistry of the nucleotide-
binding site. EMBO J 5, 1351–1358.
27 Kuhn K, Owen DJ, Bader B, Wittinghofer A, Kuhl-
mann J & Waldmann H (2001) Synthesis of functional
Ras lipoproteins and fluorescent derivatives. JAm
Chem Soc 123, 1023–1035.
28 Nagele E, Schelhaas M, Kuder N & Waldmann H
(1998) Chemoenzymatic synthesis of N-Ras lipopep-
tides. J Am Chem Soc 120, 6889–6902.
29 Schelhaas M, Glomsda S, Hansler M, Jakubke HD &
Waldmann H (1996) Enzymatic synthesis of peptides
and Ras lipopeptides employing choline ester as a solu-
bilizing, protecting, and activating group. Angewandte
Chemie-Int Edn Eng 35, 106–109.
30 Barth A & Zscherp C (2002) What vibrations tell about
proteins. Q Rev Biophys 35, 369–430.
31 Goormaghtigh E, Cabiaux V & Ruysschaert J-M (1994)
Determination of soluble and membrane protein struc-
ture by Fourier transform infrared spectroscopy. I.
Assignments and model compounds. Subcell Biochem
23, 329–362.
32 Wenzl P, Fringeli M, Goette J & Fringeli UP (1994)
Supported phospholipid-bilayers prepared by the
Lb ⁄ vesicle method – a Fourier-transform infrared atten-
uated total-reflection spectroscopic study on structure
and stability. Langmuir 10, 4253–4264.
Secondary structure of Ras bound to lipid bilayer J. Gu
¨
ldenhaupt et al.
5918 FEBS Journal 275 (2008) 5910–5918 ª 2008 The Authors Journal compilation ª 2008 FEBS