2012 Partnering to Seal-A-Smile A report on the success of Wisconsin school-based dental sealant programs. pot
Bạn đang xem bản rút gọn của tài liệu. Xem và tải ngay bản đầy đủ của tài liệu tại đây (4.38 MB, 72 trang )
Partnering to Seal-A-Smile
2012
A report on the success of Wisconsin school-based dental sealant programs.
Partnering to Seal-A-Smile 2012
This report was developed by Children’s Health Alliance of Wisconsin and made possible
through a partnership and funding from Delta Dental of Wisconsin.
Delta Dental of Wisconsin is a not-for-profit dental service corporation that administers
and underwrites easy-to-use, cost-effective dental plans for employers and individuals
throughout Wisconsin. Delta Dental of Wisconsin is the largest dental benefits provider
in the state, covering more than 1 million employees and family members.
Delta Dental supports a significant number of charitable oral health initiatives focused
on improving access to dental care and raising awareness of the importance of proper
oral health.
The following individuals contributed to the preparation of this report:
• Matt Crespin, MPH, RDH, Children’s Health Alliance of Wisconsin
• Alex Eichenbaum, Children’s Health Alliance of Wisconsin
• Caroline Madormo, BSN, RN, CPN, Medical College of Wisconsin
Graphic design and layout, Tara Goris, Children’s Health Alliance of Wisconsin
2
Table of contents
Executive summary 4
Background 6
Methods 8
Key findings 10
Conclusion/recommendations 18
Sealant program profiles 20
• Adams County 20
• Ashland County 52
• Barron County 21
• Bayfield County 22
• Brown County 23
• Buffalo County 24
• Burnett County 21
• Calumet County 50
• Chippewa County 21, 25
• Clark County 26
• Columbia County 27
• Crawford County 33
• Dane County 28
• Dodge County n/a
• Door County 29
• Douglas County 30
• Dunn County 21, 25
• Eau Claire County 25, 31
• Florence County 60
• Fond du Lac County 32
• Forest County 60
• Grant County 33
• Green County 34
• Green Lake County n/a
• Iowa County 33, 35
• Iron County 52
• Jackson County n/a
• Jefferson County 36
• Juneau County 37
• Kenosha County 38
• Kewaunee County 29
• La Crosse County 39
• Lafayette County n/a
• Langlade County 40
Partnering to Seal-A-Smile 2012
Partnering to Seal-A-Smile 2012
• Lincoln County 41
• Manitowoc County 42
• Marathon County n/a
• Marinette County 43
• Marquette County 20
• Menominee County n/a
• Milwaukee County 44, 45, 46, 47, 53
• Monroe County 48
• Oconto County 49
• Oneida County 60
• Outagamie County 50
• Ozaukee County n/a
• Pepin County n/a
• Pierce County n/a
• Polk County 21
• Portage County 51
• Price County 52
• Racine County 53
• Richland County n/a
• Rock County 54, 55
• Rusk County 25
• St. Croix County 21
• Sauk County 56
• Sawyer County n/a
• Shawano County 57
• Sheboygan County 58
• Taylor County 25
• Trempealeau County 59
• Vernon County n/a
• Vilas County 60
• Walworth County 61
• Washburn County 21
• Washington County 53
• Waukesha County 62
• Waupaca County 63
• Waushara County 64
• Winnebago County 50, 65, 66
• Wood County 67
2011-12 county breakdown of schools (grades 1-8) 68
Seal-A-Smile map 69
Seal-A-Smile logic model 70
3
4
Executive summary
This report provides a comprehensive overview of the Wisconsin Seal-A-Smile (SAS) program. The
information highlights the program’s expansion and key findings identified through analysis of
annual data from 2005-10. Continued expansion of programs will help reach populations without
access to regular preventive care.
This report highlights the tremendous work being accomplished throughout Wisconsin despite
limited resources, and builds on the previous report released in 2009. After the release of the
previous report, additional federal and private funding for Wisconsin SAS was secured. These
findings demonstrate how additional funding can make a significant difference. The findings in this
report substantiate the need for continued state and private funding for school-based oral health
prevention programs.
What you will find in the this report
This report provides an overview of the success school-based oral health prevention programs have
had since 2005. Key findings focus on caries rates, children served, sealant retention rates and other
efficiency measures. Data was collected from current and past Wisconsin SAS programs, in addition
to other school-based programs not funded through SAS. Please note, instead of using both years to
denote school year, we reference the year of the fall semester. For example, 2010-11 is referred to as
the 2010 school year.
Key findings from the 2005-10 school years:
• The number of schools served by Wisconsin SAS increased from 135 to 406.
• The number of schools served by Wisconsin SAS with free and reduced lunch (FRL) rates of
greater than 50 percent increased from 48 to 229.
• The number of children and youth with special health care needs (CYSHCN) served by
Wisconsin SAS increased from 261 to 3,248.
• The overall average cost to deliver sealants increased from $89.37/child to $110.49/child.
• The average amount of Medicaid reimbursement received by programs increased from
$17.40/child to $59.94/child due in part, to the ability of dental hygienists to become
Medicaid providers.
• The number of children screened and sealed increased significantly.
• The percentage of children screened with untreated dental decay decreased from 40.8
percent to 35.4 percent.
• The number of children who received fluoride treatments in addition to dental sealants
increased from 3,304 to 23,499.
• The proportion of children with either Medicaid or SCHIP (BadgerCare Plus) insurance
coverage participating in Wisconsin SAS increased from 53.4 percent to 69.5 percent.
• The number of children who received oral health education quadrupled from 9,404 to 37,599.
• Sealant retention rates increased from 76.1 to 92.9 percent.
Partnering to Seal-A-Smile 2012
Partnering to Seal-A-Smile 2012
Testimonial
"The value of Just Kids Dental (Douglas County) program is difficult to express. We
have many children in our school district who have never been to a dentist. Without
this great program and their ability to work with community resources, many of the
children who have received quality services would have never received oral health
care. The dental staff have a wonderful way of making our students feel comfortable
so each student remains positive about dental care. Our younger students even tease
about who gets to go first in the dental chair!"
Nancy Smith
Director of Health Services
School District of Superior
5
6
Background
Children’s Health Alliance of Wisconsin (Alliance) is the statewide voice for children’s health. The Alliance
raises awareness, mobilizes leaders, impacts public health and implements programs proven to work.
Since 1994, the Alliance has led efforts to improve access to oral health care for underserved children in
Wisconsin. Efforts include coalition building, policy development activities and program management. In
2005, the Partnering to Seal-A-Smile grant was awarded to the Alliance by Delta Dental of Wisconsin to
evaluate the effectiveness of the Wisconsin Seal-A-Smile (SAS) program and bring attention to the need
for increased school-based oral health programs.
Since 2000, the Alliance has administered the Wisconsin SAS program in collaboration with the Wisconsin
Department of Health Services (DHS), Oral Health Program. The Alliance provides program oversight,
technical assistance and data collection for approximately 42 school-based dental sealant programs
annually. The SAS program targets low-income, uninsured children who attend schools with high FRL
rates. Wisconsin SAS defines high-risk schools as those with FRL rates 35 percent and greater. In addition
to sealant application, all children receive topical fluoride applications and oral health education. A
select number of programs also provide dental cleanings and restorative services. Medicaid billing is
utilized by all programs to help ensure sustainability. Volunteer time and match dollars account for
nearly 75 percent of the true costs to run Wisconsin SAS programs.
Sealant application is considered an evidence-based, preventive strategy for children and commonly
used in private practice dentistry. Low-income, uninsured children have difficulty accessing private
practice dentistry and are denied the benefits of regular dental preventive strategies, including sealants.
The Wisconsin SAS program is helping Wisconsin achieve its Healthiest Wisconsin 2020 oral health
objectives. The first objective states that by 2020, the state will “assure access to ongoing oral health
education and comprehensive prevention, screening and early intervention, and treatment of dental
disease in order to promote healthy behaviors and improve and maintain oral health.” According to the
Wisconsin 2008 Make Your Smile Count survey, the percentage of Wisconsin’s third grade children with
untreated decay decreased from 31 to 20 percent between 2001 and 2007.
The second Healthiest Wisconsin 2020 objective states that by 2020, the state will “assure appropriate
access to effective and adequate oral health delivery systems, utilizing a diverse and adequate workforce,
for populations of differing races, ethnicities, sexual identities and orientations, gender identities, and
educational or economic status and those with disabilities.” This objective can partially be measured by
the percentage of Wisconsin schools with a dental sealant program.
Nationally, Healthy People 2020 calls for the number of school-based dental sealant programs to
increase. Oral health objective number eight states the country will strive to “increase the proportion of
low-income children and adolescents who received any preventive dental service during the past year.”
Oral health objective number 12 calls for the “increase in the proportion of children and adolecents who
have received dental sealants.” The Wisconsin SAS program has increased both the number of high-risk
schools served, as well as the number of children receiving Medicaid or SCHIP (BadgerCare Plus)
assistance served.
Partnering to Seal-A-Smile 2012
Partnering to Seal-A-Smile 2012
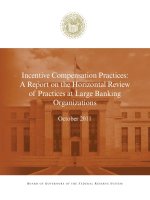
The Alliance manages state general purpose revenue (GPR) targeted to fund school-based sealant
programs. The dollars are subcontracted to the Alliance through DHS and subsequently awarded to
communities through a request for proposal process released each spring. Beginning in 2000, $60,000 of
GPR was allocated annually from the state budget. In 2005 this amount doubled to $120,000, as a result
of Governor Jim Doyle’s Kids First Initiative. However, due to budget cuts, GPR funding in 2011 was
reduced to $106,720.
In the 2006 school year, SAS funding again increased to approximately $200,000 due to Wisconsin
receiving a Health Resources and Services Administration (HRSA) three-year oral health workforce grant.
In 2009, HRSA funding increased to $241,000, which Delta Dental has matched annually. Beginning in the
2012 school year, HRSA funding will end and GPR funding will be increased by $250,000 to fill the void.
Delta Dental has agreed to match this funding for the 2012 school year.
Awards to community programs, as determined by a review committee, have ranged annually from
$1,000 to $75,000 depending on the needs of the individual program. The number of community
programs funded each year has increased from 12 to 42 with requests for dollars surpassing those
available.
As part of the Partnering to Seal-A-Smile grant, Delta Dental generously provided annual funding for 500
uninsured children in urban Milwaukee schools to receive dental sealants. This funding allowed the
Smart Smiles program, operated by Columbia St. Mary’s - St. Elizabeth Ann Seton Dental Clinic, to
increase the number of children served and expand their scope of service. Over the five years of funding,
Smart Smiles treated over 3,000 uninsured children.
Individual program profiles, beginning on page 20, highlight program accomplishments and best
practices. While there are common elements to all school-based dental sealant programs, each is
uniquely designed based on individual community needs and resources.
7
$0
$100,000
$200,000
$300,000
$400,000
$500,000
$600,000
$700,000
2000
2001
2002
2003
2004
2005
2006
2007
2008
2009
2010
2011
2012
Annual Wisconsin SAS funding
HRSA funding
Delta Dental funding
GPR funding
School year
8
Methods
The SAS logic model found on page 70 shows funding sources, activities, outputs and outcomes that
have assisted with the design of this report. The following outcomes were evaluated:
• Number of schools served and the FRL rates of those schools.
• Number of CYSHCN served.
• Number of students screened and sealed.
• Number of children with untreated decay and severity of disease.
• Insurance status of children participating.
• Proportion of children retaining sealants placed by Wisconsin SAS programs.
• Number of students receiving oral health education.
In 2003-04, the Centers for Disease Control and Prevention (CDC) developed the Sealant Efficiency
Assessment for Locals and States (SEALS) electronic data collection tool. Wisconsin programs were
used as a model for the creation of SEALS. Wisconsin DHS, the Alliance and nine community
programs worked intensely to retroactively collect data from the previous three years of the SAS
program. SEALS software has been marketed as a user-friendly tool to standardize sealant data
collection throughout the nation.
SEALS calculates cost-effectiveness, efficiency measures, disease burden and demographic
information. Wisconsin communities collect this information and forward it electronically to the
Alliance. The data assists in policy development and evaluation of programming.
SEALS data was used to evaluate the outcomes identified for this report. Data from non-funded
programs also was collected through self-reporting by individual program managers. The Alliance
continues to work with non-funded programs, in an attempt to integrate SEALS into their programs.
Some non-funded programs have agreed to utilize SEALS, allowing continuity in data collection
statewide.
Partnering to Seal-A-Smile 2012
Partnering to Seal-A-Smile 2012
Testimonial
“The day we had our school-based dental program dream fulfilled was amazing! The
registered dental hygienists were so professional, friendly, wonderful with the
children and incredibly efficient! The very best thing of all was that about one third of
our student body took advantage of this program and received treatment they
otherwise may not have gotten. The teacher who helped coordinate the program
made a personal contact with the parent(s)/guardian(s) of those students at higher
risk, explaining the importance of receiving care.
We were so impressed that the providers came back six weeks later to follow through
with a few additional treatments that needed to be administered. Taking on that kind
of responsibility of follow-up care is admirable. On that day, one of the hygienists
identified a situation happening with one of our student's front teeth and suggested
his guardian be contacted right away. This was done by the teacher coordinator. Part
of the challenge is it was taking so long for the guardian to get an appointment for the
student, a common problem in our area of the city. The guardian called the dentist
again and was able to get in sooner due to this urgent need being identified.
We are so grateful that we will be able to work with Preferred Dentistry
(Milwaukee/Racine/Washington Counties) next school year. This has truly been one of
the most positive programs we have ever participated in and we are forever thankful
to everyone who does their part to help make it possible. We hope that this program
will continue in the future. God bless you for all of your efforts to help take care of our
students' dental needs through this very unique and important program.”
Katie Foxe
Remedial and Resource Teacher / Coordinator of Special Services
Christ Memorial Lutheran School
9
10
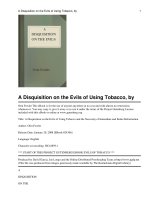
Key finding 1
The number of schools served by Wisconsin SAS with FRL rates greater than 50 percent
increased by 477 percent, between 2005 and 2010.
Between 2005 and 2010, the Wisconsin SAS program increased the total number of schools served
from 135 to 406. A significant increase in schools with FRL rates of greater than 50 percent also was
achieved. The figure increased from 48 schools in 2005, to 229 in 2010. Wisconsin SAS staff has
actively engaged oral health partners in communities lacking school-based services in high-risk (FRL
≥ 35 percent) schools to implement new programs. SAS funding is dedicated to serve schools
identified as high-risk. Some private and charter schools do not participate in the FRL program and
are labeled as “no FRL” in the graph above. Targeting specific communities, coupled with increased
funding and expanded programming, has contributed to noticeable increases in the number of high-
risk schools being served. This increase also demonstrates a dedication to reaching a greater number
of low-income and uninsured children.
Partnering to Seal-A-Smile 2012
0
50
100
150
200
250
300
350
400
450
2005 2006 2007 2008 2009 2010
No FRL
FRL <35%
FRL = 35-50%
FRL <50%
FRL >50%
Schools served
School year
Partnering to Seal-A-Smile 2012
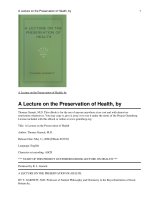
Key finding 2
The number of CYSHCN served was over 12 times higher in 2010 than it was in 2005.
The number of CYSHCN served by the Wisconsin SAS program increased more than 12 times
between 2005 and 2010. The method SAS programs use to identify CYSHCN has become more
uniform and efficient. Between 2007 and 2009, SAS programs used the Maternal and Child Health
Bureau definition for classifying CYSHCN as “those who have or are at increased risk for a chronic
physical, developmental, behavioral or emotional condition and who also require health and related
services of a type or amount beyond that required by children generally.” This broad definition did
not provide uniform criteria and left final determination up to individual clinicians and programs.
In 2010, Wisconsin SAS program collaborated with the DHS CYSHCN program. A six-question form
was developed and incorporated into all SAS program health histories, more accurately identifying
CYSHCN. The screening form was adapted from the CYSHCN Screener
©
, a validated screening tool
developed by the Child and Adolescent Health Measurement Initiative and specifically designed to
reflect the broad Maternal and Child Health Bureau definition of CYSHCN.
Additionally since 2008, the Alliance managed the Wisconsin Special Smiles program, which utilized
regional oral health coordinators to assist local SAS programs with treating CYSHCN. This program,
combined with improved methods of identifying CYSHCN, increased the number of CYSHCN seen
statewide in Wisconsin SAS programs.
11
0
500
1,000
1,500
2,000
2,500
3,000
3,500
2005 2006 2007 2008 2009 2010
CYSHCN served
School year
12
Key finding 3
The overall average cost per child to deliver sealants increased from $89.37 in 2005 to $110.49
in the 2010 school year.
Key finding 4
The average amount of Medicaid reimbursement each program received per child increased
from $17.40 in 2005 to $59.94 in the 2010 school year.
An increase in overall program cost is noted between 2005 and 2010. This can be attributed to the
large number of new programs and additional equipment purchased in the last two to three years,
which drives up the initial overall program cost. In addition, newer programs may not be as efficient
as those having been operational for longer periods of time. Overall program costs were not
collected in 2007. Since then, Wisconsin SAS has implemented a policy requiring all funded
programs to collect and report this data annually.
Aside from grant funding, Medicaid revenue continues to be the key tool in program sustainability.
Since 2007, when dental hygienists were able to become certified Medicaid providers, a significant
increase in Medicaid billing can be seen by programs statewide.
The SAS cost per child has remained steady over the past several years with little fluctuation. This
reflects the actual grant dollars per child utilized statewide in the program. Inkind support at the
program level fills the gap between Medicaid/grant funding and overall program cost.
Partnering to Seal-A-Smile 2012
$0.00
$20.00
$40.00
$60.00
$80.00
$100.00
$120.00
$140.00
2005 2006 2007 2008 2009 2010
Direct state funding
Medicaid reimbursement
Overall program cost
Program cost and reimbursement
School year
Partnering to Seal-A-Smile 2012
Key finding 5
The number of children screened and sealed between 2005 and 2010 increased significantly.
Key finding 6
The percentage of participating children with untreated decay decreased from 40.8 percent in
2005 to 35.4 percent in 2010.
Key finding 7
The proportion of children with urgent treatment needs decreased from 10.2 percent in 2005
to 8.1 percent in 2010.
Between 2005 and 2010, an increase in children screened and sealed annually can be noted in the
graph above. There was no funding increase between 2006 and 2008. The 2009 school year was the
first year the SAS program underwent major expansion due to an increase in HRSA funding
($241,000) and matching funds from Delta Dental in the same amount.
Due to existing dental disease in the target population, it is clear there is a need for earlier
interventions. The effectiveness of sealants is well-documented. Over time Wisconsin children
receiving this valuable intervention will be less likely to develop decay on any teeth sealed.
13
0
5,000
10,000
15,000
20,000
25,000
30,000
35,000
2005 2006 2007 2008 2009 2010
Children screened
Children with
untreated decay
Children sealed
Children with urgent
treatment needs
Seal-A-Smile annual ndings
Children
School year
14
Key finding 8
The number of children who received topical fluoride treatments increased from 3,304 in 2005,
to 23,499 in 2010.
The number of children who received fluoride as part of the SAS program increased substantially. In
2009, Wisconsin SAS implemented a policy requiring all funded programs to provide 2-3 fluoride
varnish applications to all participating children. This policy, coupled with the expansion of the SAS
program, contributed to the significant increase in children receiving topical fluoride treatments in
the last two years.
Partnering to Seal-A-Smile 2012
0
5,000
10,000
15,000
20,000
25,000
2005 2006 2007 2008 2009 2010
Gel/foam/other
Varnish
Children receiving uoride treatments
School year
Partnering to Seal-A-Smile 2012
Key finding 9
The proportion of children with either Medicaid or SCHIP (BadgerCare Plus) insurance coverage
participating in Wisconsin SAS increased from 53.4 percent in 2005 to 69.5 percent in 2010.
With the expansion of the BadgerCare Plus program across Wisconsin, along with increased efforts to
enroll eligible children, contributed to increases in the number of children covered by Medicaid.
Through a request from Delta Dental in 2010, SAS administrators were able to work with CDC to
better capture the insurance status of children participating in the SAS program. In 2010, programs
were able to breakdown the category of “private or no insurance” to specifically determine if a child
had private insurance or no insurance. In 2010, programs reported 30 percent of children were not
insured by Medicaid. It was further determined that approximately one in three children without
Medicaid had private insurance.
15
0%
20%
40%
60%
80%
100%
2005 2006 2007 2008 2009 2010
No insurance
Private insurance
Private or no insurance
Medicaid/SCHIP
School year
Insurance status
16
Key finding 10
The number of children who received oral health education through the SAS program has
increased nearly four times since the 2005 school year.
Most oral health education is provided chairside and tailored to individual patient needs. Therefore,
the increased number of children who received education correlates with the overall increase in
children served. Additionally, some programs provide classroom education to all children, regardless
if they receive preventive services or not.
Partnering to Seal-A-Smile 2012
0
5,000
10,000
15,000
20,000
25,000
30,000
35,000
40,000
2005 2006 2007 2008 2009 2010
Children receiving oral health education
School year
Partnering to Seal-A-Smile 2012
Key finding 11
Sealant retention rates for programs increased from 76.1 percent in 2005 to 92.9 percent in 2009.
Sealant retention rates have significantly increased from 2005-09. Rates for 2010 will be available in
fall 2012.
In 2008, a policy regarding the use of self-etch material was implemented as a result of the new
American Dental Association and CDC recommendations for school-based sealant programs.
Programs are no longer able to use self-etch products and have implemented tooth selection and
material selection protocols based on the new recommendations. These are possible contributing
factors to the improved retention rates being observed in SAS programs statewide.
In 2009, Wisconsin SAS implemented a policy to improve program evaluation. All programs are now
required to perform retention checks on at least 10 percent of all children seen at each school where
they provide service. Prior to 2009, some programs voluntarily provided retention checks.
17
0%
20%
40%
60%
80%
100%
2005 2006 2007 2008 2009 2010
Sealant retention rates
School year
18
Conclusion
Data in this report shows Wisconsin SAS programs have been able to significantly increase the
number of children served through existing program expansion and the development of new
programs. However, it also is evident the SAS program is only reaching a portion of school-age
children statewide. SAS administrators continually evaluate communities not being served by
school-based programs. Every attempt is made to develop new programs, or partner existing
programs with high-risk schools in those areas. In the 2012 state fiscal year, GPR funding has
increased by $250,000 to replace HRSA funding ending July 2012. Delta Dental will again match this
increase in 2012, allowing for nearly $600,000 in funding to be awarded to local programs.
Many of the recommendations in the 2009 Partnering to Seal-A-Smile report have been achieved.
• An increase in GPR funding will take place in the 2012 state fiscal year.
• All programs are now required to bill Medicaid to assist with sustainability.
• Some programs are now fully or near fully sustainable through Medicaid billing alone.
• All programs now provide retention checks on a sample of children to ensure program
integrity and evaluate performance.
Recommendations
• The state of Wisconsin maintain or increase the amount of SAS funding available through
GPR in future biennial budgets.
• The state of Wisconsin increase dental Medicaid reimbursement rates to help programs
achieve sustainability and increase access for restorative services.
• Programs continue to develop relationships with dentists to help serve children in need of
restorative care, following their participation in school-based programs.
• Programs increase early intervention strategies to reduce rising decay rates.
• Programs determine if recommended follow-up care was obtained.
• Programs use best practices to improve overall retention rates of sealants.
• Programs explore implementing a broader range of services that may include restorative
services.
• Programs continue providing services to an increased number of schools with high FRL rates.
• Programs continue reaching out and providing services to CYSHCN.
• Programs continue reducing the cost per child to deliver sealants by using best practices and
improving efficiency.
• Programs continue Medicaid billing efforts to maximize reimbursement.
• Programs continue to increase the number of children receiving oral health education both
in the classroom and chairside.
Partnering to Seal-A-Smile 2012
Partnering to Seal-A-Smile 2012
Testimonial
“I had a young patient come in to our clinic who had received sealants through the
Wisconsin Seal-A-Smile program. The sealants looked great, secondary grooves and
everything! Her mother was happy she received this care and that follow-up
information was sent home. Her mother also shared with me that her child came
home and was teaching her about teeth and was very excited to use the new
toothbrush she was given. I have had countless children and teachers come through
the clinic and say what a great program this is. I think this is one of the best programs
out there.
When I worked in private practice there was nothing I disliked more than extracting
permanent molars on a seven or eight-year-old because of extensive occlusal decay
and the parents unable to afford more expensive restorative care. You wouldn’t
believe how many molars you have saved.”
Tim Johnson, DDS
St. Croix Tribal Dental Clinic
19
20
Adams and Marquette Counties
Program title
Seal-A-Smile Program of Adams and Marquette Counties
Program inception
2000
Fiscal agent
Adams County Public Health Unit
Program notes
The program is coordinated by a dental hygienist contracted by the local public health department.
The coordinator provides oral exams, sealants, fluoride varnish applications and oral health
education. The program targets all children in second, third, fifth and sixth grade at area schools.
The program is administered by Adams County Public Health Department, but provides services in
both Adams and Marquette Counties. Currently, no other school-based or community oral health
programs exist in Adams or Marquette Counties. There are limited referral sources for restorative
care within a 50-mile radius. Collaborating partners include local dentists and schools.
Partnering to Seal-A-Smile 2012
Children served (2010-11)
Oral exams
Sealants
Fluoride treatment
Oral health education 46
44
38
46
Findings (2010-11)
Untreated decay
Urgent needs
Retention rate
95.5%
17.4%
47.8%
0
10
20
30
40
50
60
2005 2006 2007 2008 2009 2010
Oral exams
Sealants
School year
Children served
1
4
Schools served (2010-11)
<35%
35-50%
>50%
FRL status
No FRL
Barron, Burnett, Chippewa, Dunn, Polk, St. Croix
and Washburn Counties
Program title
Rural Health Dental Clinic (RHDC) Seal-A-Smile
Program inception
2001
Fiscal agent
Cooperative Educational Service Agency (CESA) #11
Program notes
The program is coordinated by a project manager at RHDC. A dental hygienist provides oral exams,
sealants, fluoride varnish applications and oral health education. RHDC has several mobile units
used to provide dental services across northwestern Wisconsin. The program targets all children at
area schools. The SAS program is a portion of RHDC’s overall oral health program that also serves
Head Start children, pregnant women and other low-income adults and seniors in rural Wisconsin.
Collaborating partners include local dental clinics, schools and public health departments.
Partnering to Seal-A-Smile 2012
21
Children served (2010-11)
Oral exams
Sealants
Fluoride treatment
Oral health education 1,122
1,773
788
1,777
Findings (2010-11)
Untreated decay
Urgent needs
Retention rate
n/a
9.1%
44.1%
Oral exams
Sealants
School year
Children served
0
200
400
600
800
1,000
1,200
1,400
1,600
1,800
2,000
2005 2006 2007 2008 2009 2010
<35%
35-50%
>50%
FRL status
No FRL
Schools served (2010-11)
8
22
20
3
22
Bayfield County
Program title
Superior Smiles
Program inception
2004
Fiscal agent
Bayfield County Health Department
Program notes
The program is coordinated by a dental hygienist at the local public health department. The
coordinator provides oral exams, sealants, fluoride varnish applications and oral health education.
Volunteer dentists provide follow-up treatment. The program targets all children in second and fifth
grade at area schools. The program is part of a larger oral health program administered by the health
department. Collaborating partners include area dental clinics, school districts, Head Start and
Women, Infants and Children (WIC). After the current school year, the program will no longer be
administered by the health department.
Partnering to Seal-A-Smile 2012
Children served (2010-11)
Oral exams
Sealants
Fluoride treatment
Oral health education 130
120
112
140
Findings (2010-11)
Untreated decay
Urgent needs
Retention rate
89.2%
3.6%
33.6%
Oral exams
Sealants
School year
Children served
0
20
40
60
80
100
120
140
160
2005 2006 2007 2008 2009 2010
Schools served (2010-11)
1
3
<35%
35-50%
>50%
FRL status
No FRL
Brown County
Program title
Brown County Oral Health Partnership Sealant Program
Program inception
1996
Fiscal agent
Brown County Oral Health Partnership (BCOHP)
Program notes
The program is coordinated by BCOHP. BCOHP collaborates with the local public health department,
who administered the program until 2008. A dentist provides oral exams. Dental hygienists and
dental hygiene students provide sealants, fluoride varnish applications and oral health education.
The program targets all children, without access to a dentist, at area schools. BCOHP is a non-profit
organization that provides complete preventive and restorative services in two community clinics
and area schools using portable equipment. The SAS program is only a portion of the vast oral
health services BCOHP provides in the Green Bay community. Collaborating partners include local
dentists, health departments, community clinics and the Boys and Girls Club.
Partnering to Seal-A-Smile 2012
23
Children served (2010-11)
Oral exams
Sealants
Fluoride treatment
Oral health education 1,386
1,088
1,098
1,098
Findings (2010-11)
Untreated decay
Urgent needs
Retention rate
87.8%
5.6%
44.2%
Oral exams
Sealants
School year
Children served
0
200
400
600
800
1,000
1,200
2005 2006 2007 2008 2009 2010
Schools served (2010-11)
1
14
<35%
35-50%
>50%
FRL status
No FRL
24
Buffalo County
Program title
Buffalo County Seal-A-Smile Program
Program inception
2009
Fiscal agent
Buffalo County Department of Health and Human Services
Program notes
The program is coordinated by a dental hygienist contracted by the local public health department.
The coordinator provides oral exams, sealants, fluoride varnish applications and oral health
education. The program targets all children in second and fifth grade at one area school. The Buffalo
County SAS program was developed in collaboration with an existing SAS program in Eau Claire and
Trempealeau Counties. Due to its small size, the program collaborates with neighboring counties to
utilize portable dental equipment.
Partnering to Seal-A-Smile 2012
Children served (2010-11)
Oral exams
Sealants
Fluoride treatment
Oral health education 56
120
11
13
Findings (2010-11)
Untreated decay
Urgent needs
Retention rate
92.7%
15.4%
23.1%
Oral exams
Sealants
School year
Children served
0
5
10
15
20
25
30
2009 2010
Schools served (2010-11)
1
<35%
35-50%
>50%
FRL status
No FRL