F as in Fat: How Obesity Threatens America’s Future 2012 ppt
Bạn đang xem bản rút gọn của tài liệu. Xem và tải ngay bản đầy đủ của tài liệu tại đây (5.03 MB, 124 trang )
SEPTEMBER 2012
Preventing ePidemics.
Protecting PeoPle.
ISSUE REPORT
2012
F as in Fat:
HOW OBESITY
THREATENS
AMERICA’S FUTURE
TFAH BOARD OF DIRECTORS
Gail Christopher, DN
President of the Board, TFAH
Vice President—Program Strategy
WK Kellogg Foundation
Cynthia M. Harris, PhD, DABT
Vice President of the Board, TFAH
Director and Professor
Institute of Public Health, Florida
A&M University
Theodore Spencer
Secretary of the Board, TFAH
Senior Advocate, Climate Center
Natural Resources Defense Council
Robert T. Harris, MD
Treasurer of the Board, TFAH
Former Chief Medical Officer and Senior
Vice President for Healthcare
BlueCross BlueShield of North Carolina
David Fleming, MD
Director of Public Health
Seattle King County, Washington
Arthur Garson, Jr., MD, MPH
Director, Center for Health Policy, University
Professor,
And Professor of Public Health Services
University of Virginia
John Gates, JD
Founder, Operator and Manager
Nashoba Brook Bakery
Alonzo Plough, MA, MPH, PhD
Director, Emergency Preparedness and Response
Program
Los Angeles County Department of
Public Health
Eduardo Sanchez, MD, MPH
Chief Medical Officer
Blue Cross Blue Shield of Texas
Jane Silver, MPH
President
Irene Diamond Fund
REPORT AUTHORS
Jeffrey Levi, PhD.
Executive Director
Trust for America’s Health and
Associate Professor in the Department of Health
Policy
The George Washington University
School of Public Health and Health Services
Laura M. Segal, MA
Director of Public Affairs
Trust for America’s Health
Rebecca St. Laurent, JD
Health Policy Research Manager
Trust for America’s Health
Albert Lang
Communications Manager
Trust for America’s Health
Jack Rayburn
Government Relations Representative
Trust for America’s Health
CONTRIBUTORS
Kathryn Thomas, MJ
Senior Communications Officer
Robert Wood Johnson Foundation
Laura C. Leviton, PhD.
Special Advisor for Evaluation
Robert Wood Johnson Foundation
Tina J. Kauh, MS, PhD.
Research and Evaluation Program Officer
Robert Wood Johnson Foundation
Chuck Alexander, MA
Senior Vice President, and Director, Public
Health Team
Burness Communications
Elizabeth Wenk, MA
Vice President
Burness Communications
Elizabeth Goodman, MS
Senior Associate
Burness Communications
Adam Zimmerman
Associate
Burness Communications
PEER REVIEWERS
Scott Kahn, MD, MPH
Co-Director
George Washington University Weight
Management Center;
and Faculty
Department of Health Policy of the
George Washington University School of
Public Health and Health Services
Monica Vinluan, JD
Project Director, Healthier Communities Initiatives
The Y
ACKNOWLEDGEMENTS
trust for AmericA’s HeAltH is a non-profit, non-partisan organization dedicated to saving lives by
protecting the health of every community and working to make disease prevention a national priority.
The Robert Wood Johnson Foundation focuses on the pressing health and health care issues facing our country. As the nation's largest phi-
lanthropy devoted exclusively to improving the health and health care of all Americans, the Foundation works with a diverse group of organiza-
tions and individuals to identify solutions and achieve comprehensive, meaningful and timely change. For 40 years the Foundation has brought
experience, commitment, and a rigorous, balanced approach to the problems that affect the health and health care of those it serves. When it
comes to helping Americans lead healthier lives and get the care they need, the Foundation expects to make a difference in your lifetime. For
more information, visit www.rwjf.org. Follow the Foundation on Twitter www.rwjf.org/twitter or Facebook www.rwjf.org/facebook.
This report was supported by the Robert Wood Johnson Foundation.
3
Introduction
The following is a letter from Risa Lavizzo-Mourey, MD, MBA, president and CEO of the Robert Wood
Johnson Foundation, and Jeff Levi, PhD, executive director of Trust for America’s Health.
T
he future health of the United States is at a crossroads, due in large part to
the obesity epidemic. Each year, the Trust for America’s Health (TFAH)
and the Robert Wood Johnson Foundation (RWJF) issue F as in Fat: How Obesity
Threatens America’s Future to examine strategies for addressing the obesity crisis. In
this ninth edition of the report, TFAH and RWJF also commissioned a new study to
look at how obesity could impact the future health and wealth of our nation.
This new analysis provides a picture of two pos-
sible futures for the health of Americans over
the next 20 years:
n If obesity rates continue on their current tra-
jectory, it’s estimated that:
s Obesity rates for adults could reach or ex-
ceed 44 percent in every state and exceed
60 percent in 13 states;
s The number of new cases of type 2 diabe-
tes, coronary heart disease and stroke, hy-
pertension and arthritis could increase 10
times between 2010 and 2020 — and then
double again by 2030; and
s Obesity-related health care costs could in-
crease by more than 10 percent in 43 states
and by more than 20 percent in nine states.
n But, if we could lower obesity trends by reduc-
ing the average adult BMI (body mass index)
by only 5 percent in each state, we could
spare millions of Americans from serious
health problems and save billions of dollars
in health spending — between 6.5 percent
and 7.8 percent in costs in almost every state.
1
As this year’s report details, we have seen impor-
tant inroads made toward preventing and reduc-
ing obesity around the country, especially among
children. We know that real changes are possible.
But we also have found that efforts will need to
be intensified if we are going to achieve a major
reduction in obesity and related health problems.
The promising results we see in some cities and
states pave the way for more intensive efforts.
Multiple studies and reports have demonstrated
that the cities and states that took an early and
comprehensive approach to preventing obesity
have demonstrated progress toward reversing
the epidemic. For instance, in California, over-
all rates of overweight and obesity among fifth-,
seventh- and ninth-graders decreased by 1.1 per-
cent from 2005 to 2010, and, in New York City,
obesity in grades K-8 decreased 5.5 percent from
2006-07 to 2010-11.
2, 3
In Mississippi, combined
rates of overweight and obesity among all pub-
lic elementary school students dropped from 43
percent in 2005 to 37.3 percent in 2011.
4
While these cases showed that pockets of prog-
ress are possible, they also showed that chil-
dren who face the biggest obstacles to healthy
choices and are at greatest risk for obesity, such
as children in lower-income families and Black
and Hispanic children, did not share equally in
progress. That’s why a study released just this
month tells the best story of all.
New data from Philadelphia show the city re-
duced obesity rates in ways that also helped to
close the disparities gap. In addition to achiev-
ing an overall decline in obesity rates among
public school students (from 21.5 percent of all
public school students in the 2006-2007 school
year to 20.5 percent in the 2009-2010 school
year), the city made the largest improvements
among Black male and Hispanic female stu-
dents. For Black male students, rates declined
from 20.66 percent to 19.08 percent, and rates
for Hispanic female students declined from
22.26 percent to 20.61 percent within the same
timeframe. We need to learn from the City of
Brotherly Love and spread the actions and poli-
cies that work so all children can enjoy the ben-
efits of better health.
These pockets of progress around the country
are showing the positive impact that many poli-
cies and programs are having — but they need
to be taken to scale. Fortunately, we know a lot
about what it will take to bend the obesity curve
in America.
4
n Stepping up the investment in evidence-based,
locally implemented prevention programs
could help achieve results. The U.S. Centers
for Disease Control and Prevention (CDC),
The New York Academy of Medicine (NYAM)
and others have identified a range of programs
that have proved effective in reducing obesity
and obesity-related disease levels by 5 percent
or — in some cases — more. For example,
a study of the Diabetes Prevention Program
found that randomly selected participants
reduced their diabetes risk by 16 percent for
every kilogram (a little more than 2 pounds,
3 ounces) of weight they lost over a follow-up
period of approximately three years. Another
study reported the effects of an educational
and mass media campaign developed by the
Heart Health Program in Pawtucket, R.I.
Five years into the intervention, the risks for
cardiovascular disease and coronary heart
disease also had decreased by 16 percent for
randomly selected participants.
5
n Recalibrating our goals could help us dra-
matically slow the national growth in obesity
rates by preventing adults from gaining addi-
tional weight (including individuals who are
currently obese, overweight and at a healthy
weight), and by preventing kids from becom-
ing overweight or obese in the first place.
The research shows that a strategy of primary
prevention that focuses on avoiding further
gain can help improve health and reduce
costs, and is a realistic and achievable goal.
For example, in 2010, researchers reviewed
36 studies of corporate wellness programs,
including those with successful weight-loss el-
ements, and calculated that employers saved
an average of $6 for every $1 spent. Research-
ers also noted that other benefits of such pro-
grams likely would include improved health.
6
F as in Fat is an annual reminder of how critical
it is to provide everyone living in our country,
particularly our nation’s children, with the op-
portunity to be as healthy as they can be. The
forecasting study in this year’s report demon-
strates what’s at stake.
If we take action, the number of Americans, par-
ticularly children, we could spare from type 2
diabetes, heart disease, cancer and other health
problems is striking, and the savings in health
care costs and increased productivity would
have a real and positive impact on the economy.
Investing in prevention today means a health-
ier, more productive and brighter future for our
country and our children.
BACKGROUND ON OBESITY AND BODY MASS INDEX (BMI)
Currently, more than 35 percent of adults are
obese.
7
Obesity is defined as an excessively high
amount of body fat or adipose tissue in relation
to lean tissue. An adult is considered obese if his
or her body mass index (BMI) is 30 or higher.
The new modeling study in this year’s
report projects what obesity rates and the
consequences for disease rates and health
care costs could be if the average state BMI
continued to grow based on current trends for
each state’s population over the next 20 years.
The study also forecasts what would happen
if average BMI in the state was reduced by 5
percent, which could translate to a 9 percent to
14 percent reduction in the states’ obesity rates
by 2030 depending on the state.
For example, on an individual level, reducing the
BMI of an average adult by 1 percent would be
equivalent to a weight loss of approximately 2.2
pounds.
8
According to the CDC, the average
American male over age 20 weighs 194.7
pounds and the average American woman over
age 20 weighs 164.7 pounds.
9
5
CHILDHOOD OBESITY: WHAT’S AT STAKE
Childhood obesity rates have climbed dramati-
cally in the past 30 years. In 1980, the obesity
rate for children ages 6 to 11 was 6.5 percent.
By 2008, the rate grew to 19.6 percent. And,
in 1980, 5 percent of teens ages 12 to 19 were
obese. That rate climbed to 17 percent (approxi-
mately 12.5 million children and teens) by 2010.
10
This change is having a major impact on the
health of children and youths. If we don’t reverse
the epidemic, the current generation of young
people could be the first in U.S. history to live
sicker and die younger than their parents’ genera-
tion. Nearly one-third of children and teens are
currently obese or overweight, which is putting
them at higher risks for developing a range of dis-
eases and developing them earlier in life.
11
Children who are obese are more than twice
as likely to die before the age of 55 as children
whose BMI is in the healthy range.
12
Around
70 percent of obese youths have at least one
additional risk factor for cardiovascular disease,
such as elevated total cholesterol, triglycerides,
insulin or blood pressure.
13
Overweight and
obese children and teens also are at higher risk
for other health conditions, including asthma
and sleep-disordered breathing.
14, 15
Children
who are obese after the age of 6 are 50 percent
more likely to be obese as adults, and among
overweight tweens and teens ages 10 to 15, 80
percent were obese at age 25.
16, 17
Being obese or overweight also can have a major
social and emotional impact on children and
youths. For instance, studies have found that
overweight and obese children and teens face a
higher risk for more severe and frequent bully-
ing, are rejected by their peers more often, are
chosen less as friends and are generally not as
well-liked as healthy-weight children. Studies also
have found that weight-based teasing is related to
increased susceptibility to depression.
18, 19, 20
Reducing and preventing childhood obesity is
critical to improving the future health of the
country, and consequently would help to lower
health care costs and improve productivity.
What’s more, research supports the concept
that focusing on children and getting them on
a healthy path early in life is one of the areas
where the greatest successes can be achieved.
For instance, a recent study from the American
Journal of Preventive Medicine found that eliminat-
ing just 41 calories a day per person could halt ris-
ing body weight trends in children and teens ages
2 to 19, and eliminating 161 calories per day per
person could reduce childhood obesity to 5 per-
cent by 2020.
21
Researchers have created a tool
to help estimate the impact of nutrition or physi-
cal activity interventions on specific populations.
The tool is available at .
Programs around the country are helping to change
our culture to encourage healthier nutrition and in-
creased physical activity. Some areas where there
have been concerted efforts to prevent and reduce
childhood obesity are demonstrating promising
results. Initiatives ranging from Let’s Move to the
Alliance for a Healthier Generation to the Y are all
having an impact and leading to positive change.
Reversing the childhood obesity crisis is at the
core of the future health and wealth of the
country. The evidence shows that the goal is
achievable, but only if there is a sufficient invest-
ment in effective programs and policies.
SECTION 1: Obesity Rates and Trends 9
A. Adult obesity and overweight rates 9
B. Childhood and youth obesity and overweight rates 17
SECTION 2: Two Futures for America’s Health 23
A. Key Findings 25
B. Five Top Obesity-Related Health Issues 33
1. Type 2 Diabetes and Obesity 33
2. Coronary Heart Disease and Stroke and Obesity 36
3. Hypertension and Obesity 38
4. Arthritis and Obesity 40
5. Obesity-Related Cancer and Obesity 42
C. Some Additional Health and Obesity Issues 45
1. Maternal Health and Obesity 45
2. Breastfeeding and Obesity Prevention 46
3. Mental Health, Neurological Conditions and Obesity 48
4. Kidney Disease and Obesity. . . . . . . . . . . . . . . . . . . . . . . . . . . . . . . . . . . . . . . . . . . . .49
5. Liver Disease and Obesity 49
6. HIV/AIDS and Obesity 50
SECTION 3: Strategies and Policy Approaches to Reducing Obesity,
Improving Nutrition and Increasing Activity 51
A. State Responsibilities and Policies 51
1. Obesity-Related Legislation for Healthy Schools 52
2. Obesity-Related Legislation for Healthy Communities 63
B. Federal Policies and Programs 69
C. Examples of Prevention in Action 75
1. Small Businesses 78
2. Faith-Based Organizations 83
3. Schools 88
SECTION 4: Conclusions and Recommendations 95
Appendix A: Physical Activity and Nutrition Trends. . . . . . . . . . . . . . . . . . . . 102
Appendix B: Methodologies for Rates and Trends 109
Appendix C: Methodologies for 2020 and 2030 Modeling Projections 111
7
8
F AS IN FAT 2012 MAJOR FINDINGS
In August 2012, the Centers for Disease Control and Prevention released the latest rates of adult
obesity in the United States. In 2011:
n Twelve states had an adult obesity rate above 30 percent.
n Mississippi had the highest rate of obesity at 34.9 percent, while Colorado had the lowest rate at
20.7 percent.
n Twenty-six of the 30 states with the highest obesity rates are in the Midwest and South.
n All 10 of the states with the highest rates of type 2 diabetes and hypertension are in the South.
TWO FUTURES FOR AMERICA’S HEALTH: PROJECTIONS FOR OBESITY,
DISEASES AND COSTS
The new analysis commissioned by TFAH and RWJF, and conducted by the National Heart
Forum (NHF) was based on a peer-reviewed model published in The Lancet. The analysis includes
projections for potential rates of obesity, health problems and health care costs in the year 2030 if
current trends continued, and it examined how reducing the average body mass index (BMI) in the
state by 5 percent could lower obesity rates and decrease costs.
22
2030: Obesity on Current Track 2030: BMI Reduced by 5 Percent
Obesity Rates n More than 60 percent of people could
be obese in 13 states;
n More than half of people could be
obese in 39 states;
n In all 50 states, more than 44 percent
of people could be obese.
n No state would have an obesity rate
above 60 percent;
n More than half of people would be
obese in 24 states;
n Two states would have obesity rates
under 40 percent.
Obesity-Related
Disease Rates
By 2030, for every 100,000 people, the
number of new Americans who could
develop the five top diseases associated
with obesity could range from:
n Between 8,658 in Utah to 15,208 in
West Virginia (average for all states:
12,127) for new cases of type 2 diabetes
n Between 16,730 in Utah to 35,519 in
West Virginia (average for all states:
26,573) for new cases of coronary
heart disease and stroke
n Between 17,790 in Utah to 30,508 in
Maine (average for all states: 24,923)
for new cases of hypertension
n Between 12,504 in Utah to 18,725 in
Maine (average for all states: 16,152)
for new cases of arthritis
n Between 2,468 in Utah to 4,897 in
Maine (average for all states: 3,781) for
new cases of obesity-related cancer
Thousands of cases of type 2 diabetes,
coronary heart disease and stroke,
hypertension and arthritis could be
avoided in all states;
More than 100 cases of obesity-related
cancer per 100,000 people could be
prevented in all states;
States could avoid — per 100,000 people:
n Between 1,810 and 3,213 new cases of
type 2 diabetes
n Between 1,427 and 2,512 new cases of
hypertension
n Between 1,339 and 2,898 new cases of
coronary heart disease and stroke
n Between 849 and 1,382 new cases of
arthritis
n Between 101 and 277 new cases of
cancer.
Obesity-Related
Health Care
Costs
n Nine states could see increases of
more than 20 percent;
n 16 states and Washington, D.C., could
expect increases between 15-20 percent;
n 18 states could expect increases
between 10-15 percent;
n Only seven states could have increases
lower than 10 percent.
n Every state except Florida would
save between 6.5 and 7.8 percent on
obesity-related health costs compared
with 2030 projected costs if rates
continue to increase at their current
pace. (Florida would save 2.1 percent).
9
DC
WA
NV
AZ
CO
NE
ND
MN
WI
IL
KY
VA
NY
HI
MD
DC
DE
NJ
NH
VT
MA
RI
CT
NC
LA
AR
MS AL
SD
KS
MO
TN
GA
SC
FL
IN OH
WV
PA
ME
MI
IA
OK
TX
NM
OR
ID
MT
WY
UT
AK
CA
Obesity Rates and
Related Trends
M
ore than two-thirds (68 percent) of American adults are either overweight
or obese.
23
Adult obesity rates have more than doubled — from 15 percent
in 1980 to 35 percent in 2010, based on a national survey.
24, 25
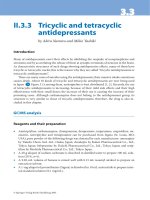
A. ADULT OBESITY AND OVERWEIGHT RATES
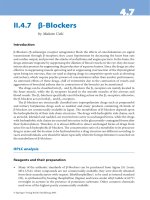
2011 Obesity Rates
Rates of obesity among children ages 2–19 have
more than tripled since 1980.
26,27
According to
the most recent National Health and Nutrition
Examination Survey (NHANES), 16.9 percent
of children ages 2–19 are obese, and 31.7 per-
cent are overweight or obese.
28
This translates
to more than 12 million children and adoles-
cents who are obese and more than 23 million
who are either obese or overweight. Research-
ers at the U.S. Centers for Disease Control and
Prevention (CDC) report that, during the pe-
riod between 1999 and 2008, there was no sta-
tistically significant change in the number of
children and adolescents with high BMI-for-age,
except among the very heaviest boys ages 6–19.
29
In August 2012, CDC released the latest rates of
obesity in the states. Twelve states currently have
an adult obesity rate over 30 percent. Mississippi
had the highest rate of obesity at 34.9 percent,
while Colorado had the lowest rate at 20.7 per-
cent. Twenty-six of the 30 states with the highest
rates of obesity are in the South and Midwest.
Northeastern and Western states comprise most
of the states with the lowest rates of obesity.
The U.S. Department of Health and Human
Services (HHS) set a national goal to reduce
adult obesity rates to 30 percent in every state
by the year 2020. Healthy People 2020 also sets
a goal of increasing the percentage of people at
a healthy weight (BMI <25) from 30.8 percent
to 33.9 percent by 2020.
1
SECTION
n <25%
n >25% & <30%
n >30%
10
CHART ON OBESITY AND OVERWEIGHT RATES AND RELATED HEALTH INDICATORS IN THE STATES
ADULTS CHILDREN AND ADOLESCENTS
Obesity
Overweight &
Obese
Diabetes Physical Inactivity Hypertension
2011 YRBS 2010 PedNSS 2007 National Survey of Children’s Health
States
2011 Percentage
(95% Conf Interval)
Ranking
2011 Percentage
(95% Conf Interval)
2011 Percentage
(95% Conf Interval)
Ranking
2011 Percentage
(95% Conf Interval)
Ranking
2011 Percentage
(95% Conf Interval)
Ranking
States
Percentage of
Obese High School
Students (95%
Conf Interval)
Percentage of
Overweight High
School Students
(95% Conf Interval)
Percentage of High School
Students Who Were
Physically Active At Least
60 Minutes on All 7 Days
Percentage of
Obese Low-Income
Children Ages 2-5
Percentage of
Overweight and
Obese Children
Ages 10-17
Ranking
Percentage Participating in
Vigorous Physical Activity
Every Day Ages 6-17
Alabama 32.0% (+/- 1.5) 4 66.8% (+/- 1.6) 11.8% (+/- 0.9) 4 32.6% (+/- 1.6) 5 40.0% (+/- 1.6) 1 Alabama 17.0 (+/- 3.9) 15.8 (+/- 3.0) 28.4 (+/- 4.3) 14.1% 36.1% (+/- 4.6) 6 36.5%
Alaska 27.4% (+/- 2.2) 28 66.5% (+/- 2.4) 7.9% (+/- 1.4) 46 22.0% (+/- 2.0) 41 29.4% (+/- 2.1) 37 Alaska 11.5 (+/- 2.0) 14.4 (+/- 2.1) 21.3 (+/- 2.8) N/A 33.9% (+/- 4.4) 12 30.4%
Arizona 24.7% (+/- 2.1) 40 62.5% (+/- 2.4) 9.5% (+/- 1.3) 25 24.2% (+/- 2.2) 34 28.0% (+/- 2.0) 47 Arizona 10.9 (+/- 1.9) 13.9 (+/- 1.8) 25.0 (+/- 2.0) 14.2% 30.6% (+/- 4.9) 26 28.5%
Arkansas 30.9% (+/- 2.2) 7 65.0% (+/- 2.3) 11.2% (+/- 1.2) 6 30.9% (+/- 2.1) 7 35.7% (+/- 2.1) 8 Arkansas 15.2 (+/- 2.1) 15.4 (+/- 2.1) 26.7 (+/- 3.3) 14.1% 37.5% (+/- 4.2) 2 30.7%
California 23.8% (+/- 0.9) 46 60.2% (+/- 1.1) 8.9% (+/- 0.6) 34 19.1% (+/- 0.9) 49 27.8% (+/- 0.9) 48 California N/A N/A N/A 17.2% 30.5% (+/- 6.4) 28 30.0%
Colorado 20.7% (+/- 1.1) 51 56.1% (+/- 1.3) 6.7% (+/- 0.6) 50 16.5% (+/- 1.0) 51 24.9% (+/- 1.0) 50 Colorado 7.3 (+/- 2.4) 10.7 (+/- 2.5) 29.2 (+/- 2.8) 9.1% 27.2% (+/- 5.1) 42 27.6%
Connecticut 24.5% (+/- 1.5) 42 59.6% (+/- 1.8) 9.3% (+/- 0.9) 31 25.3% (+/- 1.6) 28 29.7% (+/- 1.5) 36 Connecticut 12.5 (+/- 2.7) 14.1 (+/- 1.9) 26.0 (+/- 3.1) 15.8% 25.7% (+/- 3.7) 45 22.1%
Delaware 28.8% (+/- 1.9) 19 63.9% (+/- 2.2) 9.7% (+/- 1.1) 22 27.0% (+/- 1.9) 13 34.6% (+/- 1.9) 10 Delaware 12.2 (+/- 1.5) 16.9 (+/- 2.1) 24.9 (+/- 2.1) N/A 33.2% (+/- 4.1) 16 31.1%
D.C. 23.7% (+/- 1.9) 47 52.8% (+/- 2.4) 9.1% (+/- 1.1) 33 19.8% (+/- 1.8) 47 29.9% (+/- 2.0) 33 D.C. N/A N/A N/A 13.7% 35.4% (+/- 4.8) 9 26.3%
Florida 26.6% (+/- 1.3) 32 63.4% (+/- 1.4) 10.4% (+/- 0.8) 11 26.9% (+/- 1.3) 16 34.2% (+/- 1.3) 12 Florida 11.5 (+/- 2.3) 13.6 (+/- 1.1) 25.8 (+/- 1.4) 13.4% 33.1% (+/- 6.1) 17 34.1%
Georgia 28.0% (+/- 1.4) 24 62.7% (+/- 1.6) 10.1% (+/- 0.7) 18 26.8% (+/- 1.4) 18 32.3% (+/- 1.3) 18 Georgia 15.0 (+/- 2.3) 15.8 (+/- 2.2) 25.2 (+/- 3.0) 13.5% 37.3% (+/- 5.6) 3 29.4%
Hawaii 21.8% (+/- 1.5) 50 55.8% (+/- 1.8) 8.4% (+/- 0.8) 38 21.3% (+/- 1.5) 45 28.7% (+/- 1.5) 43 Hawaii 13.2 (+/- 2.4) 13.4 (+/- 1.6) 21.0 (+/- 2.3) 9.1% 28.5% (+/- 4.1) 37 28.0%
Idaho 27.0% (+/- 1.8) 30 62.3% (+/- 2.1) 9.4% (+/- 1.0) 29 21.4% (+/- 1.7) 44 29.4% (+/- 1.7) 37 Idaho 9.2 (+/- 1.6) 13.4 (+/- 1.8) 25.9 (+/- 3.4) 11.4% 27.5% (+/- 3.9) 41 25.0%
Illinois 27.1% (+/- 1.8) 29 64.1% (+/- 2.0) 9.7% (+/- 1.1) 22 25.2% (+/- 1.7) 31 31.0% (+/- 1.8) 24 Illinois 11.6 (+/- 1.7) 14.5 (+/- 1.7) 23.2 (+/- 2.3) 14.6% 34.9% (+/- 4.1) 10 26.1%
Indiana 30.8% (+/- 1.4) 8 65.7% (+/- 1.5) 10.2% (+/- 0.8) 15 29.3% (+/- 1.4) 9 32.7% (+/- 1.3) 15 Indiana 14.7 (+/- 1.8) 15.5 (+/- 2.1) 24.2 (+/- 2.7) 14.2% 29.9% (+/- 4.3) 31 31.3%
Iowa 29.0% (+/- 1.4) 18 64.8% (+/- 1.5) 8.2% (+/- 0.7) 43 25.9% (+/- 1.3) 27 29.9% (+/- 1.3) 33 Iowa 13.2 (+/- 3.2) 14.5 (+/- 2.0) 29.1 (+/- 3.3) 14.7% 26.5% (+/- 4.3) 44 27.8%
Kansas 29.6% (+/- 0.9) 13 64.4% (+/- 0.9) 9.5% (+/- 0.5) 25 26.8% (+/- 0.8) 18 30.8% (+/- 0.8) 27 Kansas 10.2 (+/- 1.5) 13.9 (+/- 1.8) 30.2 (+/- 2.5) 13.0% 31.1% (+/- 4.2) 22 25.2%
Kentucky 30.4% (+/- 1.5) 10 66.6% (+/- 1.6) 10.8% (+/- 0.8) 9 29.4% (+/- 1.5) 8 37.9% (+/- 1.5) 5 Kentucky 16.5 (+/- 2.5) 15.4 (+/- 1.6) 21.9 (+/- 2.5) 15.6% 37.1% (+/- 4.1) 4 25.9%
Louisiana 33.4% (+/- 1.5) 2 67.6% (+/- 1.5) 11.8% (+/- 0.9) 4 33.8% (+/- 1.5) 4 38.3% (+/- 1.4) 4 Louisiana 16.1 (+/- 2.6) 19.5 (+/- 4.5) 24.2 (+/- 3.5) 12.5% 35.9% (+/- 4.6) 7 34.0%
Maine 27.8% (+/- 1.1) 25 65.0% (+/- 1.2) 9.6% (+/- 0.6) 24 23.0% (+/- 1.0) 38 32.2% (+/- 1.0) 19 Maine 11.5 (+/- 1.4) 14.0 (+/- 1.1) 23.7 (+/- 1.7) 14.3% 28.2% (+/- 3.8) 39 32.7%
Maryland 28.3% (+/- 1.4) 22 64.4% (+/- 1.6) 9.4% (+/- 0.8) 29 26.1% (+/- 1.4) 26 31.3% (+/- 1.4) 21 Maryland 12.0 (+/- 1.7) 15.4 (+/- 2.0) 21.4 (+/- 2.8) 15.7% 28.8% (+/- 4.2) 36 30.7%
Massachusetts 22.7% (+/- 1.0) 49 59.4% (+/- 1.2) 8.0% (+/- 0.5) 45 23.5% (+/- 1.0) 37 29.2% (+/- 1.0) 40 Massachusetts 9.9 (+/- 1.8) 14.6 (+/- 1.4) 22.4 (+/- 2.6) 16.1% 30.0% (+/- 4.6) 30 26.6%
Michigan 31.3% (+/- 1.3) 5 65.5% (+/- 1.4) 10.0% (+/- 0.8) 19 23.6% (+/- 1.2) 36 34.2% (+/- 1.3) 12 Michigan 12.1 (+/- 1.6) 15.3 (+/- 2.4) 27.0 (+/- 2.7) 13.3% 30.6% (+/- 4.3) 26 33.1%
Minnesota 25.7% (+/- 1.1) 36 62.5% (+/- 1.2) 7.3% (+/- 0.6) 49 21.8% (+/- 1.0) 43 26.3% (+/- 1.0) 49 Minnesota N/A N/A N/A 12.7% 23.1% (+/- 4.0) 50 34.8%
Mississippi 34.9% (+/- 1.4) 1 68.9% (+/- 1.5) 12.3% (+/- 0.8) 1 36.0% (+/- 1.5) 1 39.2% (+/- 1.4) 2 Mississippi 15.8 (+/- 2.2) 16.5 (+/- 2.0) 25.9 (+/- 3.0) 13.7% 44.4% (+/- 4.3) 1 29.0%
Missouri 30.3% (+/- 1.7) 12 64.8% (+/- 1.8) 10.2% (+/- 1.0) 15 28.5% (+/- 1.6) 10 34.3% (+/- 1.6) 11 Missouri N/A N/A N/A 13.6% 31.0% (+/- 4.1) 23 29.6%
Montana 24.6% (+/- 1.4) 41 60.3% (+/- 1.5) 7.9% (+/- 0.7) 46 24.4% (+/- 1.3) 33 30.1% (+/- 1.3) 31 Montana 8.5 (+/- 1.1) 12.9 (+/- 1.4) 28.7 (+/- 1.9) 12.2% 25.6% (+/- 3.7) 48 31.5%
Nebraska 28.4% (+/- 0.8) 21 64.9% (+/- 0.9) 8.4% (+/- 0.5) 38 26.3% (+/- 0.8) 22 28.5% (+/- 0.8) 45 Nebraska 11.6 (+/- 1.2) 13.6 (+/- 1.3) 28.0 (+/- 1.8) 13.8% 31.5% (+/- 4.6) 21 26.2%
Nevada 24.5% (+/- 2.1) 42 60.3% (+/- 2.4) 10.4% (+/- 1.6) 11 24.1% (+/- 2.2) 35 30.9% (+/- 2.2) 25 Nevada N/A N/A N/A 13.6% 34.2% (+/- 5.4) 11 24.4%
New Hampshire 26.2% (+/- 1.5) 35 61.6% (+/- 1.8) 8.7% (+/- 0.8) 37 22.5% (+/- 1.5) 40 30.6% (+/- 1.5) 28 New Hampshire 12.1 (+/- 1.7) 14.1 (+/- 2.2) N/A 14.2% 29.4% (+/- 3.9) 35 29.0%
New Jersey 23.7% (+/- 1.1) 47 61.5% (+/- 1.3) 8.8% (+/- 0.6) 36 26.4% (+/- 1.1) 21 30.6% (+/- 1.1) 28 New Jersey 11.0 (+/- 2.0) 15.2 (+/- 1.9) 28.0 (+/- 2.8) 17.3% 31.0% (+/- 4.5) 23 29.1%
New Mexico 26.3% (+/- 1.3) 34 62.3% (+/- 1.4) 10.0% (+/- 0.8) 19 25.3% (+/- 1.3) 28 28.5% (+/- 1.2) 45 New Mexico 12.8 (+/- 2.1) 14.4 (+/- 1.2) 26.3 (+/- 1.6) 11.7% 32.7% (+/- 5.0) 19 27.0%
New York 24.5% (+/- 1.4) 42 60.5% (+/- 1.6) 10.4% (+/- 0.9) 11 26.2% (+/- 1.4) 24 30.6% (+/- 1.4) 28 New York 11.0 (+/- 1.3) 14.7 (+/- 1.0) 25.1 (+/- 2.4) 14.5% 32.9% (+/- 4.4) 18 27.6%
North Carolina 29.1% (+/- 1.5) 17 65.2% (+/- 1.5) 10.8% (+/- 0.8) 9 26.7% (+/- 1.4) 20 32.4% (+/- 1.3) 17 North Carolina 12.9 (+/- 3.2) 15.9 (+/- 2.0) 26.0 (+/- 2.4) 15.5% 33.5% (+/- 4.5) 14 38.5%
North Dakota 27.8% (+/- 1.6) 25 63.8% (+/- 1.9) 8.3% (+/- 0.8) 42 27.0% (+/- 1.6) 13 28.9% (+/- 1.5) 41 North Dakota 11.0 (+/- 1.7) 14.5 (+/- 2.1) 21.8 (+/- 1.9) 14.1% 25.7% (+/- 3.3) 45 27.1%
Ohio 29.6% (+/- 1.4) 13 65.8% (+/- 1.4) 10.0% (+/- 0.8) 19 27.0% (+/- 1.3) 13 32.7% (+/- 1.3) 15 Ohio 14.7 (+/- 3.1) 15.3 (+/- 2.3) 25.4 (+/- 3.5) 12.4% 33.3% (+/- 4.7) 15 32.1%
Oklahoma 31.1% (+/- 1.4) 6 65.4% (+/- 1.5) 11.1% (+/- 0.8) 8 31.2% (+/- 1.4) 6 35.5% (+/- 1.4) 9 Oklahoma 16.7 (+/- 3.0) 16.3 (+/- 2.8) 33.1 (+/- 4.1) N/A 29.5% (+/- 4.1) 33 29.6%
Oregon 26.7% (+/- 1.6) 31 61.6% (+/- 1.7) 9.3% (+/- 0.9) 31 19.7% (+/- 1.5) 48 29.8% (+/- 1.5) 35 Oregon N/A N/A N/A 15.1% 24.3% (+/- 3.9) 49 27.9%
Pennsylvania 28.6% (+/- 1.3) 20 64.5% (+/- 1.4) 9.5% (+/- 0.7) 25 26.3% (+/- 1.2) 22 31.4% (+/- 1.2) 20 Pennsylvania N/A N/A N/A 12.0% 29.7% (+/- 4.8) 32 35.4%
Rhode Island 25.4% (+/- 1.6) 37 62.5% (+/- 1.8) 8.4% (+/- 0.8) 38 26.2% (+/- 1.5) 24 33.0% (+/- 1.5) 14 Rhode Island 10.8 (+/- 2.3) 14.9 (+/- 2.1) 26.7 (+/- 4.0) 15.5% 30.1% (+/- 4.2) 29 27.6%
South Carolina 30.8% (+/- 1.3) 8 65.9% (+/- 1.4) 12.0% (+/- 0.8) 3 27.2% (+/- 1.3) 11 36.4% (+/- 1.3) 7 South Carolina 13.3 (+/- 3.0) 16.3 (+/- 2.6) 25.8 (+/- 2.9) 12.8% 33.7% (+/- 4.2) 13 31.2%
South Dakota 28.1% (+/- 1.9) 23 64.5% (+/- 2.2) 9.5% (+/- 1.1) 25 26.9% (+/- 2.0) 16 30.9% (+/- 1.9) 25 South Dakota 9.8 (+/- 2.0) 14.1 (+/- 1.4) 27.3 (+/- 3.5) 16.1% 28.4% (+/- 3.9) 38 25.3%
Tennessee 29.2% (+/- 2.5) 15 66.5% (+/- 2.8) 11.2% (+/- 1.5) 6 35.2% (+/- 2.7) 2 38.6% (+/- 2.6) 3 Tennessee 15.2 (+/- 1.6) 17.3 (+/- 1.9) 30.2 (+/- 2.8) 14.5% 36.5% (+/- 4.3) 5 29.8%
Texas 30.4% (+/- 1.4) 10 65.9% (+/- 1.5) 10.2% (+/- 0.8) 15 27.2% (+/- 1.3) 11 31.3% (+/- 1.3) 21 Texas 15.6 (+/- 2.0) 16.0 (+/- 1.4) 27.1 (+/- 2.7) 15.3% 32.2% (+/- 5.6) 20 28.9%
Utah 24.4% (+/- 1.1) 45 58.9% (+/- 1.3) 6.7% (+/- 0.5) 50 18.9% (+/- 1.0) 50 22.9% (+/- 0.9) 51 Utah 8.6 (+/- 1.7) 12.2 (+/- 2.0) 20.8 (+/- 2.6) 8.7% 23.1% (+/- 4.2) 50 17.6%
Vermont 25.4% (+/- 1.4) 37 59.8% (+/- 1.6) 7.7% (+/- 0.7) 48 21.0% (+/- 1.3) 46 29.3% (+/- 1.4) 39 Vermont 9.9 (+/- 2.0) 13.0 (+/- 1.7) 24.4 (+/- 1.6) 12.2% 26.7% (+/- 4.5) 43 36.6%
Virginia 29.2% (+/- 1.7) 15 63.4% (+/- 1.9) 10.4% (+/- 1.1) 11 25.0% (+/- 1.0) 32 31.2% (+/- 1.6) 23 Virginia 11.1 (+/- 2.5) 17.2 (+/- 2.7) 24.1 (+/- 4.0) 15.5% 31.0% (+/- 4.2) 23 26.2%
Washington 26.5% (+/- 1.2) 33 61.0% (+/- 1.4) 8.9% (+/- 0.7) 34 21.9% (+/- 1.2) 42 30.1% (+/- 1.2) 31 Washington N/A N/A N/A 14.4% 29.5% (+/- 5.0) 33 27.6%
West Virginia 32.4% (+/- 1.6) 3 69.0% (+/- 1.7) 12.1% (+/- 1.0) 2 35.1% (+/- 1.6) 3 37.1% (+/- 1.6) 6 West Virginia 14.6 (+/- 2.4) 15.7 (+/- 2.4) 29.0 (+/- 3.2) 13.7% 35.5% (+/- 3.9) 8 33.2%
Wisconsin 27.7% (+/- 2.0) 27 64.1% (+/- 2.2) 8.4% (+/- 1.0) 38 22.6% (+/- 1.8) 39 28.9% (+/- 1.8) 41 Wisconsin 10.4 (+/- 1.6) 15.0 (+/- 1.5) 27.7 (+/- 3.6) 14.1% 27.9% (+/- 3.8) 40 28.5%
Wyoming 25.0% (+/- 1.6) 39 61.2% (+/- 1.8) 8.2% (+/- 1.0) 43 25.3% (+/- 1.6) 28 28.7% (+/- 1.6) 43 Wyoming 11.1 (+/- 1.4) 12.0 (+/- 1.6) 25.8 (+/- 2.1) N/A 25.7% (+/- 4.0) 45 29.8%
Source: Behavior Risk Factor Surveillance System (BRFSS), CDC.
11
CHART ON OBESITY AND OVERWEIGHT RATES AND RELATED HEALTH INDICATORS IN THE STATES
ADULTS CHILDREN AND ADOLESCENTS
Obesity
Overweight &
Obese
Diabetes Physical Inactivity Hypertension
2011 YRBS 2010 PedNSS 2007 National Survey of Children’s Health
States
2011 Percentage
(95% Conf Interval)
Ranking
2011 Percentage
(95% Conf Interval)
2011 Percentage
(95% Conf Interval)
Ranking
2011 Percentage
(95% Conf Interval)
Ranking
2011 Percentage
(95% Conf Interval)
Ranking
States
Percentage of
Obese High School
Students (95%
Conf Interval)
Percentage of
Overweight High
School Students
(95% Conf Interval)
Percentage of High School
Students Who Were
Physically Active At Least
60 Minutes on All 7 Days
Percentage of
Obese Low-Income
Children Ages 2-5
Percentage of
Overweight and
Obese Children
Ages 10-17
Ranking
Percentage Participating in
Vigorous Physical Activity
Every Day Ages 6-17
Alabama 32.0% (+/- 1.5) 4 66.8% (+/- 1.6) 11.8% (+/- 0.9) 4 32.6% (+/- 1.6) 5 40.0% (+/- 1.6) 1 Alabama 17.0 (+/- 3.9) 15.8 (+/- 3.0) 28.4 (+/- 4.3) 14.1% 36.1% (+/- 4.6) 6 36.5%
Alaska 27.4% (+/- 2.2) 28 66.5% (+/- 2.4) 7.9% (+/- 1.4) 46 22.0% (+/- 2.0) 41 29.4% (+/- 2.1) 37 Alaska 11.5 (+/- 2.0) 14.4 (+/- 2.1) 21.3 (+/- 2.8) N/A 33.9% (+/- 4.4) 12 30.4%
Arizona 24.7% (+/- 2.1) 40 62.5% (+/- 2.4) 9.5% (+/- 1.3) 25 24.2% (+/- 2.2) 34 28.0% (+/- 2.0) 47 Arizona 10.9 (+/- 1.9) 13.9 (+/- 1.8) 25.0 (+/- 2.0) 14.2% 30.6% (+/- 4.9) 26 28.5%
Arkansas 30.9% (+/- 2.2) 7 65.0% (+/- 2.3) 11.2% (+/- 1.2) 6 30.9% (+/- 2.1) 7 35.7% (+/- 2.1) 8 Arkansas 15.2 (+/- 2.1) 15.4 (+/- 2.1) 26.7 (+/- 3.3) 14.1% 37.5% (+/- 4.2) 2 30.7%
California 23.8% (+/- 0.9) 46 60.2% (+/- 1.1) 8.9% (+/- 0.6) 34 19.1% (+/- 0.9) 49 27.8% (+/- 0.9) 48 California N/A N/A N/A 17.2% 30.5% (+/- 6.4) 28 30.0%
Colorado 20.7% (+/- 1.1) 51 56.1% (+/- 1.3) 6.7% (+/- 0.6) 50 16.5% (+/- 1.0) 51 24.9% (+/- 1.0) 50 Colorado 7.3 (+/- 2.4) 10.7 (+/- 2.5) 29.2 (+/- 2.8) 9.1% 27.2% (+/- 5.1) 42 27.6%
Connecticut 24.5% (+/- 1.5) 42 59.6% (+/- 1.8) 9.3% (+/- 0.9) 31 25.3% (+/- 1.6) 28 29.7% (+/- 1.5) 36 Connecticut 12.5 (+/- 2.7) 14.1 (+/- 1.9) 26.0 (+/- 3.1) 15.8% 25.7% (+/- 3.7) 45 22.1%
Delaware 28.8% (+/- 1.9) 19 63.9% (+/- 2.2) 9.7% (+/- 1.1) 22 27.0% (+/- 1.9) 13 34.6% (+/- 1.9) 10 Delaware 12.2 (+/- 1.5) 16.9 (+/- 2.1) 24.9 (+/- 2.1) N/A 33.2% (+/- 4.1) 16 31.1%
D.C. 23.7% (+/- 1.9) 47 52.8% (+/- 2.4) 9.1% (+/- 1.1) 33 19.8% (+/- 1.8) 47 29.9% (+/- 2.0) 33 D.C. N/A N/A N/A 13.7% 35.4% (+/- 4.8) 9 26.3%
Florida 26.6% (+/- 1.3) 32 63.4% (+/- 1.4) 10.4% (+/- 0.8) 11 26.9% (+/- 1.3) 16 34.2% (+/- 1.3) 12 Florida 11.5 (+/- 2.3) 13.6 (+/- 1.1) 25.8 (+/- 1.4) 13.4% 33.1% (+/- 6.1) 17 34.1%
Georgia 28.0% (+/- 1.4) 24 62.7% (+/- 1.6) 10.1% (+/- 0.7) 18 26.8% (+/- 1.4) 18 32.3% (+/- 1.3) 18 Georgia 15.0 (+/- 2.3) 15.8 (+/- 2.2) 25.2 (+/- 3.0) 13.5% 37.3% (+/- 5.6) 3 29.4%
Hawaii 21.8% (+/- 1.5) 50 55.8% (+/- 1.8) 8.4% (+/- 0.8) 38 21.3% (+/- 1.5) 45 28.7% (+/- 1.5) 43 Hawaii 13.2 (+/- 2.4) 13.4 (+/- 1.6) 21.0 (+/- 2.3) 9.1% 28.5% (+/- 4.1) 37 28.0%
Idaho 27.0% (+/- 1.8) 30 62.3% (+/- 2.1) 9.4% (+/- 1.0) 29 21.4% (+/- 1.7) 44 29.4% (+/- 1.7) 37 Idaho 9.2 (+/- 1.6) 13.4 (+/- 1.8) 25.9 (+/- 3.4) 11.4% 27.5% (+/- 3.9) 41 25.0%
Illinois 27.1% (+/- 1.8) 29 64.1% (+/- 2.0) 9.7% (+/- 1.1) 22 25.2% (+/- 1.7) 31 31.0% (+/- 1.8) 24 Illinois 11.6 (+/- 1.7) 14.5 (+/- 1.7) 23.2 (+/- 2.3) 14.6% 34.9% (+/- 4.1) 10 26.1%
Indiana 30.8% (+/- 1.4) 8 65.7% (+/- 1.5) 10.2% (+/- 0.8) 15 29.3% (+/- 1.4) 9 32.7% (+/- 1.3) 15 Indiana 14.7 (+/- 1.8) 15.5 (+/- 2.1) 24.2 (+/- 2.7) 14.2% 29.9% (+/- 4.3) 31 31.3%
Iowa 29.0% (+/- 1.4) 18 64.8% (+/- 1.5) 8.2% (+/- 0.7) 43 25.9% (+/- 1.3) 27 29.9% (+/- 1.3) 33 Iowa 13.2 (+/- 3.2) 14.5 (+/- 2.0) 29.1 (+/- 3.3) 14.7% 26.5% (+/- 4.3) 44 27.8%
Kansas 29.6% (+/- 0.9) 13 64.4% (+/- 0.9) 9.5% (+/- 0.5) 25 26.8% (+/- 0.8) 18 30.8% (+/- 0.8) 27 Kansas 10.2 (+/- 1.5) 13.9 (+/- 1.8) 30.2 (+/- 2.5) 13.0% 31.1% (+/- 4.2) 22 25.2%
Kentucky 30.4% (+/- 1.5) 10 66.6% (+/- 1.6) 10.8% (+/- 0.8) 9 29.4% (+/- 1.5) 8 37.9% (+/- 1.5) 5 Kentucky 16.5 (+/- 2.5) 15.4 (+/- 1.6) 21.9 (+/- 2.5) 15.6% 37.1% (+/- 4.1) 4 25.9%
Louisiana 33.4% (+/- 1.5) 2 67.6% (+/- 1.5) 11.8% (+/- 0.9) 4 33.8% (+/- 1.5) 4 38.3% (+/- 1.4) 4 Louisiana 16.1 (+/- 2.6) 19.5 (+/- 4.5) 24.2 (+/- 3.5) 12.5% 35.9% (+/- 4.6) 7 34.0%
Maine 27.8% (+/- 1.1) 25 65.0% (+/- 1.2) 9.6% (+/- 0.6) 24 23.0% (+/- 1.0) 38 32.2% (+/- 1.0) 19 Maine 11.5 (+/- 1.4) 14.0 (+/- 1.1) 23.7 (+/- 1.7) 14.3% 28.2% (+/- 3.8) 39 32.7%
Maryland 28.3% (+/- 1.4) 22 64.4% (+/- 1.6) 9.4% (+/- 0.8) 29 26.1% (+/- 1.4) 26 31.3% (+/- 1.4) 21 Maryland 12.0 (+/- 1.7) 15.4 (+/- 2.0) 21.4 (+/- 2.8) 15.7% 28.8% (+/- 4.2) 36 30.7%
Massachusetts 22.7% (+/- 1.0) 49 59.4% (+/- 1.2) 8.0% (+/- 0.5) 45 23.5% (+/- 1.0) 37 29.2% (+/- 1.0) 40 Massachusetts 9.9 (+/- 1.8) 14.6 (+/- 1.4) 22.4 (+/- 2.6) 16.1% 30.0% (+/- 4.6) 30 26.6%
Michigan 31.3% (+/- 1.3) 5 65.5% (+/- 1.4) 10.0% (+/- 0.8) 19 23.6% (+/- 1.2) 36 34.2% (+/- 1.3) 12 Michigan 12.1 (+/- 1.6) 15.3 (+/- 2.4) 27.0 (+/- 2.7) 13.3% 30.6% (+/- 4.3) 26 33.1%
Minnesota 25.7% (+/- 1.1) 36 62.5% (+/- 1.2) 7.3% (+/- 0.6) 49 21.8% (+/- 1.0) 43 26.3% (+/- 1.0) 49 Minnesota N/A N/A N/A 12.7% 23.1% (+/- 4.0) 50 34.8%
Mississippi 34.9% (+/- 1.4) 1 68.9% (+/- 1.5) 12.3% (+/- 0.8) 1 36.0% (+/- 1.5) 1 39.2% (+/- 1.4) 2 Mississippi 15.8 (+/- 2.2) 16.5 (+/- 2.0) 25.9 (+/- 3.0) 13.7% 44.4% (+/- 4.3) 1 29.0%
Missouri 30.3% (+/- 1.7) 12 64.8% (+/- 1.8) 10.2% (+/- 1.0) 15 28.5% (+/- 1.6) 10 34.3% (+/- 1.6) 11 Missouri N/A N/A N/A 13.6% 31.0% (+/- 4.1) 23 29.6%
Montana 24.6% (+/- 1.4) 41 60.3% (+/- 1.5) 7.9% (+/- 0.7) 46 24.4% (+/- 1.3) 33 30.1% (+/- 1.3) 31 Montana 8.5 (+/- 1.1) 12.9 (+/- 1.4) 28.7 (+/- 1.9) 12.2% 25.6% (+/- 3.7) 48 31.5%
Nebraska 28.4% (+/- 0.8) 21 64.9% (+/- 0.9) 8.4% (+/- 0.5) 38 26.3% (+/- 0.8) 22 28.5% (+/- 0.8) 45 Nebraska 11.6 (+/- 1.2) 13.6 (+/- 1.3) 28.0 (+/- 1.8) 13.8% 31.5% (+/- 4.6) 21 26.2%
Nevada 24.5% (+/- 2.1) 42 60.3% (+/- 2.4) 10.4% (+/- 1.6) 11 24.1% (+/- 2.2) 35 30.9% (+/- 2.2) 25 Nevada N/A N/A N/A 13.6% 34.2% (+/- 5.4) 11 24.4%
New Hampshire 26.2% (+/- 1.5) 35 61.6% (+/- 1.8) 8.7% (+/- 0.8) 37 22.5% (+/- 1.5) 40 30.6% (+/- 1.5) 28 New Hampshire 12.1 (+/- 1.7) 14.1 (+/- 2.2) N/A 14.2% 29.4% (+/- 3.9) 35 29.0%
New Jersey 23.7% (+/- 1.1) 47 61.5% (+/- 1.3) 8.8% (+/- 0.6) 36 26.4% (+/- 1.1) 21 30.6% (+/- 1.1) 28 New Jersey 11.0 (+/- 2.0) 15.2 (+/- 1.9) 28.0 (+/- 2.8) 17.3% 31.0% (+/- 4.5) 23 29.1%
New Mexico 26.3% (+/- 1.3) 34 62.3% (+/- 1.4) 10.0% (+/- 0.8) 19 25.3% (+/- 1.3) 28 28.5% (+/- 1.2) 45 New Mexico 12.8 (+/- 2.1) 14.4 (+/- 1.2) 26.3 (+/- 1.6) 11.7% 32.7% (+/- 5.0) 19 27.0%
New York 24.5% (+/- 1.4) 42 60.5% (+/- 1.6) 10.4% (+/- 0.9) 11 26.2% (+/- 1.4) 24 30.6% (+/- 1.4) 28 New York 11.0 (+/- 1.3) 14.7 (+/- 1.0) 25.1 (+/- 2.4) 14.5% 32.9% (+/- 4.4) 18 27.6%
North Carolina 29.1% (+/- 1.5) 17 65.2% (+/- 1.5) 10.8% (+/- 0.8) 9 26.7% (+/- 1.4) 20 32.4% (+/- 1.3) 17 North Carolina 12.9 (+/- 3.2) 15.9 (+/- 2.0) 26.0 (+/- 2.4) 15.5% 33.5% (+/- 4.5) 14 38.5%
North Dakota 27.8% (+/- 1.6) 25 63.8% (+/- 1.9) 8.3% (+/- 0.8) 42 27.0% (+/- 1.6) 13 28.9% (+/- 1.5) 41 North Dakota 11.0 (+/- 1.7) 14.5 (+/- 2.1) 21.8 (+/- 1.9) 14.1% 25.7% (+/- 3.3) 45 27.1%
Ohio 29.6% (+/- 1.4) 13 65.8% (+/- 1.4) 10.0% (+/- 0.8) 19 27.0% (+/- 1.3) 13 32.7% (+/- 1.3) 15 Ohio 14.7 (+/- 3.1) 15.3 (+/- 2.3) 25.4 (+/- 3.5) 12.4% 33.3% (+/- 4.7) 15 32.1%
Oklahoma 31.1% (+/- 1.4) 6 65.4% (+/- 1.5) 11.1% (+/- 0.8) 8 31.2% (+/- 1.4) 6 35.5% (+/- 1.4) 9 Oklahoma 16.7 (+/- 3.0) 16.3 (+/- 2.8) 33.1 (+/- 4.1) N/A 29.5% (+/- 4.1) 33 29.6%
Oregon 26.7% (+/- 1.6) 31 61.6% (+/- 1.7) 9.3% (+/- 0.9) 31 19.7% (+/- 1.5) 48 29.8% (+/- 1.5) 35 Oregon N/A N/A N/A 15.1% 24.3% (+/- 3.9) 49 27.9%
Pennsylvania 28.6% (+/- 1.3) 20 64.5% (+/- 1.4) 9.5% (+/- 0.7) 25 26.3% (+/- 1.2) 22 31.4% (+/- 1.2) 20 Pennsylvania N/A N/A N/A 12.0% 29.7% (+/- 4.8) 32 35.4%
Rhode Island 25.4% (+/- 1.6) 37 62.5% (+/- 1.8) 8.4% (+/- 0.8) 38 26.2% (+/- 1.5) 24 33.0% (+/- 1.5) 14 Rhode Island 10.8 (+/- 2.3) 14.9 (+/- 2.1) 26.7 (+/- 4.0) 15.5% 30.1% (+/- 4.2) 29 27.6%
South Carolina 30.8% (+/- 1.3) 8 65.9% (+/- 1.4) 12.0% (+/- 0.8) 3 27.2% (+/- 1.3) 11 36.4% (+/- 1.3) 7 South Carolina 13.3 (+/- 3.0) 16.3 (+/- 2.6) 25.8 (+/- 2.9) 12.8% 33.7% (+/- 4.2) 13 31.2%
South Dakota 28.1% (+/- 1.9) 23 64.5% (+/- 2.2) 9.5% (+/- 1.1) 25 26.9% (+/- 2.0) 16 30.9% (+/- 1.9) 25 South Dakota 9.8 (+/- 2.0) 14.1 (+/- 1.4) 27.3 (+/- 3.5) 16.1% 28.4% (+/- 3.9) 38 25.3%
Tennessee 29.2% (+/- 2.5) 15 66.5% (+/- 2.8) 11.2% (+/- 1.5) 6 35.2% (+/- 2.7) 2 38.6% (+/- 2.6) 3 Tennessee 15.2 (+/- 1.6) 17.3 (+/- 1.9) 30.2 (+/- 2.8) 14.5% 36.5% (+/- 4.3) 5 29.8%
Texas 30.4% (+/- 1.4) 10 65.9% (+/- 1.5) 10.2% (+/- 0.8) 15 27.2% (+/- 1.3) 11 31.3% (+/- 1.3) 21 Texas 15.6 (+/- 2.0) 16.0 (+/- 1.4) 27.1 (+/- 2.7) 15.3% 32.2% (+/- 5.6) 20 28.9%
Utah 24.4% (+/- 1.1) 45 58.9% (+/- 1.3) 6.7% (+/- 0.5) 50 18.9% (+/- 1.0) 50 22.9% (+/- 0.9) 51 Utah 8.6 (+/- 1.7) 12.2 (+/- 2.0) 20.8 (+/- 2.6) 8.7% 23.1% (+/- 4.2) 50 17.6%
Vermont 25.4% (+/- 1.4) 37 59.8% (+/- 1.6) 7.7% (+/- 0.7) 48 21.0% (+/- 1.3) 46 29.3% (+/- 1.4) 39 Vermont 9.9 (+/- 2.0) 13.0 (+/- 1.7) 24.4 (+/- 1.6) 12.2% 26.7% (+/- 4.5) 43 36.6%
Virginia 29.2% (+/- 1.7) 15 63.4% (+/- 1.9) 10.4% (+/- 1.1) 11 25.0% (+/- 1.0) 32 31.2% (+/- 1.6) 23 Virginia 11.1 (+/- 2.5) 17.2 (+/- 2.7) 24.1 (+/- 4.0) 15.5% 31.0% (+/- 4.2) 23 26.2%
Washington 26.5% (+/- 1.2) 33 61.0% (+/- 1.4) 8.9% (+/- 0.7) 34 21.9% (+/- 1.2) 42 30.1% (+/- 1.2) 31 Washington N/A N/A N/A 14.4% 29.5% (+/- 5.0) 33 27.6%
West Virginia 32.4% (+/- 1.6) 3 69.0% (+/- 1.7) 12.1% (+/- 1.0) 2 35.1% (+/- 1.6) 3 37.1% (+/- 1.6) 6 West Virginia 14.6 (+/- 2.4) 15.7 (+/- 2.4) 29.0 (+/- 3.2) 13.7% 35.5% (+/- 3.9) 8 33.2%
Wisconsin 27.7% (+/- 2.0) 27 64.1% (+/- 2.2) 8.4% (+/- 1.0) 38 22.6% (+/- 1.8) 39 28.9% (+/- 1.8) 41 Wisconsin 10.4 (+/- 1.6) 15.0 (+/- 1.5) 27.7 (+/- 3.6) 14.1% 27.9% (+/- 3.8) 40 28.5%
Wyoming 25.0% (+/- 1.6) 39 61.2% (+/- 1.8) 8.2% (+/- 1.0) 43 25.3% (+/- 1.6) 28 28.7% (+/- 1.6) 43 Wyoming 11.1 (+/- 1.4) 12.0 (+/- 1.6) 25.8 (+/- 2.1) N/A 25.7% (+/- 4.0) 45 29.8%
Source: Youth Risk Behavior Survey (YRBS) 2011, CDC. YRBS data are collected every 2 years. Percent-
ages are as reported on the CDC website and can be found at < />yrbs/index.htm>. Note that previous YRBS reports used the term “overweight” to describe youth
with a BMI at or above the 95th percentile for age and sex and “at risk for overweight” for those with
a BMI at or above the 85th percentile, but below the 95th percentile. However, this report uses the
terms “obese” and “overweight” based on the 2007 recommendations from the Expert Committee on
the Assessment, Prevention, and Treatment of Child and Adolescent Overweight and Obesity convened
by the American Medical Association. “Physically active at least 60 minutes on all 7 days” means that
the student did any kind of physical activity that increased their heart rate and made them breathe
hard some of the time for a total of least 60 minutes per day on each of the 7 days before the survey.
Source: National Survey of Children’s Health, 2007. Overweight and Physical Activity
Among Children: A Portrait of States and the Nation 2009, Health Resources and
Services Administration, Maternal and Child Health Bureau. * & red indicates a
statistically significant increase (p<0.05) from 2003 to 2007. Over the same time
period, AZ and IL had statistically significant increases in obesity rates, while OR saw
a significant decrease. Meanwhile, NM and NV experienced significant increases in
rates of overweight children between 2003 and 2007, while AZ had a decrease.
Source: Pediatric Nutri-
tion Surveillance 2010
Report, Table 6. Available
at />pednss/pednss_tables/pdf/
national_table6.pdf
12
OBESITY RATES BY SEX AND RACE — 2011
Adult Obesity Obesity Rates by Sex Obesity Rates by Race/Ethnicity
TOTAL MEN WOMEN WHITE BLACK LATINO
Alabama 32.0% (+/- 1.5) 32.3% (+/- 2.5) 31.8% (+/- 1.9) 29.8% (+/- 1.8) 40.1% (+/- 3.3) 28.8% (+/- 13.4)
Alaska 27.4% (+/- 2.2) 28.0% (+/- 3.3) 26.8% (+/- 3.0) 25.9% (+/- 2.3) NA 32.3% (+/- 13.1)
Arizona 24.7% (+/- 2.1) 24.2% (+/- 3.1) 25.1% (+/- 2.9) 20.6% (+/- 2.1) 27.0% (+/- 13.3) 33.6% (+/- 5.7)
Arkansas 30.9% (+/- 2.2) 30.7% (+/- 3.4) 31.1% (+/- 2.7) 31.0% (+/- 2.4) 38.5% (+/- 7.2) 18.4% (+/- 8.9)
California 23.8% (+/- 0.9) 23.1% (+/- 1.4) 24.5% (+/- 1.2) 22.0% (+/- 1.1) 33.1% (+/- 4.9) 30.3% (+/- 1.9)
Colorado 20.7% (+/- 1.1) 21.1% (+/- 1.6) 20.4% (+/- 1.4) 18.9% (+/- 1.1) 34.9% (+/- 8.0) 26.6% (+/- 3.4)
Connecticut 24.5% (+/- 1.5) 25.6% (+/- 2.4) 23.7% (+/- 2.0) 23.1% (+/- 1.7) 32.8% (+/- 6.5) 32.6% (+/- 6.0)
Delaware 28.8% (+/- 1.9) 29.1% (+/- 2.9) 28.5% (+/- 2.5) 27.3% (+/- 2.1) 38.2% (+/- 5.3) 22.4% (+/- 9.8)
D.C. 23.7% (+/- 1.9) 18.5% (+/- 2.8) 28.4% (+/- 2.8) 10.7% (+/- 2.2) 36.7% (+/- 3.4) 13.3% (+/- 6.2)
Florida 26.6% (+/- 1.3) 27.8% (+/- 2.0) 25.6% (+/- 1.7) 25.0% (+/- 1.4) 35.6% (+/- 4.5) 27.9% (+/- 3.6)
Georgia 28.0% (+/- 1.4) 26.7% (+/- 2.2) 29.3% (+/- 1.8) 25.0% (+/- 1.6) 36.8% (+/- 3.2) 26.4% (+/- 6.6)
Hawaii 21.8% (+/- 1.5) 24.4% (+/- 2.3) 19.3% (+/- 1.9) 19.0% (+/- 2.6) NA 26.9% (+/- 6.2)
Idaho 27.0% (+/- 1.8) 26.0% (+/- 2.6) 28.0% (+/- 2.4) 25.8% (+/- 1.8) NA 36.1% (+/- 8.7)
Illinois 27.1% (+/- 1.8) 27.8% (+/- 2.7) 26.6% (+/- 2.2) 26.0% (+/- 1.8) 39.2% (+/- 6.2) 25.2% (+/- 6.6)
Indiana 30.8% (+/- 1.4) 30.9% (+/- 2.2) 30.9% (+/- 1.9) 29.5% (+/- 1.5) 42.3% (+/- 5.9) 35.1% (+/- 9.2)
Iowa 29.0% (+/- 1.4) 30.5% (+/- 2.0) 27.5% (+/- 1.8) 29.2% (+/- 1.4) 27.8% (+/- 10.1) 33.2% (+/- 8.5)
Kansas 29.6% (+/- 0.9) 30.0% (+/- 1.3) 29.1% (+/- 1.1) 29.1% (+/- 0.9) 41.1% (+/- 5.1) 30.5% (+/- 3.9)
Kentucky 30.4% (+/- 1.5) 29.6% (+/- 2.2) 31.1% (+/- 2.0) 29.6% (+/- 1.5) 43.1% (+/- 7.7) 22.2% (+/- 11.3)
Louisiana 33.4% (+/- 1.5) 33.1% (+/- 2.4) 33.9% (+/- 1.8) 31.1% (+/- 1.8) 39.3% (+/- 3.0) 37.5% (+/- 8.8)
Maine 27.8% (+/- 1.1) 28.1% (+/- 1.6) 27.6% (+/- 1.4) 27.9% (+/- 1.1) 15.3% (+/- 10.7) 30.3% (+/- 12.3)
Maryland 28.3% (+/- 1.4) 28.9% (+/- 2.3) 27.9% (+/- 1.8) 26.0% (+/- 1.6) 37.9% (+/- 3.2) 20.9% (+/- 7.0)
Massachusetts 22.7% (+/- 1.0) 24.2% (+/- 1.5) 21.5% (+/- 1.2) 22.2% (+/- 1.1) 32.4% (+/- 4.7) 31.0% (+/- 4.1)
Michigan 31.3% (+/- 1.3) 31.9% (+/- 2.0) 30.7% (+/- 1.8) 29.8% (+/- 1.5) 40.9% (+/- 4.2) 36.7% (+/- 8.6)
Minnesota 25.7% (+/- 1.1) 28.4% (+/- 1.6) 22.9% (+/- 1.4) 25.9% (+/- 1.1) 28.4% (+/- 5.9) 31.6% (+/- 7.8)
Mississippi 34.9% (+/- 1.4) 32.4% (+/- 2.2) 37.4% (+/- 1.9) 30.7% (+/- 1.7) 42.9% (+/- 2.7) 26.8% (+/- 10.3)
Missouri 30.3% (+/- 1.7) 29.8% (+/- 2.6) 30.8% (+/- 2.2) 29.4% (+/- 1.8) 39.3% (+/- 6.2) 27.8% (+/- 13.3)
Montana 24.6% (+/- 1.4) 25.9% (+/- 2.0) 23.4% (+/- 1.8) 24.2% (+/- 1.4) NA 22.5% (+/- 9.6)
Nebraska 28.4% (+/- 0.8) 29.3% (+/- 1.3) 27.6% (+/- 1.2) 28.3% (+/- 0.9) 32.9% (+/- 5.4) 29.8% (+/- 4.1)
Nevada 24.5% (+/- 2.1) 25.6% (+/- 3.1) 23.5% (+/- 2.8) 22.0% (+/- 2.1) 31.2% (+/- 8.3) 29.2% (+/- 6.1)
New Hampshire 26.2% (+/- 1.5) 28.1% (+/- 2.4) 24.2% (+/- 1.9) 26.5% (+/- 1.6) NA 22.9% (+/- 14.5)
New Jersey 23.7% (+/- 1.1) 25.5% (+/- 1.7) 21.9% (+/- 1.4) 23.1% (+/- 1.3) 31.6% (+/- 3.4) 27.2% (+/- 3.3)
New Mexico 26.3% (+/- 1.3) 26.4% (+/- 1.9) 26.4% (+/- 1.6) 22.6% (+/- 1.7) 23.9% (+/- 10.0) 30.0% (+/- 2.1)
New York 24.5% (+/- 1.4) 25.3% (+/- 2.1) 23.9% (+/- 1.7) 23.7% (+/- 1.7) 32.6% (+/- 4.2) 26.3% (+/- 3.9)
North Carolina 29.1% (+/- 1.5) 28.3% (+/- 2.2) 30.0% (+/- 1.9) 26.2% (+/- 1.6) 40.8% (+/- 3.8) 29.0% (+/- 6.8)
North Dakota 27.8% (+/- 1.6) 30.1% (+/- 2.4) 25.4% (+/- 2.1) 26.9% ( +/- 1.6) NA NA
Ohio 29.6% (+/- 1.4) 31.7% (+/- 2.1) 27.6% (+/- 1.7) 29.2% ( +/- 1.5) 34.0% (+/- 4.7) 32.2% (+/- 11.6)
Oklahoma 31.1% (+/- 1.4) 30.6% (+/- 2.2) 31.5% (+/- 1.8) 30.3% ( +/- 1.6) 34.8% (+/- 6.5) 28.7% (+/- 6.3)
Oregon 26.7% (+/- 1.6) 26.3% (+/- 2.4) 27.3% (+/- 2.1) 26.1% ( +/- 1.5) NA 28.8% (+/- 8.2)
Pennsylvania 28.6% (+/- 1.3) 29.6% (+/- 1.9) 27.7% (+/- 1.6) 28.0% ( +/- 1.3) 36.0% (+/- 4.7) 32.9% (+/- 7.6)
Rhode Island 25.4% (+/- 1.6) 27.7% (+/- 2.5) 23.4% (+/- 1.9) 24.9% ( +/- 1.7) 35.2% (+/- 9.8) 26.5% (+/- 5.6)
South Carolina 30.8% (+/- 1.3) 28.5% (+/- 2.0) 33.1% (+/- 1.7) 27.0% ( +/- 1.5) 42.4% (+/- 2.8) 25.0% (+/- 8.5)
South Dakota 28.1% (+/- 1.9) 29.9% (+/- 2.9) 26.3% (+/- 2.5) 26.7% ( +/- 2.0) NA 40.0% (+/- 15.1)
Tennessee 29.2% (+/- 2.5) 28.0% (+/- 3.8) 30.5% (+/- 3.4) 27.9% ( +/- 2.7) 40.5% (+/- 8.2) NA
Texas 30.4% (+/- 1.4) 31.0% (+/- 2.1) 30.0% (+/- 1.9) 27.1% ( +/- 1.7) 39.6% (+/- 5.1) 34.5% (+/- 2.7)
Utah 24.4% (+/- 1.1) 25.8% (+/- 1.6) 22.9% (+/- 1.4) 24.4% ( +/- 1.1) 29.0% (+/- 14.3) 24.2% (+/- 4.0)
Vermont 25.4% (+/- 1.4) 27.3% (+/- 2.2) 23.6% (+/- 1.8) 25.4% ( +/- 1.4) NA 23.5% (+/- 14.4)
Virginia 29.2% (+/- 1.7) 29.7% (+/- 2.6) 28.6% (+/- 2.4) 27.6% ( +/- 1.9) 37.8% (+/- 4.8) 31.4% (+/- 9.4)
Washington 26.5% (+/- 1.2) 28.0% (+/- 1.9) 25.1% (+/- 1.6) 27.1% ( +/- 1.4) 39.5% (+/- 10.3) 27.9% (+/- 5.0)
West Virginia 32.4% (+/- 1.6) 30.7% (+/- 2.4) 34.3% (+/- 2.1) 32.4% ( +/- 1.6) 34.2% (+/- 10.8) 29.1% (+/- 14.7)
Wisconsin 27.7% (+/- 2.0) 29.4% (+/- 2.9) 26.1% (+/- 2.7) 26.8% ( +/- 2.0) 44.0% (+/- 10.8) NA
Wyoming 25.0% (+/- 1.6) 26.1% (+/- 2.3) 23.8% (+/- 2.2) 24.9% ( +/- 1.7) NA 25.9% (+/- 6.6)
13
States with the Highest Obesity Rates
Rank State
Percentage of Adult Obesity
(Based on 2011 Data, Including Confidence Intervals)
1 Mississippi 34.9% (+/- 1.4)
2 Louisiana 33.4% (+/- 1.5)
3 West Virginia 32.4% (+/- 1.6)
4 Alabama 32.0% (+/- 1.5)
5 Michigan 31.3% (+/- 1.3)
6 Oklahoma 31.1% (+/- 1.4)
7 Arkansas 30.9% (+/- 2.2)
8 (tie) Indiana 30.8% (+/- 1.4)
8 (tie) South Carolina 30.8% (+/- 1.3)
10 (tie) Kentucky 30.4% (+/- 1.5)
10 (tie) Texas 30.4% (+/- 1.4)
States with the Lowest Obesity Rates
Rank State
Percentage of Adult Obesity
(Based on 2011 Data, Including Confidence Intervals)
51 Colorado 20.7% (+/- 1.1)
50 Hawaii 21.8% (+/- 1.5)
49 Massachusetts 22.7% (+/- 1.0)
47 (tie) D.C. 23.7% (+/- 1.9)
47 (tie) New Jersey 23.7% (+/- 1.1)
46 California 23.8% (+/- 0.9)
45 Utah 24.4% (+/- 1.1)
42 (tie) Connecticut 24.5% (+/- 1.5)
42 (tie) Nevada 24.5% (+/- 2.1)
42 (tie) New York 24.5% (+/- 1.4)
Note: For rankings, 1 = Highest rate of obesity.
Note: For rankings, 51 = Lowest rate of obesity.
14
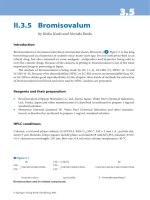
PAST OBESITY TRENDS* AMONG U.S. ADULTS
BRFSS, 1991, 1993-1995,1998-2000, and 2008-
2010 Combined Data
(*BMI >30, or about 30lbs overweight for 5’4”
person)
WA
NV
AZ
CO
NE
ND
MN
WI
IL
KY
VA
NY
HI
MD
DC
DE
NJ
NH
VT
MA
RI
CT
NC
LA
AR
MS AL
SD
KS
MO
TN
GA
SC
FL
IN OH
WV
PA
ME
MI
IA
OK
TX
NM
OR
ID
MT
WY
UT
AK
CA
1991
WA
NV
AZ
CO
NE
ND
MN
WI
IL
KY
VA
NY
HI
MD
DC
DE
NJ
NH
VT
MA
RI
CT
NC
LA
AR
MS AL
SD
KS
MO
TN
GA
SC
FL
IN OH
WV
PA
ME
MI
IA
OK
TX
NM
OR
ID
MT
WY
UT
AK
CA
1993–1995 Combined Data
n No Data
n <10%
n >10% & <15%
n >15% & <20%
n >20%
WA
NV
AZ
CO
NE
ND
MN
WI
IL
KY
VA
NY
HI
MD
DC
DE
NJ
NH
VT
MA
RI
CT
NC
LA
AR
MS AL
SD
KS
MO
TN
GA
SC
FL
IN OH
WV
PA
ME
MI
IA
OK
TX
NM
OR
ID
MT
WY
UT
AK
CA
1998–2000 Combined Data
15
RATES AND RANKINGS METHODOLOGY
30
The analysis in F as in Fat compares data from the Behavioral
Risk Factor Surveillance System (BRFSS), the largest phone
survey in the world.
BRFSS is the largest ongoing telephone health survey in the
world. It is a state-based system of health surveys established
by CDC in 1984. BRFSS completes more than 400,000 adult
interviews each year. For most states, BRFSS is their only
source of population-based health behavior data about chronic
disease prevalence and behavioral risk factors.
BRFSS surveys a sample of adults in each state to get information
on health risks and behaviors, health practices for preventing
disease, and healthcare access mostly linked to chronic disease
and injury. The sample is representative of the population of
each state.
Washington, D.C., is included in the rankings because CDC
provides funds to the city to conduct a survey in an equivalent
way to the states.
The data are based on telephone surveys by state health
departments, with assistance from CDC. Surveys ask
people to report their weight and height, which is used to
calculate BMI. Experts say rates of overweight and obesity
are probably slightly higher than shown by the data because
people tend to underreport their weight and exaggerate
their height.
31
BRFSS made two changes in methodology for its 2011 dataset
to make the data more representative of the total population.
These are making survey calls to cell-phone numbers and
adopting a new weighting method:
n The first change is including and then growing the number of
interview calls made to cell phone numbers. Estimates today
are that 3 in 10 U.S. households have only cell phones.
n The second is a statistical measurement change, which
involves the way the data are weighted to better match the
demographics of the population in the state.
The new methodology means the BRFSS data will better
represent lower-income and racial and ethnic minorities, as
well as populations with lower levels of formal education. The
size and direction of the effects will vary by state, the behavior
under study, and other factors. Although generalizing is
difficult because of these variables, it is likely that the changes
in methods will result in somewhat higher estimates for the
occurrence of behaviors that are more common among
younger adults and to certain racial and ethnic groups.
The change in methodology makes direct comparisons to past
data difficult.
In prior years, this report has included racial, ethnic and
gender breakdowns by state. However, because there is only
one year of data available using the new methodology, the
sample sizes for some states are too small to reliably provide
these breakdowns in this year’s report.
More information on the methodology is available in Appendix B.
Adults with a BMI of 25 to 29.9 are considered overweight. The National Institutes of Health (NIH)
adopted a lower optimal weight threshold in June 1998. Previously, the federal government defined
overweight as a BMI of 28 for men and 27 for women.
On the basis of 2000 CDC growth charts, children and youth at or above the 95th percentile were
defined as “overweight,” while children at or above the 85th percentile but below the 95th percentile
were defined as “at risk of overweight.” However, in 2007, an expert committee recommended
using the same cut points but changing the terminology by replacing “overweight” with “obese” and
“at risk of overweight” with “overweight.” The committee also added an additional cut point — BMI
at or above the 99th percentile — to define “severe obesity.”
35
BMI is considered an important measure for understanding population trends. For individuals, it may
be less accurate and should be used alongside other measures of risk, including waist size, waist-to-
hip ratio, blood pressure, cholesterol level, and blood sugar, among others.
36
DEFINITIONS OF OBESITY AND OVERWEIGHT
Obesity is defined as an excessively high amount of body fat or adipose tissue in relation to lean body
mass.
32,33
Overweight refers to increased body weight in relation to height, which is then compared
to a standard of acceptable weight.
34
An adult is considered obese if his or her body mass index
(BMI), a calculation based on an individual’s weight and height, is 30 or higher. The equation is:
BMI =
(Weight in pounds)
x 703
(Height in inches) x (Height in inches)
B. CHILDHOOD AND YOUTH OBESITY AND OVERWEIGHT RATES
1. Study of Children Ages 10–17 (2007)
The most recent data for childhood statistics on
a state-by-state level are from the 2007 National
Survey of Children’s Health (NSCH).
43
The next
NSCH release is expected in late 2012. According
to the 2007 study, obesity rates for children ages
10–17, defined as BMI greater than the 95th
percentile for age group, ranged from a low of
9.6 percent in Oregon to a high of 21.9 percent
in Mississippi. The NSCH study is based on a
survey of parents in each state. The data are
derived from parental reports, so they are not as
reliable as measured data, such as NHANES, but
they are the only source of comparative state-by-
state data for children.
Nine of the 10 states with the highest rates of
obese children are in the South. In 2003, when
the last NSCH was conducted, only Washington,
D.C., and three states — Kentucky, Tennessee
and West Virginia — had childhood obesity
rates higher than 20 percent. Four years later,
in 2007, six more states had childhood obesity
rates over 20 percent: Arkansas, Georgia, Illi-
nois, Louisiana, Mississippi and Texas.
16
OBESITY AROUND THE WORLD
New information from the Organization for
Economic Cooperation and Development
(OECD) shows that, while more than half of
adults are either overweight or obese in the
majority of OECD countries, the rate of growth
slowed or stopped in many countries over the
last decade.
37
In England almost a quarter of the
population is obese, up to 18 percent in Hungary
are considered obese, and almost 15 percent in
Spain and Ireland are obese.
38
In England, Hungary, Italy, South Korea and
Switzerland, obesity rates either stopped
growing or slowed significantly, and Spain
and France only increased by 2 percent to 3
percent.
39
But in Canada, Ireland and the United
States, rates continued to increase, by up to
5 percent. During the last decade childhood
obesity rates have leveled out in England, France,
South Korea and the United States.
40
Data also showed consistent disparities in obesity
rates across many countries. Women with less
education were two to three times more likely
to be overweight or obese than women with
higher education levels, and the trend stayed
consistent throughout the decade with no im-
provements made to remedy the disparity.
41
SOCIOECONOMICS AND OBESITY
An analysis of the 2008-2010 BRFSS data look-
ing at income, level of schooling completed and
obesity finds strong correlations between obesity
and income and between obesity and education:
n Nearly 33 percent of adults who did not grad-
uate high school were obese, compared with
21.5 percent of those who graduated from
college or technical college.
n More than 33 percent of adults who earn less
than $15,000 per year were obese, compared
with 24.6 percent of those who earned at
least $50,000 per year.
42
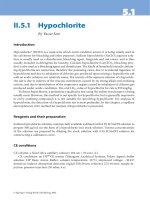
OBESE 10- TO 17-YEAR-OLDS, 2007 NSCH
Source: National Survey on Children’s Health, 2007.
Eight of the states with the lowest rates of obese 10- to 17-year-olds are in the West.
17
WA
NV
AZ
CO
NE
ND
MN
WI
IL
KY
VA
NY
HI
MD
DC
DE
NJ
NH
VT
MA
RI
CT
NC
LA
AR
MS AL
SD
KS
MO
TN
GA
SC
FL
IN OH
WV
PA
ME
MI
IA
OK
TX
NM
OR
ID
MT
WY
UT
AK
CA
n No Data
n <10%
n >10% & <15%
n >15% & <20%
n >20% & <25%
n >25% & <30%
n >30%
States with the Highest Rates of Obese 10- to 17-year-olds
Rank States
Percentage of Obese 10- to 17-year-olds
(95 percent Confidence Intervals)
1 Mississippi 21.9% (+/- 3.5)
2 Georgia 21.3% (+/- 5.1)
3 Kentucky 21.0% (+/- 3.5)
4 (tie) Illinois 20.7% (+/- 3.6)
4 (tie) Louisiana 20.7% (+/- 4.0)
6 Tennessee 20.6% (+/- 3.7)
7 (tie) Arkansas 20.4% (+/- 3.6)
7 (tie) Texas 20.4% (+/- 5.0)
9 D.C. 20.1% (+/- 3.9)
10 West Virginia 18.9% (+/- 3.2)
States with the Lowest Rates of Obese 10- to 17-year-olds
Rank States
Percentage of Obese 10- to 17-year-olds
(95 percent Confidence Intervals)
51 Oregon 9.6% (+/- 2.7)
50 Wyoming 10.2% (+/- 2.7)
48 (tie) Washington 11.1% (+/- 3.4)
48 (tie) Minnesota 11.1% (+/- 3.0)
46 (tie) Iowa 11.2% (+/- 2.7)
46 (tie) Hawaii 11.2% (+/- 2.8)
44 (tie) Utah 11.4% (+/- 3.5)
44 (tie) North Dakota 11.4% (+/- 2.5)
42 (tie) Montana 11.8% (+/- 2.8)
42 (tie) Idaho 11.8% (+/- 2.7)
*Note: For rankings, 1 = Highest rate of childhood obesity.
*Note: For rankings, 51 = Lowest rate of childhood obesity.
2. Study of High School Students
The Youth Risk Behavior Surveillance System
(YRBSS) includes both national and state surveys
that provide data on adolescent obesity and over-
weight rates, most recently in 2011.
44
The infor-
mation from the YRBSS is based on self-reported
information. According to the national survey, 13
percent of high school students were obese and
15.2 percent were overweight.
45
There has been
an upward trend from 1999 to 2011 in the preva-
lence of students nationwide who were obese
(10.6 percent to 13 percent) and who were over-
weight (14.2 percent to 15.2 percent).
46
Students
also reported on whether or not they participated
in at least 60 minutes of physical activity every day
of the week. The most recent state surveys, con-
ducted in 43 states, found a range in the percent-
age of high school students who were physically
active for at least 60 minutes per day seven days a
week, from a high of 33.1 percent in Oklahoma
to a low of 20.8 percent in Utah, with a median
prevalence of 25.8 percent.
The latest state surveys also found a range of
obesity levels: a low of 7.3 percent in Colorado
to a high of 17.0 percent in Alabama, with a me-
dian prevalence of 12.0 percent. Overweight
prevalence among high school students ranged
from a low of 10.7 percent in Colorado to a high
of 19.5 percent in Louisiana, with a median
prevalence of 14.7 percent.
18
Percentage of Obese and Overweight U.S. High School Students by Sex
Obese Overweight
Female 9.8% 15.4%
Male 16.1% 15.1%
Total 13.0% 15.2%
Percentage of Obese and Overweight U.S. High School Students
by Race/Ethnicity
Obese Overweight
White* 11.5% 14.2%
Black* 18.2% 16.2%
Hispanic 14.1% 17.4%
Total** 13.0% 15.2%
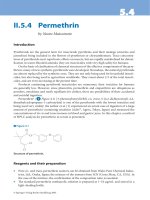
PERCENT OF OBESE HIGH SCHOOL STUDENTS —
Selected U.S. States, Youth Risk Behavior Survey, 2011
Source: YBRS. Trend maps from 2003-2011 are available at: />Notes: *Non-Hispanic. **Other race/ethnicities are included in the total but are not presented separately.
WA
NV
11
7
12
11
MN
10
12
17
11
11
13
12
12
11
12
10
10
11
13
13
16
15
16 17
10
10
MO
15
15
13
12
15 15
15
PA
12
12
13
17
16
13
OR
9
9
11
9
12
CA
n No Data
n <10%
n 10% – 14%
n 15% – 19%
3. Study of Children from Lower-Income Families (2010)
The Pediatric Nutrition Surveillance Survey
(PedNSS), which examines children between
the ages of 2 and 5 from lower-income families,
found that 14.4 percent of this group is obese,
compared with 12.1 percent for all U.S. children
of a similar age.
47
The data for PedNSS is based
on actual measurements rather than self reports.
The prevalence of obesity among children from
lower-income families increased from 12.7 per-
cent in 1999 to 14.4 percent in 2010, although
rates have remained stable since 2003. The high-
est obesity rates were seen among American In-
dian and Alaska Native children (21.1 percent)
and Latino children (17.6 percent).
4. Physical Inactivity in Adults
Physical inactivity in adults reflects the number
of survey respondents who reported not engag-
ing in physical activity or exercise during the pre-
vious 30 days other than doing their regular jobs.
Mississippi, the state with the highest rate
of obesity, also had the highest reported
percentage of inactivity at 36 percent.
Colorado, the state with the lowest rate of adult obesity, also had the lowest reported rate of physical
inactivity at 16.5 percent.
19
Percentage of Obese and Overweight U.S. High School Students
by Sex and Race/Ethnicity
Obese Overweight
Female Male Female Male
White* 7.7% 15.0%
13.8% 14.7%
Black* 18.6% 17.7%
19.6% 12.8%
Hispanic 8.6% 19.2%
18.0% 16.9%
Total** 9.8% 16.1% 15.4% 15.1%
States with the Highest Physical Inactivity Rates, 2011
Rank State
Percentage of Adult Physical Inactivity
(Based on 2011 Data, Including Confidence Intervals)
Obesity Ranking
1 Mississippi 36.0% (+/- 1.5)
1
2 Tennessee 35.2% (+/- 2.7)
15 (tie)
3 West Virginia 35.1% (+/- 1.6)
3
4 Louisiana 33.8% (+/- 1.5) 2
5 Alabama 32.6% (+/- 1.6) 4
6 Oklahoma 31.2% (+/- 1.4) 6
7 Arkansas 30.9% (+/- 2.1) 7
8 Kentucky 29.4% (+/- 1.5) 10 (tie)
9 Indiana 29.3% (+/- 1.4) 8 (tie)
10 Missouri 28.5% (+/- 1.6) 12
States with the Lowest Physical Inactivity Rates, 2011
Rank State
Percentage of Adult Physical Inactivity
(Based on 2011 Data, Including Confidence Intervals)
Obesity Ranking
51 Colorado 16.5% (+/- 1.8)
51
50 Utah 18.9% (+/- 1.0)
45
49 California 19.1% (+/- 0.9) 46
48 Oregon 19.7% (+/- 1.5) 31
47 D.C. 19.8% (+/- 1.8) 47 (tie)
46 Vermont 21.0% (+/- 1.3) 37 (tie)
45 Hawaii 21.3% (+/- 1.5) 50
44 Idaho 21.4% (+/- 1.7) 30
43 Minnesota 21.8% (+/- 1.0) 36
42 Washington 21.9% (+/- 1.2) 33
Notes: *Non-Hispanic. **Other race/ethnicities are included in the total but are not presented separately.
*Note: For rankings, 1=Highest rate of physical inactivity
*Note: For rankings, 51 = Lowest rate of physical inactivity.
D. TYPE 2 DIABETES AND HYPERTENSION IN ADULTS
Obesity and physical inactivity have been linked
to a range of chronic diseases, including dia-
betes and hypertension. Seven of the 10 states
with the highest diabetes rates are also in the
top 10 for obesity rates; and 7 of the 10 states
with the highest hypertension rates are also in
the top 10 for obesity.
1. Type 2 Diabetes
All 10 of the states with the highest rates of type 2 diabetes are in the South.
2. Hypertension
All 10 states with the highest rates of hypertension are also in the South.
20
States with the Rates of Adult with Type 2 Diabetes, 2011
Rank State
Percentage of Adult Diabetes
(Based on 2011 Data, Including Confidence Intervals)
Obesity Ranking
1 Mississippi 12.3% (+/- 0.8)
1
2 West Virginia 12.1% (+/- 1.0) 3
3 South Carolina 12.0% (+/- 0.8) 8 (tie)
4 Alabama 11.8% (+/- 0.9) 4
5 Louisiana 11.8% (+/- 0.9) 2
6 (tie) Arkansas 11.2% (+/- 1.2) 7
6 (tie) Tennessee 11.2% (+/- 1.5) 15 (tie)
8 Oklahoma 11.1% (+/- 0.8) 6
9 (tie) Kentucky 10.8% (+/- 0.8) 10 (tie)
9 (tie) North Carolina 10.8% (+/- 0.8) 17
States with the Highest Rates of Adult Hypertension, 2011
Rank State
Percentage of Adult Hypertension
(Based on 2011 Data, Including Confidence Intervals)
Obesity Ranking
1 Alabama 40.0% (+/- 1.6) 4
2 Mississippi 39.2% (+/- 1.4) 1
3 Tennessee 38.6% (+/- 2.6) 15 (tie)
4 Louisiana 38.3% (+/- 1.4) 2
5 Kentucky 37.9% (+/- 1.5) 10 (tie)
6 West Virginia 37.1% (+/- 1.6) 3
7 South Carolina 36.4% (+/- 1.3) 8 (tie)
8 Arkansas 35.7% (+/- 2.1) 7
9 Oklahoma 35.5% (+/- 1.4) 6
10 Delaware 34.6% (+/- 1.9) 19
*Note: For rankings, 1 = Highest rate of type 2 diabetes.
*Note: For rankings, 1 = Highest rate of hypertension.
THE DIABETES BELT
In the 1960s researchers first identified the
Southeastern United States as the “stroke belt,”
since strokes were much more frequent in
that region than the rest of the country. Now,
scientists are focusing on a “diabetes belt,” made
up of 644 counties in 15 mostly Southern states.
This belt includes parts of Alabama, Arkansas,
Florida, Georgia, Kentucky, Louisiana, North
Carolina, Ohio, Pennsylvania, South Carolina,
Tennessee, Texas, Virginia, West Virginia, and
all of Mississippi.
48
The demographics of these
644 counties vary greatly from those of the
overall country. They have a high percentage of
Blacks, and, not surprisingly, a high number of
people who are obese and lead sedentary lives.
49
Policymakers hope to use this new information to
target resources to those who most need help.
E. FRUIT AND VEGETABLE CONSUMPTION
Fruit and vegetable consumption, as part of a healthy diet, is important for weight management,
optimal child growth, and chronic disease prevention. Seven of the 10 states with the highest rates
of obesity were also in the bottom 10 for fruit and vegetable consumption
21
States with the Lowest Adult Fruit and Vegetable Consumption, 2011
Rank State
Percentage of Adult Fruit and Vegetable Consumption
(Based on 2011 Data, Including Confidence Intervals)
Obesity Rank-
ing
1 West Virginia 7.9% (+/- 0.9) 3
2 Louisiana 8.2% (+/- 0.9) 2
3 Oklahoma 9.8% (+/- 0.9) 6
4 Mississippi 10.3% (+/- 1.0) 1
5 (tie) Kentucky 10.6% (+/- 1.0) 10 (tie)
5 (tie) Tennessee 10.6% (+/- 1.9) 15 (tie)
7 South Dakota 11.0% (+/- 1.2) 23
8 (tie) Alabama 12.5% (+/- 1.1) 4
8 (tie) South Carolina 12.5% (+/- 0.9) 8
10 Delaware 12.9% (+/- 1.4) 19
States with the Highest Adult Fruit and Vegetable Consumption, 2011
Rank State
Percentage of Adult Fruit and Vegetable Consumption
(Based on 2011 Data, Including Confidence Intervals)
Obesity Rank-
ing
51 D.C. 25.6% (+/- 2.1) 47 (tie)
50 California 24.4% (+/- 0.9) 46
49 Vermont 22.7% (+/- 1.3) 37 (tie)
48 New Hampshire 22.5% (+/- 1.5) 35
47 Oregon 22.3% (+/- 1.4) 31
46 Arizona 21.4% (+/- 2.0) 40
45 Connecticut 20.8% (+/- 1.4) 42 (tie)
44 New York 19.9% (+/- 1.3) 42 (tie)
43 Rhode Island 19.8% (+/- 1.4) 37 (tie)
42 Hawaii 19.7% (+/- 1.4) 50
Note: For rankings, 51 = Highest rate of fruit and vegetable consumption.
Note: For rankings, 1 = Lowest rate of fruit and vegetable consumption.
America’s Health
T
FAH and RWJF commissioned the National Heart Forum (NHF) to con-
duct a modeling study to examine how obesity rates in states could change
if trends continued on their current trajectory, including the potential impact on
obesity-related diseases and costs by 2030. The analysis also looked at how disease
rates and costs could be affected by lowering the average BMI in the state by only 5
percent in each state.
Currently, more than 35 percent of American
adults are obese.
50
Individuals with a BMI of
30 or higher are considered obese. The report
found if current trends continue, by the year
2030, more than 44 percent of adults could be
obese, which could lead to major increases in
obesity-related disease rates and health care
costs. But, if states could reduce the average
adult BMI by 5 percent, millions of Americans
could be spared from preventable diseases and
each state could save billions in health care
costs. For an adult of average weight, reducing
BMI by 1 percent is equivalent to a weight loss
of around 2.2 pounds.
51
The analysis concluded, therefore, that there
are two potential futures for America’s health.
23
2
SECTION
BACKGROUND
The study is based on a peer-reviewed model
developed by researchers at the NHF and
used for the basis of an analysis, “Health and
Economic Burden of the Projected Obesity
Trends in the USA and the UK,” published in
2011 in The Lancet.
52
The full methodology is
available in Appendix C.
The NHF is an international center for the
prevention of avoidable chronic diseases, including
coronary heart disease, stroke, cancer and
diabetes. The organization is an alliance of 65
charitable organizations in the United Kingdom,
including leading policy research experts on
chronic disease prevention and promotes
consensus-based healthy public policy.
24
PEER-REVIEWED PROJECTIONS OF FUTURE TRENDS
The analysis is based on a model developed
by researchers at the National Heart Forum.
Micro Health Simulations used the model in a
peer reviewed study, “Health and Economic
Burden of the Projected Obesity Trends in
the [United States and the United Kingdom],”
published in 2011 in The Lancet.
53
The full
methodology is available in Appendix C.
All models have limitations in forecasting the
future, but they help predict the trajectory
of trends based on past data. Trends can, of
course, change significantly over time for a
variety of reasons. However, having a sense
of potential scenarios is particularly helpful
to understand patterns, such as growth rates
for diseases and costs projections, which can
inform policy priorities and decisions.
The NHF study published in The Lancet in
2011 developed national projections for
obesity and the potential growth in related
disease rates and costs between 2010 and
2030, using data from the National Health and
Nutrition Examination Survey (NHANES).
They found the number of obese Americans
could grow from 32 percent, in 2011, to
around 50 percent (+/- 5) in 2030, with the
potential estimated low rate would be 45 and
the high rate is 55.
Based on the predicted rise in obesity, they
found the baseline potential growth in obesity
costs could be $66 billion (+/- 45 billion).
Within the potential range, it could be as low
as $20 billion or as high as $110 billion.
In addition, they projected baseline estimates for:
54
n The number of new cases of diabetes could
be 7.9 million (+/- 1.6 million) per year,
which means it could be as low as 6.3 mil-
lion or as high as 9.5 million;
n The number of new cases of chronic heart dis-
ease and stroke could be 6.8 million (+/- 1.5
million) per year, which means it could be as
low as 5.3 million or as high as 8.3 million; and
n The number of new cases of cancer could
be 0.5 million (+/- 0.1 million) per year,
which means it could be as low as 0.4 mil-
lion or as high as 0.6 million.
The projections in the state-by-state analysis
featured in the F as in Fat report are considered
to be marginally more accurate than those re-
ported in the national study, because the state-
by-state study is based on data from the BRFSS
instead of NHANES. BRFSS provides more data
points than NHANES (10 versus seven). In other
words, more data points enables researchers to
estimate projections more precisely.
The modeling study also reflects adjustments of
data to correct for self-reporting bias in BRFSS.
55
These findings are similar to a 2012 study in
the American Journal of Preventive Medicine.
The study found that by 2030, 42 percent of
U.S. adults will be obese.
56
This study also
found that the rate of severe obesity will
double by 2030, when more than 10 percent
of adults will be considered severely obese.
57
The projected increase in obesity is estimated
to cost the United States $550 billion in health
spending between now and 2030.
58
A. KEY FINDINGS
Obesity in 2030
If obesity rates continue on their current track,
in 2030, more than 60 percent of adults in Amer-
ica could be obese in 13 states; more than half
of adults could be obese in 39 states; and more
than 44 percent could be obese in all 50 states.
However, if states could reduce average adult BMIs
by 5 percent, no state would have an obesity rate
above 60 percent. More than half of Americans
would be obese in 24 states; two states would have
rates under 40 percent (Alaska at 39.4 percent
and Colorado at 39 percent); and Washington,
D.C. would be below 30 percent (29.1 percent).
2030: Adult
Obesity Rates
if the Current
Trajectory
Continues
2030: Adult
Obesity Rates if
Average BMI is
Reduced by
5 Percent
Potential
Percent Increase
in Obesity Rates
2010-2030
25
DC
WA
NV
AZ
CO
NE
ND
MN
WI
IL
KY
VA
NY
HI
MD
DC
DE
NJ
NH
VT
MA
RI
CT
NC
LA
AR
MS AL
SD
KS
MO
TN
GA
SC
FL
IN OH
WV
PA
ME
MI
IA
OK
TX
NM
OR
ID
MT
WY
UT
AK
CA
DC
WA
NV
AZ
CO
NE
ND
MN
WI
IL
KY
VA
NY
HI
MD
DC
DE
NJ
NH
VT
MA
RI
CT
NC
LA
AR
MS AL
SD
KS
MO
TN
GA
SC
FL
IN OH
WV
PA
ME
MI
IA
OK
TX
NM
OR
ID
MT
WY
UT
AK
CA
DC
WA
NV
AZ
CO
NE
ND
MN
WI
IL
KY
VA
NY
HI
MD
DC
DE
NJ
NH
VT
MA
RI
CT
NC
LA
AR
MS AL
SD
KS
MO
TN
GA
SC
FL
IN OH
WV
PA
ME
MI
IA
OK
TX
NM
OR
ID
MT
WY
UT
AK
CA
n <35%
n <35% & <40%
n >40% & <45%
n >45% & <50%
n >50% & <55%
n >55% & <60%
n >60% & <65%
n >65%
n <35%
n <35% & <40%
n >40% & <45%
n >45% & <50%
n >50% & <55%
n >55% & <60%
n >60% & <65%
n >65%
n <80%
n >80% & <90%
n >90% & <100%
n >100% & <110%
n >110% & <120%
n >120% & <130%
n >130%