Báo cáo khoa học: Eukaryotic class 1 translation termination factor eRF1 ) the NMR structure and dynamics of the middle domain involved in triggering ribosome-dependent peptidyl-tRNA hydrolysis pptx
Bạn đang xem bản rút gọn của tài liệu. Xem và tải ngay bản đầy đủ của tài liệu tại đây (1.16 MB, 15 trang )
Eukaryotic class 1 translation termination factor
eRF1
)
the NMR structure and dynamics of the
middle domain involved in triggering ribosome-dependent
peptidyl-tRNA hydrolysis
Elena V. Ivanova
1
, Peter M. Kolosov
1
, Berry Birdsall
2
, Geoff Kelly
2
, Annalisa Pastore
2
,
Lev L. Kisselev
1
and Vladimir I. Polshakov
3
1 Engelhardt Institute of Molecular Biology, Russian Academy of Sciences, Moscow, Russia
2 Division of Molecular Structure, National Institute for Medical Research, London, UK
3 Center for Magnetic Tomography and Spectroscopy, M. V. Lomonosov Moscow State University, Russia
Termination of translation, one of the most complex
stages in protein biosynthesis, is regulated by the co-
operative action of two interacting polypeptide chain
release factors, eukaryotic class 1 polypeptide chain
release factor (eRF1) and eukaryotic class 2 polypep-
tide chain release factor 3 (eRF3). The roles of these
Keywords
human class 1 polypeptide chain release
factor; NMR structure and dynamics;
termination of protein synthesis
Correspondence
V. I. Polshakov, Center for Magnetic
Tomography and Spectroscopy, M. V.
Lomonosov Moscow State University,
Moscow, 119991, Russia
Fax: +7 495 2467805
Tel: +7 916 1653926
E-mail:
(Received 15 May 2007, accepted 20 June
2007)
doi:10.1111/j.1742-4658.2007.05949.x
The eukaryotic class 1 polypeptide chain release factor is a three-domain
protein involved in the termination of translation, the final stage of poly-
peptide biosynthesis. In attempts to understand the roles of the mid-
dle domain of the eukaryotic class 1 polypeptide chain release factor in the
transduction of the termination signal from the small to the large ribo-
somal subunit and in peptidyl-tRNA hydrolysis, its high-resolution NMR
structure has been obtained. The overall fold and the structure of the
b-strand core of the protein in solution are similar to those found in the
crystal. However, the orientation of the functionally critical GGQ loop and
neighboring a-helices has genuine and noticeable differences in solution
and in the crystal. Backbone amide protons of most of the residues in the
GGQ loop undergo fast exchange with water. However, in the AGQ
mutant, where functional activity is abolished, a significant reduction in the
exchange rate of the amide protons has been observed without a noticeable
change in the loop conformation, providing evidence for the GGQ loop
interaction with water molecule(s) that may serve as a substrate for the
hydrolytic cleavage of the peptidyl-tRNA in the ribosome. The protein
backbone dynamics, studied using
15
N relaxation experiments, showed that
the GGQ loop is the most flexible part of the middle domain. The confor-
mational flexibility of the GGQ and 215–223 loops, which are situated at
opposite ends of the longest a-helix, could be a determinant of the func-
tional activity of the eukaryotic class 1 polypeptide chain release factor,
with that helix acting as the trigger to transmit the signals from one loop
to the other.
Abbreviations
aRF1s, archaeal RFs; eRF1, eukaryotic class 1 polypeptide chain release factor; eRF3, eukaryotic class 2 polypeptide chain release factor 3;
HNCA, three-dimensional experiment correlating amide HN and Ca signals; HSQC, heteronuclear single quantum coherence spectroscopy;
M-domain, eRF1 middle domain (or domain 2); PTC, peptidyl transferase center of the ribosome; R
1
, longitudinal or spin–lattice relaxation
rate; R
2
, transverse or spin–spin relaxation rate; R
ex
, conformational exchange contribution to R
2
; RF, polypeptide chain release factor(s);
S
2
, order parameter reflecting the amplitude of ps–ns bond vector dynamics; s
e
, effective internal correlation time; s
m
, overall rotational
correlation time.
FEBS Journal 274 (2007) 4223–4237 ª 2007 The Authors Journal compilation ª 2007 FEBS 4223
termination factors have been validated in vitro in a
completely reconstituted eukaryotic protein synthesis
system [1]. The two major functions of eRF1 are:
(a) recognition of one of the three stop codons, UAA,
UAG or UGA, in the decoding center of the small
ribosomal subunit; and (b) participation in the subse-
quent hydrolysis of the ester bond in peptidyl-tRNA.
eRF3 is a ribosome- and eRF1-dependent GTPase that
is encoded by an essential gene, and its role in transla-
tion termination requires further elucidation [2].
The human eRF1 structure, in the crystal [3] and in
solution [4], consists of three domains. The N-termi-
nal domain is implicated in stop codon recognition
[5–14]. The role of the middle (M) domain will be
described in detail below. The C domain of eRF1
interacts with the C domain of eRF3 [15–18], and the
binding of both factors is essential for fast kinetics of
the termination of translation [1]. However, in a sim-
plified in vitro assay for measuring polypeptide chain
release factor (RF) activity, eRF1 deprived of the
C domain still retains its RF activity [19].
The most characteristic feature of the M domain is
the presence of the strictly conserved GGQ motif
[20]. In prokaryotes, there are two polypeptide
release factors called RF1 and RF2, which are func-
tionally equivalent to eRF1 in eukaryotes [21,22]. In
the Escherichia coli ribosome, the GGQ motif of
RF1 or RF2 is located at the peptidyl transferase
center (PTC) on the large ribosomal subunit, as
revealed by cryo-electron microscopy [23,24], crystal
structure data [25], and biochemical data [26]. It was
suggested [26] and shown by cryo-electron micros-
copy [23,24] and X-ray diffraction [25] that RF2
undergoes gross conformational changes upon bind-
ing to the ribosome that could possibly allow the
loop containing the GGQ motif to reach the PTC of
the ribosome and to promote peptidyl-tRNA hydro-
lysis. A significant conformational change was also
suggested for eRF1 [27] and demonstrated by mole-
cular modeling [28]. It has been suggested that the
GGQ motif, being universal for all class 1 RFs and
critically important for functional activity of both
prokaryotic and eukaryotic class 1 RFs, should be
involved in triggering peptidyl-tRNA hydrolysis at
the PTC of the large ribosomal subunit [20]. The
three-domain structure of eRF1, with the shape of
the protein resembling the letter ‘Y’, partly mimics
the ‘L’-shape of the tRNA molecule, and the M
domain of eRF1 is equivalent to the acceptor stem
of a tRNA [29]. It has also been suggested that the
GGQ motif is functionally equivalent to the universal
3¢-CCA end of all tRNAs [20]. The evidence in sup-
port of this hypothesis is growing [25].
Mutations of either Gly in the GGQ triplet were
shown to abolish the peptidyl-tRNA hydrolysis activity
of human eRF1 in vitro [20,30], of yeast eRF1 in vivo
[3], and of Es. coli RF2 both in vivo and in vitro
[31,32]. For instance, GAQ mutants of both RF1 and
RF2 are four to five orders of magnitude less efficient
in the termination reaction than their wild-type coun-
terparts, although their ability to bind to the ribosome
is fully retained upon mutation [31]. Thus, the toxicity
of these mutants for Es. coli in vivo can be explained
by their competitive inhibition at the ribosome-binding
site [32].
Together, the M and C domains of human eRF1, in
the absence of the N domain, are able to bind to the
mammalian ribosome and induce GTPase activity of
eRF3 in the presence of GTP [33].
The previously determined relatively low-resolution
crystal structure [3] (2.7 A
˚
highest resolution) of the
M domain was unable to provide all the necessary
details of the molecular mechanism of the termination
of translation in the ribosomal PTC. It still remains
unclear how a stop signal can be transmitted from the
small to the large ribosomal subunit, and how the
M domain participates in hydrolysis of the peptidyl-
tRNA ester bond. The aim of this work was to deter-
mine the structure and obtain dynamic information on
the M domain of human eRF1 in solution, which may
help to clarify these important unanswered questions.
Results
Resonance assignment
1
H,
13
C and
15
N chemical shift assignments were made
for essentially all the observed protein backbone amide
resonances. More than 95% of all observed side-chain
1
H,
13
C and
15
N chemical shifts were also determined.
However, at 298 K, backbone signals from residues
177–187, the loop containing the GGQ motif, could
not be detected. For example, no amide signals attrib-
utable to G181, G183 and G184 were observed in the
relatively empty Gly region of the
15
N,
1
H-heteronuclear
single quantum coherence spectroscopy (HSQC) spec-
trum at this temperature. At lower temperatures
(278 K), these amide signals can be detected in the
15
N-HSQC spectra (Fig. 1A), and the assignments
were confirmed by three-dimensional experiments
correlating amide HN and Ca signals (HNCA) and
15
N-NOESY-HSQC experiments. The absence of
amide signals at 298 K appears to be due to fast
exchange of these amide protons with water. An alter-
native mechanism of line broadening could be related
to conformational exchange in the GGQ loop, e.g. the
NMR structure and dynamics of eRF1 middle domain E. V. Ivanova et al.
4224 FEBS Journal 274 (2007) 4223–4237 ª 2007 The Authors Journal compilation ª 2007 FEBS
cis ⁄ trans interconversion within the Gly residues [34].
However, in this case, one can expect to detect similar
behavior of the signals from labile and nonlabile pro-
tons. A series of
13
C-HSQC spectra recorded in the
temperature range between 5 °C and 30 °C showed
that the line widths of the Ha signals of the Gly resi-
dues named above do not change very much. These
facts unambiguously confirm fast exchange of the
backbone amide protons in the GGQ loop with water
at 298 K. Unlike the backbone amide signals, the side-
chain signals of Q185 were observed at 298 K and
assigned as the only remaining unassigned pair of
H
2
N.
At 278 K, residues Gly181, Gly183 and Gly184
are observed in the
15
N-HSQC spectrum, and each
appears as a group of signals with different intensities
and slightly different chemical shifts (Fig. 1A), indicat-
ing that this part of the GGQ loop exists as a mixture
of several conformational states similar to that found
for some other proteins [35,36]. The exchange between
these conformational states happens at a relatively
slow rate (slower than 1s
)1
as estimated from line
shape analysis). These small peaks cannot be assigned
to the breakdown protein species, because in that case
many other peaks in the protein spectrum should have
similar minor satellites. Additionally, for several such
peaks, sequential and intraresidue correlations were
found in the HNCA and
1
H,
15
N-NOESY-HSQC spec-
tra, confirming the assignment of these satellite peaks
to residues G181, G183 and G184. The existence of a
A
B
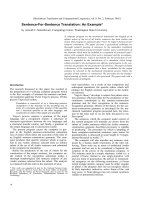
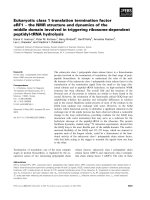
Fig. 1.
1
H,
15
N-HSQC spectra of the M
domain of human eRF1. The numbering of
the residues corresponds to that of the full
eRF1 protein. (A) The Gly region of the
1
H,
15
N-HSQC spectrum of the M domain of
human eRF1 recorded at 278 K. (B) The
superposition of the
1
H,
15
N-HSQC spectra
of wild-type (red) and G183A mutant (blue)
of the M domain of human eRF1 recorded
at 298 K. Clearly visible in blue are the
residues that are absent in the spectrum of
the wild-type protein due to fast exchange
with water.
E. V. Ivanova et al. NMR structure and dynamics of eRF1 middle domain
FEBS Journal 274 (2007) 4223–4237 ª 2007 The Authors Journal compilation ª 2007 FEBS 4225
protein fragment in multiple conformational states
reflects the very complex dynamic behavior of the
GGQ loop.
Effect of G183A mutation
A comparison of the spectra recorded at 298 K for the
wild-type M domain of human eRF1 and the G183A
mutant (where the first Gly residue in the GGQ motif
is replaced by Ala) shows that the chemical shifts of
the vast majority of HN resonances are virtually iden-
tical in these two species (Fig. 1B). There are, however,
several important differences. In the
15
N-HSQC spec-
trum of the G183A mutant, as well as the new signal
from the backbone amide of Ala183 (the mutation
point), one now can also observe signals from the
neighboring residues His182, Gly184 and Gly181,
which were all absent in the
15
N-HSQC spectrum of
the wild-type protein recorded at 298 K. Interestingly,
the chemical shifts of these resonances in the G183A
mutant are very similar to those detected at lower tem-
perature in the wild-type protein, indicating that the
mutation has little (if any) effect on the conformation
of the GGQ loop. At the same time, however, the
G183A mutation results in a decrease in the rate of
exchange of the backbone amide protons with water,
and the NMR signals from the mutant loop residues
are visible at higher temperature (298 K). Surprisingly,
two other signals (Gly216 and Asn262) that were
absent in the
15
N-HSQC spectrum of the wild-type
M domain of eRF1 recorded at 298 K are now visible
in the spectrum of the G183A mutant.
Structure determination
A family of 25 NMR structures was determined on the
basis of 2338 experimental restraints measured at
278 K and 298 K (Tables 1–3). This work made use
of standard double-resonance and triple-resonance
NMR methods applied to unlabeled,
15
N-labeled and
15
N ⁄
13
C-labeled samples of the M domain of eRF1.
For most of the protein residues, the number of NOEs
per residue is between 20 and 40; however, this num-
ber is significantly lower for residues 178–184, which
are near the GGQ motif, and for several other loop
region residues.
The statistics of the final ensemble are given in
Tables 1–3, and the superposition of the final calcu-
lated family is presented in Fig. 2A (backbone atoms
of the M domain of the human eRF1 crystal structure
[3] are also shown in red for comparison). The NMR
structures had the lowest target-function values, no
distance restraint violations greater than 0.2 A
˚
, and no
dihedral angle violations > 10°. The representative
structure (first model in the family of 25 NMR struc-
tures) was selected from the calculated family, as the
structure closest to the average structure and giving
the lowest sum of pairwise rmsd values for the remain-
der of the structures in the family. The rmsd of the
calculated family from the representative structure is
Table 1. Restraints used in the structure calculation of the M
domain of human eRF1.
Total NOEs 1975
Long range (|i–j| > 4) 428
Medium (1 < |i–j| £ 4) 236
Sequential (|i–j| ¼ 1) 448
Intraresidue 863
H-bonds 12
Total dihedral angles 214
Phi (/)96
Psi (w)97
Chi1 (v1) 21
Residual dipolar couplings
N–H 120
C
a
–H
a
5
Table 2. Restraint violations and structural statistics for the calcu-
lated structures of the M domain of human eRF1 (for 25 struc-
tures). No NOE or dihedral angle violations are above 0.2 A
˚
and
10°, respectively.
Average rmsd <S>
a
S
rep
From experimental restraints
Distance (A
˚
) 0.020 ± 0.001 0.020
Dihedral (°) 4.369 ± 0.204 4.397
Residual dipolar coupling (Hz) 0.028 ± 0.002 0.030
From idealized covalent geometry
Bonds (A
˚
) 0.008 ± 0.0002 0.008
Angles (°) 1.377 ± 0.027 1.335
Impropers (°) 1.903 ± 0.055 1.867
% of residues in most favorable
region of Ramachandran plot
89.9 89.9
% of residues in disallowed region
of Ramachandran plot
0.0 0.0
a
<S> is the ensemble of 25 final structures; S
rep
is the representa-
tive structure, selected from the final family on the criterion of hav-
ing the lowest sum of pairwise rmsd for the remaining structures
in the family.
Table 3. Superimposition on the representative structure (Table 2).
Backbone (C, Ca, N) rmsd of residues 142–275 0.87 ± 0.36
All heavy-atom rmsd of residues 142–275 1.14 ± 0.26
Backbone (C, Ca, N) rmsd of the protein
without unstructured loop residues 178–186
0.70 ± 0.34
Backbone (C, Ca, N) rmsd of the core region
of protein (residues 142–174, 200–275)
0.38 ± 0.07
NMR structure and dynamics of eRF1 middle domain E. V. Ivanova et al.
4226 FEBS Journal 274 (2007) 4223–4237 ª 2007 The Authors Journal compilation ª 2007 FEBS
below 0.9 A
˚
for the backbone heavy atoms. However,
most of this value originated from the large contribu-
tion from the poorly structured GGQ loop. Excluding
these residues, 175–189, the rmsd for heavy atoms of
the protein backbone is less than 0.4 A
˚
. In the Rama-
chandran plot analysis, 89.9% of the residues in the
whole NMR family were found in the most favored
regions and none in the disallowed regions.
Structure analysis
The conformations of the backbone and side-chains of
the M domain of human eRF1 are well defined except
for the residues (175–189) in the GGQ loop. The back-
bone conformation of this loop is discussed below in
the section ‘Geometry of the GGQ loop’.
The topology of the M domain of human eRF1 can
be described as a b-core constructed of a sheet formed
from five b-strands (both parallel and antiparallel),
surrounded by four helices, a1–a4 (Fig. 2B). Strand b3
has a substantial twist at residues 168–169. The longest
a-helix (a1) starts at the end of the GGQ loop and has
a bend at residues 195–196. There are also several
loops of various lengths, the longest of which is the
GGQ loop. Another loop of interest starts at the
C-terminus of helix a1 and connects with b-strand b4,
and has a conformation similar to two short antiparal-
lel b-strands with a turn at residue Gly216.
The solution structure of the M domain of human
eRF1 presented in this work shows considerable simi-
larity to the crystal structure of the M domain of the
same protein [3], but it is far from identical (Fig. 2A).
The rmsd of the superposition of the heavy backbone
atoms (Ca, N, O and C) of the family of 25 NMR
structures onto the crystal structure for the whole
M domain (residues 140–275) is 3.8 ± 0.2 A
˚
. An anal-
ogous rmsd value for the superposition of the more
structured part of the protein (residues 144–174 and
200–272) is much lower, 2.7 ± 0.1 A
˚
. The relatively
large value originates mainly from the differences in
orientation of the loops and helices, as discussed later.
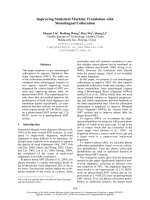
A
B
C
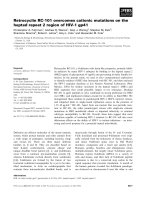
Fig. 2. The solution structures of the M domain of human eRF1.
(A) The stereo view of the ensemble of the final 25 calculated
structures superimposed on heavy backbone atoms (Ca, N and C).
The poorly structured GGQ loop region (residues 175–189) was
excluded from the superposition. The crystal structure of the
M domain of the human eRF1 [3] is superimposed on the same set
of atoms in the representative solution structure and is shown in
red. (B) The topology of the M domain of human eRF1 and the
secondary structure elements displayed using
MOLMOL [65]. (C)
Representative structure of the GGQ loop of the M domain of
human eRF1.
E. V. Ivanova et al. NMR structure and dynamics of eRF1 middle domain
FEBS Journal 274 (2007) 4223–4237 ª 2007 The Authors Journal compilation ª 2007 FEBS 4227
Geometry of the GGQ loop
The GGQ loop is the most disordered part of the
protein structure (Fig. 2A). However, this loop con-
tains the most important functional motif and should
therefore be characterized in detail. The selection of a
representative conformation for the GGQ loop (resi-
dues 177–188) was derived from an analysis of all the
conformations found in the family of calculated
NMR structures (Table 4). This was done by deter-
mining a representative value for each backbone tor-
sion angle (/ and w) and each side-chain torsion
angle v
1
. In many cases, these representative values
were close to the mean value of the torsion angle in
the family. In other cases, when two or several clus-
ters of torsion angle values were observed, the value
from the most populated cluster was taken as the
representative value. These values were then used to
build up a model of the 177–188 loop (Fig. 2C).
There are no interatomic clashes in this model. The
rmsd value for the superposition of the heavy back-
bone atoms (Ca, C, N and O) of this model on
the corresponding part of the family of calculated
NMR solution structures is 1.32 ± 0.35 A
˚
. The rmsd
decreases to 1.01 ± 0.16 A
˚
when it is superimposed
on 13 selected structures from the family of 25 NMR
structures. The rmsd is similar, 1.02 A
˚
, for the super-
position on the representative structure of the family,
and it has a minimum value, 0.76 A
˚
, for one member
of the NMR family.
Backbone dynamics
Figure 3 presents the experimentally obtained relaxa-
tion rates R
1
(longitudinal or spin–lattice relaxation
rate) and R
2
(transverse or spin–spin relaxation rate)
and NOE values for the amide
15
N nuclei measured
at 278 K, and the calculated values of the order
parameter S
2
reflecting the amplitude of ps–ns bond
vector dynamics. The relaxation parameters were
obtained using the model with an axially symmetric
Table 4. The geometry of the GGQ loop in the family of 25 NMR
structures of the M domain of human eRF1.
Residue
Ranges of torsion angles in
whole family
a
Torsion angles in
representative
structure
/wv
1
/wv
1
Pro177 )19 ± 3 161 ± 6 )48 ± 2 )20 160 )48
Lys178 )72 ± 14 )40 ± 11 )90 ± 21 )64 )43 )60
Lys179 )77 ± 13 128 ± 12 )63 ± 30 )70 130 )60
His180 )128 ± 17 48 ± 68 )128 ± 93 )120 45 180
Gly181 80 ± 51 )4 ± 13 90 0
Arg182 )53 ± 58 )22 ± 46 )62 ± 105 )63 )40 )60
Gly183 )66 ± 104 )135 ± 73 )87 )170
Gly184 )53 ± 44 )23 ± 16 )63 )35
Gln185 )90 ± 23 135 ± 7 )110 ± 17 )75 135 )60
Ser186 )68 ± 5 148 ± 4 0 ± 110 )73 150
b
Ala187 )64 ± 1 )41 ± 2 )64 )42
Leu188 )64 ± 1 )42 ± 1 )110 ± 23 )64 )42
b
a
The mean value in the family of 25 structures and the SD.
b
There
is no preferred conformation of the side-chain in the family.
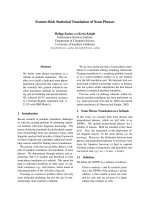
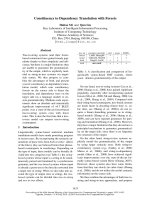
Fig. 3. The relaxation parameters of the amide
15
N spin of each
residue measured at 18.7 T (800 MHz proton resonance frequency)
and 278 K. (A) The longitudinal relaxation rate, R
1
. (B) The trans-
verse relaxation rate, R
2
. (C) The heteronuclear
15
N,
1
H-steady-state
NOE value. (D) The order parameter, S
2
, determined by model-free
analysis with an assumption of axially symmetric anisotropic rota-
tional diffusion. (E) The chemical exchange rate R
ex
.
NMR structure and dynamics of eRF1 middle domain E. V. Ivanova et al.
4228 FEBS Journal 274 (2007) 4223–4237 ª 2007 The Authors Journal compilation ª 2007 FEBS
diffusion tensor. The order parameter is smallest (that
is, for the most typical types of internal motions, the
amplitude of such motions is largest) for residues
176–187 and also the N-terminal residues. The chemi-
cal exchange contribution to the transverse relaxation
rate R
ex
(conformational exchange contribution to R
2
)
is also shown in Fig. 3. The relaxation parameters
were obtained using the model with an axially sym-
metric diffusion tensor. The average correlation time
[1 ⁄ (2D
k
+4D
^
] was 20.8 ± 0.8 ns, and the ratio of
the principal axis of the tensor (D
k
⁄ D
^
) was
1.8 ± 0.1. It is necessary to note that the model that
allows the most successful fit of the experimental data
is based on two internal motions that are faster than
the overall rotational tumbling [37]. Figure 4 illus-
trates the convergence of the simulated data (red
spots) with most of the experimental data (black cir-
cles). The synthetic data were calculated assuming the
existence of relatively slow internal motions, occurring
with a 1.1 ± 0.1 ns correlation time and an order
parameter between 0.5 and 1.0, against a background
of faster motions occurring with a correlation time
below 20 ns and an order parameter between 0.8 and
1.0. This was calculated without the assumption of
conformational line broadening. The residues that
exhibit slow conformational rearrangements occurring
on a millisecond time scale and leading to an increase
in the transverse relaxation rate can be found in a
region outside and to the top of the synthetic dataset
(Fig. 4). The most atypical residues in this group are
D217, I256 and V210. Residues on the right side of
this plot (i.e. with the largest NOE values) mostly
come from the rigid protein core. Figure 4 provides a
clear and useful illustration of the dynamic behavior
of the protein.
Figure 5 shows a ribbon representation of the
M domain with the cylindrical radius proportional to
the order parameters S
2
(A) and R
ex
(B). Interest-
ingly, ignoring the trivial case of the N-terminal resi-
dues, the two most flexible loop regions in the
M domain are situated on the two opposite sides of
the long helix, a1 (Figs 2B and 5). The GGQ loop
exhibits motions occurring with a 1 ns correlation
time, whereas the loop composed of residues 215–223
undergoes motions on both the nanosecond and milli-
second time scales. Another flexible part of the pro-
tein that undergoes motions on both the fast and
slow time scales (indicative residue I256) is the begin-
ning of the helix a4, which connects to the C domain
of human eRF1.
Discussion
The family of class 1 release factors
The alignment of the amino acid sequences of the
M domains of eRF1s and aRF1s (archaeal RFs) from
diverse organisms, including the evolutionarily distant
eRF1s from lower eukaryotic organisms with variant
genetic codes, such as Stylonichia and Euplotes,is
shown in Fig. 6. The sequences between Leu176 and
Ala210 (human eRF1 numbering) are highly conserved
and contain, apart from the invariant GGQ motif,
some other residues near this motif that are also com-
pletely conserved among all species, including members
of the archaea, namely Pro177, Lys179 and Ser186 in
the loop region, and Arg189, Phe190 and Leu193 at
the beginning of the a1 helix. The highly conserved
Gly residues in positions 163, 183, 184 and 228 most
likely have a topology-forming role, allowing the pro-
tein backbone to have a specific geometry. Several
other highly conserved residues may have a functional
role by forming an interface for protein–RNA binding.
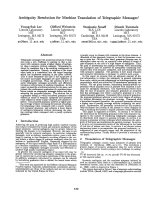
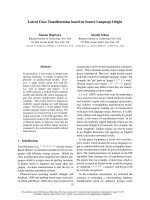
Fig. 4. The distribution of the experimental (black dots) and simu-
lated (small red squares) ratios of relaxation rates R
2
⁄ R
1
vs. the
heteronuclear
15
N,
1
H-NOE values. The data were simulated at
800 MHz proton resonance frequency using Clore’s extension of
the Lipari and Szabo model [37]. The axial symmetry with the
ratio D
k
⁄ D
^
of the principal axis of the tensor was 1.8 ± 0.1; the
value of effective overall correlation time 1 ⁄ (2D
k
+4D
^
) was
20.8 ± 0.8 ns; the values of the order parameter S
2
slow
were
between 0.5 and 1.0; the values of the order parameter S
2
fast
were
between 0.8 and 1.0; the values of the internal motion correlation
times s
slow
were between 1 and 1.1 ns; and the values of the
internal motion correlation times s
fast
were between 0 and 20 ps.
E. V. Ivanova et al. NMR structure and dynamics of eRF1 middle domain
FEBS Journal 274 (2007) 4223–4237 ª 2007 The Authors Journal compilation ª 2007 FEBS 4229
The high level of the alignment similarity suggests that
the tertiary structure of the M domain is well con-
served in both eukaryotic and archaeal RFs.
The high degree of conservation of the GGQ-con-
taining fragment of the M domain is most likely to be
associated with its role in triggering peptidyl-tRNA
hydrolysis. As the ribosomal PTC is mostly composed
of rRNA, which in turn is also highly conserved across
species [38–40], the conservation of the GGQ-contain-
ing fragment is likely to be associated with its binding
to the conserved RNA sequences.
Comparison with the crystal structure
of human eRF1
The most noticeable difference between the crystal
structure of the M domain in the whole protein and
the solution structure of the separated individual
AB
Fig. 5. Ribbon representation of the back-
bone of the M domain of human eRF1. The
variable radius of the cylinder is proportional
to the dynamic properties of the protein res-
idues. (A) Fast motions (on a picosecond to
nanosecond time scale). The thickness of
the backbone ribbon is proportional to the
value of 1 ) S
2
); the minimal thickness
corresponds to the value S
2
¼ 1, and the
maximum to S
2
¼ 0.5. (B) Slow conforma-
tional rearrangements (occurring on a
millisecond time scale). The thickness of the
backbone ribbon is proportional to the value
of R
ex
; the minimal thickness corresponds
to the value R
ex
¼ 0, and the maximum to
R
ex
¼ 10.
Fig. 6. Sequences of the M domains of
eRF1 ⁄ aRF1 from Homo sapiens (1), Saccha-
romyces cerevisae (2), Schizosaccharomy-
ces pombe (3), Paramecium tetraurelia (4),
Oxytricha trifallax (5), Euplotes aedicula-
tus (6), Blepharisma americanum (7), Tetra-
hymena thermophila (8), Stylonychia
mytilus (9), Dictyostelium discoideum (10),
Archaeoglobus fulgidus (11), Pyrococcus
abyssi (12) and Methanococcus janna-
schii (13), as aligned using BLAST [71], with
minor manual corrections. Highly and com-
pletely conserved residues of RFs are indi-
cated by dark and light gray, respectively.
Identified secondary structure elements in
the M domain of human eRF1 are shown
above the sequence. The numbering above
the sequence corresponds to human eRF1.
NMR structure and dynamics of eRF1 middle domain E. V. Ivanova et al.
4230 FEBS Journal 274 (2007) 4223–4237 ª 2007 The Authors Journal compilation ª 2007 FEBS
M domain as seen in Fig. 2A is the orientation of the
GGQ loop and its connection to helix a1. Our confi-
dence in the accuracy of the determination of the ori-
entation of the flexible GGQ loop in solution is based
on the extensive use of residual dipolar coupling
restraints, both
1
D(
15
N,
1
H) and
1
D(
13
C,
1
H), that show
good agreement between experimental and calculated
values of these parameters. There are three possible
reasons for the differences between the crystal and the
solution structures of the M domain. First, the orienta-
tion of the loop may change, due to crystal-packing
effects. Second, the coordinates of the GGQ loop may
not be determined by the X-ray data sufficiently well,
because of the relatively low resolution and the flexibil-
ity of the GGQ loop. It is of note that about 2.8% of
the eRF1 residues in the crystal structure were found
in disallowed regions of the Ramachandran plot [3],
which indicates that experimental problems may have
resulted in a decrease in the overall quality of the
structure. Finally, the C and N domains may have
structural influences on the M domain within the
whole eRF1 protein.
The pairwise comparison of the solution structures
with the X-ray crystal structure of the M domain using
the superposition of five-residue fragments (Fig. 7)
shows that the local geometry of regions 177–184,
194–195, 213–219, 237–245 and 258–260 is different.
All these regions, except 194–197, correspond to loops
that connect regular secondary structure elements. Res-
idues 194–197 are situated at the bend in helix a1, and
are not observed in the crystal structure of human
eRF1 [3]. Therefore, the differences between the crystal
and solution structures arise mainly from changes in
the orientations of the loops and a-helices relative to
the b-core.
Effect of mutations
The mutation of either Gly residue in the GGQ motif
of class 1 RFs has been shown to abolish the RF
activity both in vivo and in vitro. The G183A mutant
of human eRF1 was totally inactive in peptidyl-tRNA
hydrolysis [20], and it has been proposed that this
mutation alters the structure of the GGQ loop [1].
However, the replacement of Gly183 by an Ala has
only minor effects on the chemical shifts of signals
from the vast majority of the residues of the M domain
(Fig. 1B). This is strong evidence that there is no
substantial change in the conformation of the protein
or in the distribution of the conformational ensemble
of the GGQ loop. In contrast to this lack of effect on
the conformation, the G183A mutation has a drastic
effect on the exchange of amide protons with water.
Fast exchange with water of GGQ loop amide
protons
It was noted above that many of the residues in the
GGQ loop were not detected in the NMR spectra of
the wild-type M domain at room temperature, due to
fast exchange with water. Such fast exchange of the
amide proton with water can be caused by several pos-
sible mechanisms. These include: (a) coordination of a
water molecule(s) involved in subsequent exchange
with amide proton, facilitated by appropriate orienta-
tion of HN bonds relative to the CO bond [41]; and
(b) the local pH being above 8 and thereby allowing
the HNs to exchange rapidly via base catalysis [42].
The GGQ loop region has a predominant positive
charge, and this may have implications for the possible
binding of the protein to rRNA [3]. One of the
Fig. 7. A plot of the calculated rmsd for the displacements over the backbone atoms (Ca, C and N) calculated from the pairwise superimpo-
sition of five-residue segments of the crystal structure on the equivalent segments of each member of the family of the solution structure
of the M domain of human eRF1. The resulting rmsd values (y-axis) and their deviations through the 25 NMR structures are shown for the
central residue of the five-residue segments (x-axis).
E. V. Ivanova et al. NMR structure and dynamics of eRF1 middle domain
FEBS Journal 274 (2007) 4223–4237 ª 2007 The Authors Journal compilation ª 2007 FEBS 4231
possible consequences of this charge imbalance could
be an increase in the local pH. However, the fact that
the G183A mutation significantly decreases the
exchange rate of the amide protons in the loop region
indicates that a higher local pH is unlikely to be the
reason for the fast exchange, as the replacement of one
neutral residue by another without a conformational
change cannot substantially influence the distribution
of the local potential. Therefore, most probably, the
observed effect relates to the coordination of a water
molecule(s) in the GGQ loop and its involvement in
catalysis of amide proton exchange.
The possible water coordination to the GGQ loop
may facilitate an understanding of the mechanism of
peptidyl-tRNA hydrolysis. It has been suggested that
the glutamine side-chain in the GGQ minidomain acts
to coordinate the substrate water molecule that per-
forms the nucleophilic attack on the peptidyl-tRNA
ester bond and that the conserved adjacent Gly and
neighboring basic residues facilitate contact with the
phosphate backbone of either rRNA and ⁄ or the accep-
tor stem of the P site tRNA [3]. Although this hypoth-
esis has not been supported by any experimental data
[30,43–45], one can propose, on the basis of the cur-
rent observations, that the protein backbone of the
GGQ loop could be responsible for the water molecule
coordination.
Dynamic properties of the M domain
The dynamic behavior of the M domain has several
important features. First of all, the most flexible region
is the GGQ loop, which is also the most important
functionally. It undergoes not only very fast (picosec-
ond to nanosecond time scale) but also relatively slow
conformational rearrangements, occurring on a milli-
second to second (and possibly slower) time scale.
High mobility is a characteristic of many RNA- and
DNA-binding proteins [46–48], and may facilitate eas-
ier positional rearrangement of the protein during the
docking to the binding site on the ribosome or other
ligands. Strikingly, the second most flexible part of the
protein (if one does not take into account the N-termi-
nal region of the M domain) is the loop situated on
the other end of helix a1 from the GGQ motif
(Fig. 5). This loop (residues 215–223) undergoes both
fast (with a correlation time of about 1 ns) and slow
(millisecond time scale) motions. There are two possi-
ble functional implications of the behavior of this
loop. The first is the facilitation of the conformational
rearrangements and the maintenance of the conforma-
tional plasticity for effective binding of the protein to
the ribosome. The second, and more plausible, is that
the loop is situated at the interface between the M and
N domains of eRF1, and this flexibility may be
involved in transduction of the signal from the N-ter-
minal domain, upon the recognition of the stop codon,
to the M domain for subsequent initiation of the
hydrolysis of peptidyl-tRNA ester bond. Two possible
models of signal transduction may be considered. The
first model assumes that the signal is transmitted
directly through the body of eRF1 from the N domain
to the GGQ loop of the M domain located in the
PTC. The second model postulates that rRNA(s) could
mediate the signal transduction through the follow-
ing schematic chain: N domain fi 18S rRNA fi 28S
rRNA fi M domain fi GGQ fi PTC-peptidyl-tRNA.
No evidence is available at present that favors either
model; however, the flexibility of the M domain may
be implicated in both models. The long and relatively
dynamically rigid helix a1 could serve as a trigger that
facilitates the conformational change in one loop con-
sequent to a change at the other loop.
Interestingly, the short loop at the interface between
strand b6 and the C-terminal helix a3 also exhibits the
two types of motion ) slow conformational rearrange-
ment occurring on a millisecond time scale, and rela-
tively fast motions (with 1 ns correlation time). This
slow motion was detected from the large increase of
the transverse relaxation rate of residue I256, occurring
at the same time as the fast motions. Helix a3 connects
the M domain with the C domain of eRF1, and the
motions of this short loop could be a reflection of the
absence of the interacting C domain in this construct.
Experimental procedures
Sample preparation
To construct the pET-MeRF1 vector for expression of the
human eRF1 fragment encoding the M domain with the
C-terminal His6-tag fusion, a PCR fragment derived from
pERF4B [6] was inserted between the NdeI and XhoI sites of
pET23b (Novagen, Madison, WI, USA). The M domain
(residues 142–275 of human eRF1) was overproduced in
Es. coli strain BL21(DE3) in M9 minimal medium. For
13
C
and ⁄ or
15
N labeling [
13
C
6
]d-glucose and ⁄ or
15
NH
4
Cl (Cam-
bridge Isotope Laboratories Inc., Andover, MA, USA) were
used as a sole carbon and ⁄ or nitrogen source in M9 minimal
medium. The His6-tagged M domain of human eRF1 was
isolated and purified using affinity chromatography on
Ni
2+
–nitrilotriacetic acid agarose (Qiagen, Germantown,
MD, USA). Peak fractions were dialyzed against 20 mm
potassium phosphate buffer (pH 6.9) and 50 mm NaCl,
and then purified by cation exchange chromatography
using HiTrap SP columns (Amersham Pharmacia Biotech,
NMR structure and dynamics of eRF1 middle domain E. V. Ivanova et al.
4232 FEBS Journal 274 (2007) 4223–4237 ª 2007 The Authors Journal compilation ª 2007 FEBS
Piscataway, NJ, USA) in 20 mm potassium phosphate buffer
(pH 6.9). Purified protein was concentrated to approximately
1mm. The final purity of the sample was about 98%, as
determined by SDS ⁄ PAGE.
The samples for NMR at approximately 1 mm concentra-
tion were prepared in either 95% H
2
O ⁄ 5% D
2
Oorin
100% D
2
O and 20 mm potassium phosphate and 50 mm
KCl (pH 7.0). Typically, the volume of the samples was
380 lL, in Shigemi microcell NMR tubes.
NMR spectroscopy
All spectra were acquired between 5 °C and 30 °Cona
Varian (Palo Alto, CA, USA) INOVA 600 and 800 MHz
NMR spectrometer equipped with triple-resonance z-gradi-
ent probes and a Bruker (Karlsruhe, Germany) AVANCE
600 MHz spectrometer equipped with a triple-resonance
cryoprobe. Spectra were processed by nmrpipe [49], and
analyzed using sparky (from Goddard and Kneller, San
Francisco, CA, USA; />and autoassign [50]. Sequential assignments for the
backbone were obtained [51] using the following three-
dimensional (3D) spectra: HNCO, HNCA, HN(CO)CA,
HNCACB, CBCA(CO)NH, HNHAHB and HBHA(CO)
NH [52]. Aliphatic side-chain resonances were derived from
3D HCCH-TOCSY, HNHB,
1
H,
15
N-NOESY-HSQC and
1
H,
13
C-NOESY-HSQC spectra. Distance restraints for struc-
ture calculations were obtained from the 3D
15
N- and
13
C-sep-
arated NOESY spectra recorded at 25 °Cand5°Cwith
100 ms mixing time.
Residual dipolar coupling measurements were performed
using ternary poly(ethylene glycol) ether ⁄ alcohol ⁄ buffer mix-
tures as described by Ruckert & Otting [53]. Residual dipolar
coupling
1
D
NH
values were obtained from inphase antiphase-
HSQC spectra [54] recorded in 5% w ⁄ w n-dodecyl-
penta(ethylene glycol) ⁄ hexanol media at 298 K (59 values)
and in 5% w ⁄ w n-octyl-penta(ethylene glycol) ⁄ octanol media
at 283 K (61 values), and corresponding
1
J
NH
values were
measured in anisotropic solution at the same temperature.
Spectra for
15
N longitudinal relaxation rates R
1
, trans-
verse relaxation rates R
2
and
15
N,
1
H-heteronuclear NOE
values were collected on the 1 mm
15
N-labeled M domain
eRF1 sample at 278 K with a Varian INOVA 800 MHz
NMR spectrometer, and at 293 K with a Varian INOVA
600 MHz spectrometer, using the pulse sequences modified
from those described by Kay et al. [55] to compensate for
cross-correlation effects [56].
Structure calculation and refinement
The NOE cross-peaks were integrated, and corresponding
proton–proton distances were grouped into four ranges
with upper limits of 2.5 A
˚
, 3.5 A
˚
, 4.5 A
˚
and 5.5 A
˚
.
The ranges for backbone torsion angles / and w were
derived from the values of
13
C
a
,
13
C
b
,
13
C¢,
1
H
a
1
H
N
and
15
N
chemical shifts and the software talos [57]. Stereospecific
assignments for Hbs and pro-R ⁄ pro-S methyl groups of Val
and Leu residues, together with the values of torsion angles
v
1
, were obtained using the program anglesearch [58].
To generate an initial structure, a set of unambiguously
assigned NOEs was submitted to aria, and further assigned
NOEs were obtained via an iterative procedure [59] using
the aria-cns crystallography and NMR system [60].
Donors of hydrogen bonds ) slowly exchanging amide pro-
tons ) were detected in the NOESY spectrum acquired in
D
2
O. Acceptors of hydrogen bonds were identified among
the nearby carbonyl groups in the final stages of structure
calculations. Two distance restraints were employed for
each hydrogen bond (r
NH–O
< 2.4 A
˚
and 2.4 A
˚
< r
N–O
<
3.4 A
˚
). In total, 12 hydrogen bonds (24 restraints) were
used to refine the structure.
For refinement of the structure, experimentally deter-
mined distance, torsion angle and residual dipolar coupling
constraints (Table 1) were applied in a simulated annealing
protocol using the NIH version [61] of xplor [62] software.
Fifty-nine residual dipolar coupling values measured at
298 K and having values between ) 47 Hz and + 37 Hz,
and 61 residual dipolar coupling values measured at 283 K
and having values between ) 52 Hz and + 38 Hz, were used
in the final stages of structure refinement. Parameters of the
alignment tensor and orientation of the molecule were opti-
mized during the simulated annealing for each conformer in
the NMR family using the NIH xplor software package.
During several iterative cycles of the structure calculations,
all experimental restraints were checked and adjusted when
necessary using the program nmrest, written-in-house. The
database values of conformational torsion angle pseudopo-
tentials [63] were utilized during the calculations. The 20 ps
high-temperature dynamics at 1500 K were followed by a
cooling phase of 1000 steps of 0.2 ps to 10 K. The values
for the final force constants were as follows: NOE restraints,
200 kcalÆmol
)1
ÆA
˚
)2
; dihedral angle restraints, 200 kcalÆ
mol
)1
Ærad
)2
; residual dipolar couplings, 50 kcalÆmol
)1
ÆHz
)2
;
scale factor for conformational database restraints [63], 10.
The best 25 out of 50 calculated structures (Fig. 2A) were
selected using the criteria of lowest energy of experimental
restraints, and analyzed with aqua and prochek-nmr soft-
ware [64]. Structure visualization and analysis were carried
out using the insightii software package (Accelrys Software
Inc., San Diego, CA, USA) and molmol [65].
NMR dynamics analysis
The R
1
values were deduced from the data acquired as a
pseudo-3D experiment with the relaxation delays 8.6 ms,
24.7 ms, 48.6 ms, 96.9 ms, 193.2 ms, 345.7 ms, 498.2 ms,
594.5 ms, 795.2 ms, 1196.4 ms and 1597.7 ms, and the R
2
values were derived from data with relaxation delays of
8.5 ms, 17.1 ms, 25.6 ms, 34.1 ms, 42.6 ms, 51.2 ms,
59.7 ms, 68.2 ms, 76.7 ms, 93.8 ms and 119.4 ms. A 4 s
1
H
E. V. Ivanova et al. NMR structure and dynamics of eRF1 middle domain
FEBS Journal 274 (2007) 4223–4237 ª 2007 The Authors Journal compilation ª 2007 FEBS 4233
saturation was applied as a relaxation delay for NOE
enhancement in the heteronuclear NOE experiment. Values
of R
1
and R
2
with their SDs were obtained from nonlinear
fitting of the integrated peak volumes, measured using the
nlinLS procedure from the nmrpipe package [49]. SDs of
the
15
N,
1
H-NOE values were calculated using the rms noise
of the background regions [66], and were further checked
and corrected using two independently collected experimen-
tal datasets.
The overall correlation time was calculated from the
R
2
⁄ R
1
ratios [55]. The calculations yield an average overall
correlation time value of 20.2 ± 0.8 ns at 278 K and of
11.5 ± 0.5 ns at 298 K. The overall correlation time was
treated as a fixed parameter in subsequent analysis of the
relaxation data.
Experimental values of the relaxation parameters were
interpreted using the model-free formalism [67] with exten-
sions to include slower internal motions [37] and chemical
exchange contributions R
ex
to the transverse relaxation
rates [68] under the assumptions of both isotropic and
axially symmetric anisotropic rotational diffusion. Several
motional models that included combinations of optimized
internal motion parameters S
2
(order parameter), s
e
(effec-
tive correlation time of internal motion) and R
ex
(chemical
exchange contribution to the transverse relaxation rate)
were used. All calculations were carried out using the pro-
gram relaxfit, written-in-house [69].
The magnitude and orientation of an axially symmetric
rotational diffusion tensor were initially estimated by fitting
it to the R
2
⁄ R
1
ratios for the protein core residues, and fur-
ther verified by graphical comparison of the experimentally
measured parameters against simulated datasets (Fig. 4).
Data indicated by gray squares were simulated using the
extended Lipari and Szabo [37] and axially symmetric diffu-
sion models, with the following parameters randomly gener-
ated (1000 datasets) using the Gauss distribution: average
rotational correlation time s
c
20.8 ± 0.8 ns; ratio of the
principal axis of the axially symmetric diffusion tensor
(D
k
⁄ D
^
) 1.8 ± 0.1; order parameter S
2
within 0.8 ± 0.2;
correlation time of fast motion 20 ± 5 ps; correlation time
of slow motion s
s
1 ± 0.1 ns; order parameter of fast
motions S
2
f
0.95 ± 0.05. During the calculations, the chemi-
cal exchange contribution R
ex
was set to 0, and all the possi-
ble orientations of the vector of the amide NH bond relative
to the principal axis of the diffusion tensor (h angle) were
generated. Comparison of the synthetic data with experimen-
tally measured parameters (black circles) shows good correla-
tion. The slope of the simulated data trace on the plot R
2
⁄ R
1
against NOE is very sensitive to motional correlation times,
particularly to the correlation time of the slow motion s
s
.
The range of the dataset on the NOE axis is very sensitive to
the value of order parameters; the width of data distribution
along the R
2
⁄ R
1
axis is specific to the ratio D
k
⁄ D
^
.
The obtained parameters s
s
and D
k
⁄ D
^
were then used in
the fitting of residue-specific relaxation data. Uncertainties
in the calculated parameters S
2
, R
ex
and internal motion
correlation times) were obtained using 500 cycles of Monte-
Carlo simulations [70].
Databank accession numbers
The
1
H,
15
N and
13
C chemical shifts have been deposited in
the BioMagResBank database ()
under the accession number BMRB-6763. The structural
data and experimental restraints used in calculations have
been submitted to the Protein Data Bank with accession
number 2HST.
Acknowledgements
The NMR measurements were carried out at the MRC
Biomedical NMR Centre, NIMR, Mill Hill. We thank
Dr Thomas Frenkiel for expert help in setting up the
NMR experiments, Yegor Smurnyy for help in setting
up the structure calculations, and Professor James Fee-
ney for helpful discussions. This work was supported
in part by grants from the Presidium of the Russian
Academy of Sciences (Program ‘Molecular and Cell
Biology’ to L. Kisselev), the Russian Foundation for
Basic Research (05-04-49385a to L. Kisselev, and
05-04-48972a to V. Polshakov) and the Presidential
Program for Supporting the Leading Russian Scientific
Schools (via Ministry of Education and Science to
L. Kisselev).
References
1 Alkalaeva EZ, Pisarev AV, Frolova LY, Kisselev LL &
Pestova TV (2006) In vitro reconstitution of eukaryotic
translation reveals cooperativity between release factors
eRF1 and eRF3. Cell 125, 1125–1136.
2 Kisselev L, Ehrenberg M & Frolova L (2003) Termina-
tion of translation: interplay of mRNA, rRNAs and
release factors? EMBO J 22, 175–182.
3 Song H, Mugnier P, Das AK, Webb HM, Evans DR,
Tuite MF, Hemmings BA & Barford D (2000) The crys-
tal structure of human eukaryotic release factor eRF1 )
mechanism of stop codon recognition and peptidyl-
tRNA hydrolysis. Cell 100, 311–321.
4 Kononenko AV, Dembo KA, Kisselev LL & Volkov
VV (2004) Molecular morphology of eukaryotic class I
translation termination factor eRF1 in solution. Mol
Biol (Mosk) 38, 303–311.
5 Bertram G, Bell HA, Ritchie DW, Fullerton G & Stans-
field I (2000) Terminating eukaryote translation: domain
1 of release factor eRF1 functions in stop codon recog-
nition. RNA 6, 1236–1247.
6 Frolova L, Seit-Nebi A & Kisselev L (2002) Highly con-
served NIKS tetrapeptide is functionally essential in
NMR structure and dynamics of eRF1 middle domain E. V. Ivanova et al.
4234 FEBS Journal 274 (2007) 4223–4237 ª 2007 The Authors Journal compilation ª 2007 FEBS
eukaryotic translation termination factor eRF1. RNA 8,
129–136.
7 Ito K, Frolova L, Seit-Nebi A, Karamyshev A, Kisselev
L & Nakamura Y (2002) Omnipotent decoding poten-
tial resides in eukaryotic translation termination factor
eRF1 of variant-code organisms and is modulated by
the interactions of amino acid sequences within domain
1. Proc Natl Acad Sci USA 99, 8494–8499.
8 Seit-Nebi A, Frolova L & Kisselev L (2002) Conversion
of omnipotent translation termination factor eRF1 into
ciliate-like UGA-only unipotent eRF1. EMBO Rep 3 ,
881–886.
9 Inagaki Y, Blouin C, Doolittle WF & Roger AJ (2002)
Convergence and constraint in eukaryotic release factor
1 (eRF1) domain 1: the evolution of stop codon speci-
ficity. Nucleic Acids Res 30, 532–544.
10 Chavatte L, Seit-Nebi A, Dubovaya V & Favre A
(2002) The invariant uridine of stop codons contacts the
conserved NIKSR loop of human eRF1 in the ribo-
some. EMBO J 21, 5302–5311.
11 Kolosov P, Frolova L, Seit-Nebi A, Dubovaya V, Kon-
onenko A, Oparina N, Justesen J, Efimov A & Kisselev
L (2005) Invariant amino acids essential for decoding
function of polypeptide release factor eRF1. Nucleic
Acids Res 33, 6418–6425.
12 Liang H & Landweber LF (2005) Molecular mimicry:
quantitative methods to study structural similarity
between protein and RNA. RNA 11, 1167–1172.
13 Kim OT, Yura K, Go N & Harumoto T (2005) Newly
sequenced eRF1s from ciliates: the diversity of stop
codon usage and the molecular surfaces that are impor-
tant for stop codon interactions. Gene 346, 277–286.
14 Salas-Marco J, Fan-Minogue H, Kallmeyer AK,
Klobutcher LA, Farabaugh PJ & Bedwell DM (2006)
Distinct paths to stop codon reassignment by the
variant-code organisms Tetrahymena and Euplotes. Mol
Cell Biol 26, 438–447.
15 Ito K, Ebihara K & Nakamura Y (1998) The stretch of
C-terminal acidic amino acids of translational release
factor eRF1 is a primary binding site for eRF3 of fis-
sion yeast. RNA 4, 958–972.
16 Ebihara K & Nakamura Y (1999) C-terminal interac-
tion of translational release factors eRF1 and eRF3 of
fission yeast: G-domain uncoupled binding and the role
of conserved amino acids. RNA 5, 739–750.
17 Merkulova TI, Frolova LY, Lazar M, Camonis J &
Kisselev LL (1999) C-terminal domains of human trans-
lation termination factors eRF1 and eRF3 mediate their
in vivo interaction. FEBS Lett 443, 41–47.
18 Eurwilaichitr L, Graves FM, Stansfield I & Tuite MF
(1999) The C-terminus of eRF1 defines a functionally
important domain for translation termination in Saccha-
romyces cerevisiae. Mol Microbiol 32, 485–496.
19 Frolova LY, Merkulova TI & Kisselev LL (2000)
Translation termination in eukaryotes: polypeptide
release factor eRF1 is composed of functionally and
structurally distinct domains. RNA 6, 381–390.
20 Frolova LY, Tsivkovskii RY, Sivolobova GF, Oparina
NY, Serpinsky OI, Blinov VM, Tatkov SI & Kisselev
LL (1999) Mutations in the highly conserved GGQ
motif of class 1 polypeptide release factors abolish abil-
ity of human eRF1 to trigger peptidyl-tRNA hydrolysis.
RNA 5, 1014–1020.
21 Nakamura Y & Ito K (2003) Making sense of mimic
in translation termination. Trends Biochem Sci 28, 99–
105.
22 Poole ES, Askarian-Amiri ME, Major LL, McCaughan
KK, Scarlett DJ, Wilson DN & Tate WP (2003)
Molecular mimicry in the decoding of translational stop
signals. Prog Nucleic Acid Res Mol Biol 74, 83–121.
23 Klaholz BP, Pape T, Zavialov AV, Myasnikov AG, Orl-
ova EV, Vestergaard B, Ehrenberg M & van Heel M
(2003) Structure of the Escherichia coli ribosomal termi-
nation complex with release factor 2. Nature 421, 90–94.
24 Rawat UB, Zavialov AV, Sengupta J, Valle M, Grass-
ucci RA, Linde J, Vestergaard B, Ehrenberg M &
Frank J (2003) A cryo-electron microscopic study of
ribosome-bound termination factor RF2. Nature 421,
87–90.
25 Petry S, Brodersen DE, Murphy FVT, Dunham CM,
Selmer M, Tarry MJ, Kelley AC & Ramakrishnan V
(2005) Crystal structures of the ribosome in complex
with release factors RF1 and RF2 bound to a cognate
stop codon. Cell 123 , 1255–1266.
26 Scarlett DJ, McCaughan KK, Wilson DN & Tate WP
(2003) Mapping functionally important motifs SPF and
GGQ of the decoding release factor RF2 to the Escheri-
chia coli ribosome by hydroxyl radical footprinting.
Implications for macromolecular mimicry and structural
changes in RF2. J Biol Chem 278, 15095–15104.
27 Chavatte L, Frolova L, Laugaa P, Kisselev L & Favre
A (2003) Stop codons and UGG promote efficient bind-
ing of the polypeptide release factor eRF1 to the ribo-
somal A site. J Mol Biol 331, 745–758.
28 Ma B & Nussinov R (2004) Release factors eRF1 and
RF2: a universal mechanism controls the large confor-
mational changes. J Biol Chem 279, 53875–53885.
29 Nissen P, Kjeldgaard M & Nyborg J (2000) Macro-
molecular mimicry. EMBO J 19, 489–495.
30 Seit-Nebi A, Frolova L, Justesen J & Kisselev L (2001)
Class-1 translation termination factors: invariant GGQ
minidomain is essential for release activity and ribosome
binding but not for stop codon recognition. Nucleic
Acids Res 29, 3982–3987.
31 Zavialov AV, Mora L, Buckingham RH & Ehrenberg
M (2002) Release of peptide promoted by the GGQ
motif of class 1 release factors regulates the GTPase
activity of RF3. Mol Cell 10 , 789–798.
32 Mora L, Heurgue-Hamard V, Champ S, Ehrenberg M,
Kisselev LL & Buckingham RH (2003) The essential
E. V. Ivanova et al. NMR structure and dynamics of eRF1 middle domain
FEBS Journal 274 (2007) 4223–4237 ª 2007 The Authors Journal compilation ª 2007 FEBS 4235
role of the invariant GGQ motif in the function and
stability in vivo of bacterial release factors RF1 and
RF2. Mol Microbiol 47, 267–275.
33 Dubovaia VI, Kolosov PM, Alkalaeva EZ, Frolova L
& Kiselev LL (2006) Influence of individual domains of
the translation termination factor eRF1 on induction of
the GTPase activity of the translation termination factor
eRF3. Mol Biol (Mosk) 40, 310–316.
34 Hamelberg D & McCammon JA (2005) Fast peptidyl
cis-trans isomerization within the flexible Gly-rich flaps
of HIV-1 protease. J Am Chem Soc 127, 13778–13779.
35 Gao F, Mer G, Tonelli M, Hansen SB, Burghardt TP,
Taylor P & Sine SM (2006) Solution NMR of
acetylcholine binding protein reveals agonist-mediated
conformational change of the C-loop. Mol Pharmacol
70, 1230–1235.
36 Kleerekoper Q, Hecht JT & Putkey JA (2002) Disease-
causing mutations in cartilage oligomeric matrix protein
cause an unstructured Ca
2+
binding domain. J Biol
Chem 277, 10581–10589.
37 Clore GM, Szabo A, Bax A, Kay LE, Driscoll PC &
Gronenborn AM (1990) Deviations from the simple
2-parameter model-free approach to the interpretation
of N-15 nuclear magnetic-relaxation of proteins. JAm
Chem Soc 112, 4989–4991.
38 Ban N, Nissen P, Hansen J, Moore PB & Steitz TA
(2000) The complete atomic structure of the large
ribosomal subunit at 2.4 A resolution. Science 289,
905–920.
39 Yusupov MM, Yusupova GZ, Baucom A, Lieberman
K, Earnest TN, Cate JH & Noller HF (2001) Crystal
structure of the ribosome at 5.5 A
˚
resolution. Science
292, 883–896.
40 Cannone JJ, Subramanian S, Schnare MN, Collett JR,
Du D’Souza LMY, Feng B, Lin N, Madabusi LV, Mul-
ler KM, Pande N et al. (2002) The comparative RNA
web (CRW) site: an online database of comparative
sequence and structure information for ribosomal,
intron, and other RNAs. BMC Bioinformatics 3,2.
41 Jeffrey GA (1997) An Introduction to Hydrogen Bonding.
Oxford University Press, New York, NY.
42 Molday RS, Englande. SW & Kallen RG (1972) Pri-
mary structure effects on peptide group hydrogen-
exchange. Biochemistry 11, 150–158.
43 Dincbas-Renqvist V, Engstrom A, Mora L, Heurgue-
Hamard V, Buckingham R & Ehrenberg M (2000) A
post-translational modification in the GGQ motif of
RF2 from Escherichia coli stimulates termination of
translation. EMBO J 19, 6900–6907.
44 Heurgue-Hamard V, Champ S, Mora L, Merkulova-
Rainon T, Kisselev LL & Buckingham RH (2005) The
glutamine residue of the conserved GGQ motif in Sac-
charomyces cerevisiae release factor eRF1 is methylated
by the product of the YDR140w gene. J Biol Chem 280,
2439–2445.
45 Seit Nebi A, Frolova L, Ivanova N, Poltaraus A &
Kisselev L (2000) Mutation of a glutamine residue in
the universal tripeptide GGQ in human eRF1 termina-
tion factor does not cause complete loss of its activity.
Mol Biol (Mosk) 34, 899–900.
46 Williamson RA, Muskett FW, Howard MJ, Freedman
RB & Carr MD (1999) The effect of matrix metallopro-
teinase complex formation on the conformational
mobility of tissue inhibitor of metalloproteinases-2
(TIMP-2). J Biol Chem 274, 37226–37232.
47 Privalov PL, Jelesarov I, Read CM, Dragan AI &
Crane-Robinson C (1999) The energetics of HMG box
interactions with DNA: thermodynamics of the DNA
binding of the HMG box from mouse Sox-5. J Mol Biol
294, 997–1013.
48 Baleja JD, Marmorstein R, Harrison SC & Wagner G
(1992) Solution structure of the DNA-binding domain
of Cd2-Gal4 from Saccharomyces cerevisiae. Nature 356,
450–453.
49 Delaglio F, Grzesiek S, Vuister GW, Zhu G, Pfeifer J &
Bax A (1995) NMRPipe: a multidimensional spectral
processing system based on UNIX pipes. J Biomol
NMR 6, 277–293.
50 Zimmerman DE, Kulikowski CA, Huang Y, Feng W,
Tashiro M, Shimotakahara S, Chien C, Powers R &
Montelione GT (1997) Automated analysis of protein
NMR assignments using methods from artificial intelli-
gence. J Mol Biol 269, 592–610.
51 Ivanova EV, Kolosov PM, Birdsall B, Kisselev LL &
Polshakov VI (2006) NMR assignments of the middle
domain of human polypeptide release factor eRF1.
J Biomol NMR 36, suppl. 1, 8.
52 Bax A & Grzesiek S (1993) Methodological advances in
protein NMR. Acc Chem Res 26, 131–138.
53 Ruckert M & Otting G (2000) Alignment of biological
macromolecules in novel nonionic liquid crystalline
media for NMR experiments. J Am Chem Soc 122,
7793–7797.
54 Ottiger M, Delaglio F & Bax A (1998) Measurement of
J and dipolar couplings from simplified two-dimensional
NMR spectra. J Magn Reson 131, 373–378.
55 Kay LE, Torchia DA & Bax A (1989) Backbone
dynamics of proteins as studied by
15
N inverse
detected heteronuclear NMR spectroscopy: applica-
tion to staphylococcal nuclease. Biochemistry 28,
8972–8979.
56 Boyd J, Hommel U & Campbell ID (1990) Influence of
cross-correlation between dipolar and anisotropic chem-
ical-shift relaxation mechanisms upon longitudinal
relaxation rates of N-15 in macromolecules. Chem Phys
Lett 175, 477–482.
57 Cornilescu G, Delaglio F & Bax A (1999) Protein back-
bone angle restraints from searching a database for
chemical shift and sequence homology. J Biomol NMR
13, 289–302.
NMR structure and dynamics of eRF1 middle domain E. V. Ivanova et al.
4236 FEBS Journal 274 (2007) 4223–4237 ª 2007 The Authors Journal compilation ª 2007 FEBS
58 Polshakov VI, Frenkiel TA, Birdsall B, Soteriou A &
Feeney J (1995) Determination of stereospecific assign-
ments, torsion-angle constraints, and rotamer popula-
tions in proteins using the program AngleSearch.
J Magn Reson B 108, 31–43.
59 Nilges M, Macias MJ, O’Donoghue SI & Oschkinat H
(1997) Automated NOESY interpretation with
ambiguous distance restraints: the refined NMR
solution structure of the pleckstrin homology domain
from beta-spectrin. J Mol Biol 269, 408–422.
60 Linge JP, Habeck M, Rieping W & Nilges M (2003)
ARIA: automated NOE assignment and NMR structure
calculation. Bioinformatics 19, 315–316.
61 Schwieters CD, Kuszewski JJ, Tjandra N &
Clore GM (2003) The Xplor-NIH NMR molecular
structure determination package. J Magn Reson 160,
65–73.
62 Bru
¨
nger AT (1992) X-PLOR: a System for X-Ray Crys-
tallography and NMR, 17th edn. Yale University Press,
New Haven, CT.
63 Kuszewski J, Gronenborn AM & Clore GM (1997)
Improvements and extensions in the conformational
database potential for the refinement of NMR and
X-ray structures of proteins and nucleic acids. J Magn
Reson 125, 171–177.
64 Laskowski RA, Rullmannn JA, MacArthur MW,
Kaptein R & Thornton JM (1996) AQUA and PRO-
CHECK-NMR: programs for checking the quality of
protein structures solved by NMR. J Biomol NMR 8,
477–486.
65 Koradi R, Billeter M & Wuthrich K (1996) MOLMOL:
a program for display and analysis of macromolecular
structures. J Mol Graph 14, 51–55.
66 Farrow NA, Muhandiram R, Singer AU, Pascal SM,
Kay CM, Gish G, Shoelson SE, Pawson T, Forman-
Kay JD & Kay LE (1994) Backbone dynamics of a free
and phosphopeptide-complexed Src homology 2 domain
studied by
15
N NMR relaxation. Biochemistry 33, 5984–
6003.
67 Lipari G & Szabo A (1982) Model-free approach to the
interpretation of nuclear magnetic-resonance relaxation
in macromolecules. 2. Analysis of experimental results.
J Am Chem Soc 104, 4559–4570.
68 Clore GM, Driscoll PC, Wingfield PT & Gronenborn
AM (1990) Analysis of the backbone dynamics of inter-
leukin-1 beta using two-dimensional inverse detected
heteronuclear 15N)1H NMR spectroscopy. Biochemis-
try 29, 7387–7401.
69 Polshakov VI, Birdsall B, Frenkiel TA, Gargaro AR &
Feeney J (1999) Structure and dynamics in solution
of the complex of Lactobacillus casei dihydrofolate
reductase with the new lipophilic antifolate drug trimet-
rexate. Protein Sci 8, 467–481.
70 Tillett ML, Blackledge MJ, Derrick JP, Lian LY &
Norwood TJ (2000) Overall rotational diffusion and
internal mobility in domain II of protein G from Strep-
tococcus determined from N-15 relaxation data. Protein
Sci 9, 1210–1216.
71 Altschul SF, Madden TL, Schaffer AA, Zhang J, Zhang
Z, Miller W & Lipman DJ (1997) Gapped BLAST and
PSI-BLAST: a new generation of protein database
search programs. Nucleic Acids Res 25, 3389–3402.
Supplementary material
The following supplementary material is available
online:
Fig. S1. Plot of the number and distribution of NOEs
against the amino acid sequence used in structure
calculation of the M domain of human eRF1.
Fig. S2. The Ramachandran map plot (/ and w tor-
sion angles for the protein backbone) of all 25 con-
formers of the NMR family of solution structures of
the M domain of human eRF1.
Fig. S3. A surface representation of the M domain of
human eRF1, mapping the electrostatic potential.
Fig. S4. A comparison of part of the protein backbone
structure of the representative solution structure of
the human eRF1 M domain and the Ca trace in the
crystal structure of RF1 in the whole ribosome struc-
ture (Protein Data Bank code 2b64) presented as a
stereo view.
This material is available as part of the online article
from
Please note: Blackwell Publishing is not responsible
for the content or functionality of any supplementary
materials supplied by the authors. Any queries (other
than missing material) should be directed to the corre-
sponding author for the article.
E. V. Ivanova et al. NMR structure and dynamics of eRF1 middle domain
FEBS Journal 274 (2007) 4223–4237 ª 2007 The Authors Journal compilation ª 2007 FEBS 4237