Báo cáo khoa học: Characterization of inhibitors of phosphodiesterase 1C on a human cellular system potx
Bạn đang xem bản rút gọn của tài liệu. Xem và tải ngay bản đầy đủ của tài liệu tại đây (786.72 KB, 13 trang )
Characterization of inhibitors of phosphodiesterase 1C on
a human cellular system
Torsten R. Dunkern and Armin Hatzelmann
Biochemistry 2 Inflammation, ALTANA Pharma AG, Member of the Nycomed Group, Konstanz, Germany
Keywords
glioblastoma cell line; 8-methoxymethyl-
3-isoabutyl-1-methylxanthine;
phosphodiesterase 1C; SCH51866;
vinpocetine
Correspondence
T. R. Dunkern, Department of Biochemistry
Inflammation RPR ⁄ B2, ALTANA Pharma
AG, Member of the Nycomed Group,
Byk-Gulden-Str. 2, 78467 Konstanz,
Germany
Fax: +49 7531 84 2712
Tel: +49 7531 84 3121
E-mail:
(Received 25 April 2007, revised 17 July
2007, accepted 19 July 2007)
doi:10.1111/j.1742-4658.2007.06001.x
Different inhibitors of the Ca
2+
⁄ calmodulin-stimulated phosphodiester-
ase 1 family have been described and used for the examination of phospho-
diesterase 1 in cellular, organ or animal models. However, the inhibitors
described differ in potency and selectivity for the different phosphodiester-
ase family enzymes, and in part exhibit additional pharmacodynamic
actions. In this study, we demonstrate that phosphodiesterase 1C is
expressed in the human glioblastoma cell line A172 with regard to mRNA,
protein and activity level, and that lower activities of phosphodiesterase 2,
phosphodiesterase 3, phosphodiesterase 4 and phosphodiesterase 5 are also
present. The identity of the phosphodiesterase 1C activity detected was ver-
ified by downregulation of the mRNA and protein through human phos-
phodiesterase 1C specific small interfering RNA. In addition, the measured
K
m
values (cAMP, 1.7 lm; cGMP, 1.3 lm) are characteristic of phospho-
diesterase 1C. We demonstrate that treatment with the Ca
2+
ionophore
ionomycin increases intracellular Ca
2+
in a concentration-dependent way
without affecting cell viability. Under conditions of enhanced intracellular
Ca
2+
concentration, a rapid increase in cAMP levels caused by the ade-
nylyl cyclase activator forskolin was abolished, indicating the involvement
of Ca
2+
-activated phosphodiesterase 1C. The reduction of forskolin-stimu-
lated cAMP levels was reversed by phosphodiesterase 1 inhibitors in a con-
centration-dependent way. Using this cellular system, we compared the
cellular potency of published phosphodiesterase 1 inhibitors, including
8-methoxymethyl-3-isobutyl-1-methylxanthine, vinpocetine, SCH51866, and
two established phosphodiesterase 1 inhibitors developed by Schering-
Plough (named compounds 31 and 30). We demonstrate that up to 10 lm
8-methoxymethyl-3-isobutyl-1-methylxanthine and vinpocetine had no
effect on the reduction of forskolin-stimulated cAMP levels by ionomycin,
whereas the more selective and up to 10 000 times more potent phosphodi-
esterase 1 inhibitors SCH51866, compound 31 and compound 30 inhibited
the ionomycin-induced decline of forskolin-induced cAMP at nanomolar
concentrations. Thus, our data indicate that SCH51866 and compounds 31
and 30 are effective phosphodiesterase 1 inhibitors in a cellular context, in
contrast to the weakly selective and low-potency phosphodiesterase inhibi-
tors 8-methoxymethyl-3-isobutyl-1-methylxanthine and vinpocetine. A172
cells therefore represent a suitable system in which to study the cellular
effect of phosphodiesterase 1 inhibitors. 8-Methoxymethyl-3-isobutyl-
1-methylxanthine and vinpocetine seem not to be suitable for the study of
phosphodiesterase 1-mediated functions.
Abbreviations
IL, interleukin; 8MM-IBMX, 8-methoxymethyl-3-isobutyl-1-methylxanthine; PDE, phosphodiesterase; si, small interfering.
4812 FEBS Journal 274 (2007) 4812–4824 ª 2007 The Authors Journal compilation ª 2007 FEBS
The superfamily of cyclic nucleotide-hydrolyzing phos-
phodiesterase (PDE) enzymes comprises 11 family
members (PDE1–PDE11). Within each family, differ-
ent genes encode different PDE subtypes, and alterna-
tive splicing of the messenger RNAs generates multiple
isoforms. The entire PDE superfamily consists of
about 50 proteins [1]. The historical classification into
different PDE families is based on their substrate spec-
ificity for cAMP, cGMP or both, and mechanisms of
activation and inhibitor sensitivity. The PDE family
PDE1, which consists of the subtypes PDE1A, PDE1B
and PDE1C, each encoded by one gene, becomes acti-
vated upon Ca
2+
⁄ calmodulin binding. Thus, PDE1
enzymes enable signaling crosstalk between the two
important cellular second messengers Ca
2+
and cyclic
nucleotides, translating changes in Ca
2+
concentra-
tions into changes in cAMP ⁄ cGMP concentrations.
PDE1A is highly expressed in the brain as well as in
spermatozoa. PDE1B1 mRNA is present in neuronal
cells of the cerebellum, caudate, and hippocampus,
and in Purkinje cells [2]. In addition, PDE1B1 was
found in the heart and skeletal muscles [3]. PDE1C,
for which the three splicing variants PDE1C1,
PDE1C2 and PDE1C3 have been described [4], is
expressed in human arterial smooth muscle cells [5],
nociceptive sensory neurons [6], the myocardium [7],
and beta TC3 insulinoma cells [8].
PDE1 enzymes have been reported to be involved in
heterogeneous functions such as smooth muscle cell
proliferation (PDE1C [5]), Cl
–
secretion by human
colonic epithelial cells [9], interleukin (IL)-13 produc-
tion by CD3 ⁄ CD28-stimulated human T-lymphocytes
[10], the acrosome reaction of human spermatozoa
[11], lipopolysaccharide-induced IL-6 release from alve-
olar epithelial cells [12], glucose-induced insulin secre-
tion from insulinoma cells [8], contraction of ureteral
smooth muscle cells [13], hypoxic pulmonary remodel-
ing [14], granulocyte–macrophage colony-stimulating
factor-induced human monocyte-to-macrophage differ-
entiation (PDE1B [15]), and gall bladder relaxation
[16].
Until now, knowledge on the function of PDE1 in
different cell types, organs or even animal models has
come from the experimental use of more or less weak
inhibitors with relatively low PDE1 selectivity, such as
vinpocetine and 8-methoxymethyl-3-isobutyl-1-methyl-
xanthine (8MM-IBMX) [with the exception of some
PDE1-targeting small interfering (si)RNA approaches]
[17]. Unfortunately, changes in cyclic nucleotide con-
centrations, which are indicative of PDE-inhibitory
action, were often not investigated in such studies.
This gives rise to the question of the validity of inter-
pretations based on results obtained with the use of
these compounds, especially as other modes of action
besides PDE inhibition have been documented for the
nootropic drug vinpocetine as well as for 8MM-IBMX,
such as modulation of ion currents [18–20] and adeno-
sine receptor inhibition [21], respectively.
Because of the lack of a cellular model that allows
separate monitoring of PDE1 activity, no comparison
of the cellular potency of PDE1 inhibitors described in
the literature has been performed up to now. This is
important, because the cellular efficiency of PDE
inhibitors does not only depend on their potency. It is
also affected by their physicochemical properties, such
as lipophilicity, which influences membrane permeabil-
ity, and the subcellular localization. Furthermore, cel-
lular potency is influenced by the concentrations of the
substrates in the subcellular local environment, due to
competition with the PDE inhibitors.
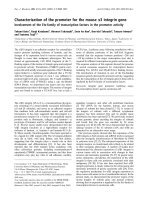
Thus, we developed a cellular model using PDE1C-
expressing A172 glioblastoma cells that allows us to
quantitatively monitor the effects of the PDE1-inhibit-
ing compounds 8MM-IBMX, vinpocetine, SCH51866,
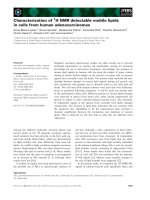
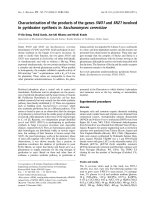
compound 30, and compound 31 (Fig. 1) on PDE1C
activity under conditions of enhanced intracellular
Ca
2+
concentration.
Results
Human glioblastoma A172 cells express
Ca
2+
/calmodulin-activated PDE1C
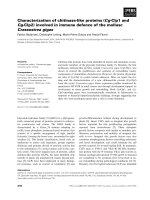
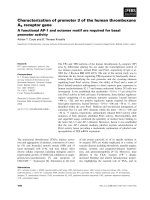
As shown in Fig. 2, we identified high Ca
2+
⁄ calmodu-
lin-induced cAMP ⁄ cGMP PDE activity in the cellular
extract of A172 cells; this therefore must be considered
to be PDE1 enzyme activity. In comparison to the
described PDE1 activity of other cell types, such as
eosinophils, macrophages, CD4
+
⁄ CD8
+
T-lympho-
cytes and A549 epithelial cells [22], the measured
PDE1 activity in A172 cells was up to 10 000-fold
higher. The similar PDE activity with regard to the
rate of cAMP and cGMP hydrolysis was a first indica-
tion that this might be PDE1C activity. This enzyme is
well known to hydrolyze both cyclic nucleotides with
similar efficiency, in contrast to PDE1A and PDE1B.
Our assumption was confirmed by determining the
corresponding K
m
values, which were very similar
for both cAMP (1.7 lm) and cGMP (1.3 lm) hydro-
lysis (published data for the other PDE1 sub-
types: PDE1A2, K
m
[cAMP ⁄ cGMP] ¼ 112.7 ⁄ 5.0 lm;
PDE1B1, K
m
[cAMP ⁄ cGMP] ¼ 24.3 ⁄ 2.7 lm) and were
also similar to the published data for PDE1C [4]. In
addition, lower activities of PDE5 and PDE4 and
minor activities for PDE2 and PDE3 were measured.
In accordance with the data for PDE activity, we
T. R. Dunkern and A. Hatzelmann Characterization of inhibitors of PDE1C
FEBS Journal 274 (2007) 4812–4824 ª 2007 The Authors Journal compilation ª 2007 FEBS 4813
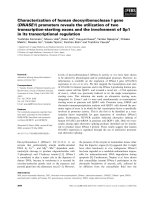
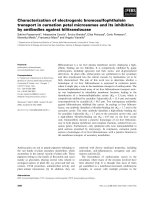
confirmed the expression of PDE1C protein in A172
cells by western blotting (Fig. 3A), in which recombi-
nant PDE1C protein served as a molecular mass con-
trol. More precisely, we detected two protein bands
that probably reflected the PDE1C splice variants ⁄ iso-
forms PDE1C1 and presumably PDE1C3 (based on
the determined molecular masses of 72 and 75 kDa).
The polyclonal antibody used has been reported to
detect different isoforms of PDE1C. We confirmed
that this antibody shows only negligible crossreactivity
with PDE1A and PDE1B (data not shown). To verify
the identity of the two observed protein bands and
thus the specificity of the antibody used, we performed
transfections with PDE1C (isotype-unspecific) siRNA
smart pools. As shown in Fig. 3B, 48 h after transfec-
tion of A172 cells with 10 nm PDE1C-targeted siRNA,
PDE1C mRNA expression was strongly reduced by
about a factor of 5. Consequently, 72 h after siRNA
transfection, expression of the two protein bands was
also reduced by about 60% in comparison to negative
control siRNA-transfected cells (Fig. 3C), which ulti-
mately proved them to be identical to PDE1C. Using
the same PDE1C siRNA smart pool, we were also able
to reduce PDE1C mRNA and protein expression in
A549 cells, which further demonstrates the specificity
of the siRNA (data not shown).
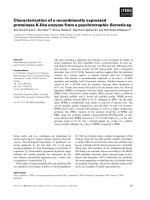
Ionomycin treatment increases intracellular Ca
2+
concentrations and activates PDE1C in A172 cells
To monitor Ca
2+
-mediated PDE1C activation, we
treated A172 cells with different concentrations of iono-
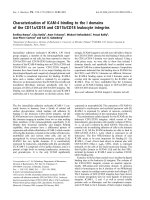
mycin. As shown in Fig. 4A, ionomycin (2–10 lm)
increased intracellular Ca
2+
concentration over 30 min
in a dose-dependent manner.
It was important to assess the concentrations of iono-
mycin that cells could tolerate over a 30 min period.
Cells were therefore preincubated for 30 min with a
range of ionomycin concentrations up to 10 lm, and
then with 10 lm ionomycin plus 5 mm Ca
2+
to elicit a
maximum Ca
2+
response (indicated by a dashed arrow
in Fig. 4A). This response no longer occurred when the
ionomycin concentration in the 30 min preincubation
N
N
N
N
N
N
O
O
O
H
H
Vinpocetin
8MM-IBMX
N
N
N
N
N
H
O
F
F
F
SCH51866
N
N
N
N
N
O
N
N
N
N
N
O
31
30
O
O
Fig. 1. Molecular structures of the PDE1
inhibitors vinpocetine, 8MM-IBMX,
SCH51886, and compounds 30 and 31.
PDE1 [cAMP]
PDE1 [cGMP]
PDE2 [cGMP]
PDE3 [cAMP]
PDE4 [cAMP]
PDE5 [cGMP]
0
10000
20000
30000
40000
PDE activity
pmol x min
-1
x 10
8
cells
-1
Fig. 2. Expression of family-specific PDE activities in A172 cells.
Cells were analyzed for PDE1 (cAMP and cGMP), PDE2, PDE3,
PDE4 and PDE5 hydrolysis activity. The mean values and standard
deviations of 10 independent experiments are shown. The sub-
strates (cAMP ⁄ cGMP) used to determine each PDE activity are
shown in parentheses.
Characterization of inhibitors of PDE1C T. R. Dunkern and A. Hatzelmann
4814 FEBS Journal 274 (2007) 4812–4824 ª 2007 The Authors Journal compilation ª 2007 FEBS
phase was higher than 6 lm, which suggests a cyto-
toxic effect of ionomycin at these higher concentra-
tions. The addition of 50 mm EGTA (as a control) at
the end of the experiment (indicated by a solid arrow
in Fig. 4A) decreased the Ca
2+
signal. On the basis of
these results, 6 lm ionomycin (in the presence of 5 mm
Ca
2+
in the medium, 6 min incubation time) was used
in further experiments to rapidly increase intracellular
Ca
2+
concentrations (Fig. 4B). Under these condi-
tions, the elicited Ca
2+
signal measured at 6 min was
about 40% of the maximal possible Ca
2+
signal and
thus not in the saturation phase. To further verify that
these treatment conditions did not affect cell viability,
cytotoxicity assays were performed. In contrast to vari-
ous concentrations of Triton X-100, which served as
positive controls, treatment with 6 lm ionomycin for
15 min did not affect the viability of A172 cells
(Fig. 4C).
As shown in Fig. 5, treatment of A172 cells with the
adenylyl cyclase activator forskolin (10 lm) for 1, 5
and 20 min time-dependently increased intracellular
cAMP concentrations up to three-fold in comparison
to mock-treated controls. However, pretreatment of
the cells with ionomycin for 5 min to increase intracel-
lular Ca
2+
concentrations abolished or attenuated the
forskolin-induced increase in cAMP, which we consid-
ered to be due to the activation of PDE1C in these
cells under these conditions.
Inhibitors of PDE1 block the ionomycin-induced
decrease in forskolin-induced cAMP
concentrations
Various inhibitors of PDE1 are described in the litera-
ture, including vinpocetine, 8MM-IBMX, SCH51866,
and the Schering-Plough compounds 31 and 30 [23].
PDE1C
Lipid
ERK2
Control
PDE1C
siRNA
Lipid
Negative control siRNA
PDE1C siRNA
0
5000
10000
PDE1C protein expression
(arbitrary densitometric units)
PDE1C
A
BC
2010
30
1 2.5
A172 cells
Sf21/PDE1C1
63.2 kDa
82.2 kDa
0
1
1.2
0.8
0.6
0.4
0.2
Negative control siRNA
Lipid
PDE1C siRNA
PDE1C mRNA
(relative expression)
µg
Fig. 3. PDE1C protein and mRNA are
expressed in A172 gliobastoma cells. (A) 10,
20 and 30 lg of A172 cell extracts were
analyzed for PDE1C protein expression by
western blotting. Cell lysate from Sf21
insect cells (1 and 2.5 lg) transfected with
human PDE1C1 was used as a control.
Molecular mass markers are shown to the
right of the blot. (B, C) PDE1C siRNA (smart
pool; 10 n
M) ⁄ negative control siRNA was
transfected into A172 cells. Forty-eight
hours later, the cells were harvested for
mRNA generation and subsequent cDNA
synthesis. The expression of PDE1C mRNA
was analyzed by real-time PCR in relation to
lipid-treated cells (B). The mean values and
standard deviations of three experiments
are shown. Otherwise, cells were harvested
72 h after transfection, and analyzed for
PDE1C protein expression by western blot-
ting and densitometric analysis (C). To con-
firm equal protein loading, the blot was
additionally incubated with an antibody to
ERK2.
T. R. Dunkern and A. Hatzelmann Characterization of inhibitors of PDE1C
FEBS Journal 274 (2007) 4812–4824 ª 2007 The Authors Journal compilation ª 2007 FEBS 4815
We investigated these compounds with regard to
potency against PDE1A3, PDE1B1 and PDE1C1 and
overall PDE selectivity (Table 1). The rank order of
potency of these compounds against PDE1C1 is
compound 31 > compound 30 > SCH51866 > 8MM-
IBMX > vinpocetine. Indeed, the frequently used
PDE1 inhibitors vinpocetine and 8MM-IBMX have low
potency (IC
50
values 100 lm and 10 lm, respectively)
and selectivity vs. other PDEs. The IC
50
values that we
have determined for inhibition of the PDE1 enzymes by
these compounds agree with those in the literature
[23–26].
Next, we analyzed the effect of these inhibitors on
the ionomycin-induced decrease in forskolin-stimulated
cAMP concentrations in A172 cells. Figure 6A shows
that SCH51866 reversed the ionomycin-induced
decrease in cAMP concentrations in a concentration-
dependent manner. Even 10 nm of this PDE1 inhibitor
proved to be significantly effective. At this concentra-
tion, no other PDE expressed in A172 cells other than
PDE1C was inhibited by this compound (Table 1),
and thus the observed effect must be attributed exclu-
sively to the inhibition of PDE1C. In contrast, without
addition of ionomycin and thus with basal intracellular
Ca
2+
concentrations, SCH51866 (up to 100 nm) did
not potentiate the increase in cAMP induced by fors-
kolin (Fig. 6B). Compounds 31 and 30 proved to be
inhibitors with higher enzymatic potency (Table 1).
Accordingly, as shown in Fig. 7A, these compounds
also proved to be cellularly strongly effective. Thus,
compound 30 became significantly effective at 10 nm,
and compound 31 at 1 nm, in modulating intracellular
cAMP concentrations. The effect of these two com-
pounds developed by Schering-Plough proved also to
be concentration dependent. However, at higher con-
centrations, these compounds (as also observed for
RFU
6000
11000
16000
21000
26000
31000
36000
Control
Ionomycin
5
10
15
Time (min)
A
B
0.005%
0.010%
0.015%
0.020%
Ionomycin
0
50
100
Triton X-100
Death cells (%)
C
RFU
Time (min)
10000
20000
30000
40000
50000
Control
2 µM
4 µM
6 µM
8 µM
10 µM
15
30
Fig. 4. Ionomycin treatment up to 6 lM con-
centration-dependently induces an increase
in intracellular Ca
2+
concentrations in A172
cells without inducing cytotoxicity. (A) Fluo
3-mix dye-loaded A172 cells were treated
for 30 min with increasing concentrations
(2–10 l
M) of ionomycin. The increase in
intracellular Ca
2+
concentrations was ana-
lyzed by scanning fluorometry. After that
time period, 5 m
M Ca
2+
and ionomycin (to a
final concentration of 10 l
M) were added
(dotted arrow) to elicit a maximum Ca
2+
response to (a) confirm that the cells are
still able to respond to a Ca
2+
signal and (b)
determine the maximal possible Ca
2+
signal
intensity. Thereafter, EGTA (solid arrow)
was added; this decreased the signal. As
shown in (B), the addition of ionomycin
(straight arrow) and 5 m
M Ca
2+
(dotted
arrow) induced a rapid increase in intracellu-
lar Ca
2+
concentrations (the mean values
and standard deviations of three experi-
ments are shown). (C) As measured by lac-
tate dehydrogenase assays, treatment of
A172 cells with 6 l
M ionomycin plus 5 mM
Ca
2+
for 15 min did not induce any cytotox-
icity, whereas Triton X-100, which served as
a positive control, induced cytotoxicity in a
concentration-dependent manner.
Characterization of inhibitors of PDE1C T. R. Dunkern and A. Hatzelmann
4816 FEBS Journal 274 (2007) 4812–4824 ª 2007 The Authors Journal compilation ª 2007 FEBS
SCH51866) also enhanced the forskolin-induced
increase in intracellular cAMP concentrations, which
might not be due to the inhibition of PDE1C. At these
concentrations of compounds 31 and 30, the cAMP-
hydrolyzing PDE2, PDE3 and PDE4, which are also
expressed in A172 cells, became inhibited. Thus, the
inhibition of these PDE family members might account
for this effect. Figure 7B demonstrates that the concen-
trations of compounds 31 and 30, which are effective
in modulating cAMP in the presence of ionomycin, do
not modulate forskolin-induced cAMP concentrations
in the absence of ionomycin.
In contrast to SCH51866, and compounds 31 and
30, the older, well-described and widely used PDE1
inhibitors 8MM-IBMX and vinpocetine from 10 nm
up to 10 lm (which are concentrations reported in
many publications to be effective on organs or cells)
did not influence the ionomycin-induced decrease in
cAMP concentrations (Fig. 8A). This is indicative of
their weak cellular potency, which is of course related
to a low enzymatic potency (Table 1). In the absence
of ionomycin, they also did not influence forskolin-
induced cAMP concentrations (Fig. 8B).
Discussion
The heterogeneous expression of human PDEs
throughout the human body and their diverse func-
tions make this enzyme superfamily an attractive
target for pharmaceutical inhibitor development.
Whereas inhibitors of PDE5, PDE4 and PDE3 have
undergone clinical trials in the past, are even
approved as drugs, and are still under development
for various indications such as asthma, pulmonary
hypertension and chronic obstructive pulmonary dis-
ease, inhibitors of other PDE subtypes are mostly in
preclinical development phases. This is due to the lim-
ited information on the function of these enzymes, a
lack of target-specific cellular test systems for drug
screening purposes, and their drugability. The cellular
1 5 20
0.00
0.25
0.50
0.75
1.00
1.25
1.50
Control
Ionomycin
Forskolin
Forskolin +
Ionomycin
Time (min)
cAMP (pmol/1x10
6
cells)
Fig. 5. Pretreatment of A172 cells with ionomycin dampens a fors-
kolin-induced increase in intracellular cAMP concentrations. A172
cells pretreated with ionomycin (6 l
M) or untreated were stimu-
lated for adenylyl cyclase activation with forskolin (10 l
M) or vehicle
(control). cAMP was measured 1 min, 5 min and 20 min after fors-
kolin stimulation in the corresponding cellular extracts by cAMP-
ELISA. The result of a representative experiment is shown.
Table 1. Inhibition of human PDE family members by vinpocetine, 8MM-IBMX, SCH51866 and compounds 31 and 30. The IC
50
(log M) val-
ues of the different compounds obtained from at least three independent experiments using recombinant human PDEs (PDE1A3, PDE1B1,
PDE1C1, PDE2A3, PDE3A1, PDE4D3, PDE4B2, PDE5A1, PDE7A1, PDE9A3, PDE9A5, PDE10A, PDE11A4) or PDEs from human platelets
(PDE3, PDE5) are shown. Dashes indicate that the corresponding measurements have not been performed.
Vinpocetine 8MM-IBMX SCH51866 Compound 31 Compound 30
PDE1A3 ) 4.8 ) 5.6 ) 8.0 ) 9.2 ) 8.8
PDE1B1 ) 4.7 ) 4.7 ) 7.0 ) 8.4 ) 8.0
PDE1C1 ) 4 ) 5 ) 7.1 ) 9.3 ) 8.6
PDE2A3 > ) 4 ) 4.6 ) 6.3 5.7 ) 5.3
PDE3 ⁄ 3A1 – ⁄ > ) 4–⁄ > ) 4 ) 4.9 ⁄ ––⁄ ) 5.8 – ⁄ ) 5.8
PDE4D3 ⁄ B2 – ⁄ > ) 5–⁄ ) 4.4 ) 5.3 ⁄ ––⁄ ) 6.2 – ⁄ ) 5.6
PDE5 ⁄ 5A1 – ⁄ > ) 4–⁄ ) 4.5 ) 6.4 ⁄
––⁄ ) 6.4 – ⁄ ) 6.2
PDE7A1 > ) 4>) 4>) 4>) 4>) 4
PDE9A3 ⁄ A5 – ⁄ > ) 4–⁄ > ) 4 ) 4.9 ⁄ ) 4.7 > ) 4>) 4
PDE10A > ) 4 ) 4.6 ) 5.4 ) 4.8 ) 4.6
PDE11A4 > ) 4 ) 4.6 ) 4.6 ) 5.5 ) 5.9
T. R. Dunkern and A. Hatzelmann Characterization of inhibitors of PDE1C
FEBS Journal 274 (2007) 4812–4824 ª 2007 The Authors Journal compilation ª 2007 FEBS 4817
functions of the PDE1 gene family have often been
analyzed by using the well-described PDE inhibitors
vinpocetine and 8MM-IBMX. Unfortunately, vinpoce-
tine and 8MM-IBMX possess other pharmacologic
activities in addition to the inhibition of PDEs
[18–21], which might interfere with the different find-
ings described in the literature, such as lipopolysac-
charide-induced IL-6 release from alveolar epithelial
cells [12], or gall bladder relaxation [16], and might
thus give rise to false interpretations.
In this article, we show that, in comparison to newer
compounds such as SCH51866 [24], compound 31 and
compound 30 [23], the ‘classic’ inhibitors vinpocetine
and 8MM-IBMX (Fig. 1) have low enzymatic potency
and low PDE subtype specificity. We asked: (a) what
the effective cellular concentration of these inhibitors
is; and (b) whether the difference in enzymatic potency
would also transfer to differing cellular potency. This
need not necessarily be true, as cellular potency also
depends on the physicochemical properties of inhibi-
tors, such as lipid ⁄ liquid distribution and membrane
permeability. Thus, we searched for a cellular testing
system that would allow us to measure a functional
outcome, which is explicitly due and directly linked to
the inhibition of PDE1.
We showed that the human glioblastoma cell line
A172 expresses high levels of Ca
2+
⁄ calmodulin-stimu-
lated PDE1C activity and protein. The identity of
PDE1C was confirmed by K
m
value determination,
demonstrating that the Ca
2+
⁄ calmodulin-stimulated
PDE1 activity can hydrolyze cAMP and cGMP with
nearly equal efficacy, as previously described [4]. Fur-
thermore, transfection of A172 cells with PDE1C
siRNA reduced the expression of the protein (as
shown by western blotting). Interestingly, it took 72 h
after siRNA transfection for the PDE1C protein level
to decrease, whereas mRNA was reduced earlier, sug-
gesting a long half-life of this protein in A172 cells. In
Control
Forskolin
Forskolin + Ionomycin
SCH 51866 -8 log M
SCH 51866 -7 log M
SCH 51866 -6 log M
SCH 51866 -5 log M
0
1
2
3
4
5
Forskolin + Ionomycin
5
15
*
**
***
***
cAMP (fold of control)
Control
Forskolin
SCH 51866 -8 log M
SCH 51866 -7 log M
SCH 51866 -6 log M
0
5
10
15
B
A
Forskolin
cAMP (fold of control)
*
*
*
*
Fig. 6. The PDE1 inhibitor SCH51866 concentration-dependently
reverses the ionomycin effect on the forskolin-induced increase in
intracellular cAMP concentrations. (A) A172 cells pretreated with
ionomycin (6 l
M) and SCH51866 () 8to) 5 log M final concentra-
tion) or untreated were stimulated for adenylyl cyclase activation
with forskolin (10 l
M) or vehicle (control). cAMP was measured
1 min after forskolin stimulation in the corresponding cellular
extracts by cAMP-ELISA. The mean values and standard deviations
of three independent experiments are shown. A statistical analysis
(Student’s paired t-test) was performed to compare the forskolin
plus ionomycin-treated group with those treated in addition with
SCH51866. (B) A172 cells were treated only with SCH51866 () 8
to ) 6 log
M final concentration) or vehicle (control), and stimulated
for adenylyl cyclase activation with forskolin (10 l
M); cAMP was
then measured. A statistical analysis (Student’s paired t-test) was
used to compare the forskolin-treated group with control cells.
*P<0.05, **P<0.01, ***P<0.005.
Characterization of inhibitors of PDE1C T. R. Dunkern and A. Hatzelmann
4818 FEBS Journal 274 (2007) 4812–4824 ª 2007 The Authors Journal compilation ª 2007 FEBS
addition to PDE1C activity in A172 cells, we identified
PDE4 activity and a minor amount of PDE3 activity
in A172 cells (both capable of hydrolyzing cAMP to
5¢-AMP), as well as cGMP-hydrolyzing PDE5.
In early experiments performed in our laboratories,
A172 cells were incubated with PDE1 inhibitors with
or without forskolin (to stimulate the adenylyl cyclase),
and intracellular cAMP was subsequently measured.
However, we did not observe any effects of the PDE1
inhibitors on intracellular cyclic nucleotide concentra-
tions within the PDE1-selective concentration range
(data not shown). Thus, we speculated that under the
given basal cell culture conditions, PDE1C might not
be active in these cells. To circumvent this, we treated
A172 cells with ionoymcin, which concentration-depen-
dently increased intracellular Ca
2+
concentrations by
Ca
2+
store depletion and extracellular Ca
2+
influx
within a few minutes (as measured by Ca
2+
imaging
scanning fluorometry), which in theory should lead to
an activation of PDE1C. We determined an optimal
ionomycin concentration for our experiments, which
induced no cytotoxicity and increased Ca
2+
concentra-
tions by about 40% of the maximal inducible Ca
2+
response in the time frame used for subsequent investi-
gations.
Cells pretreated with ionomycin in such a way
responded to forskolin with an attenuated or even
abolished increase in intracellular cAMP concentra-
tions. This demonstrates that the ionomycin-induced
increase in intracellular Ca
2+
concentration leads to
activation of the PDE1C enzyme, which then hydro-
lyzes cAMP generated by the forskolin-stimulated ade-
nylyl cyclase. Activation of PDE1C was seen 1 min
after ionomycin treatment of the cells. This cellular
system proved to be highly useful for the cellular
potency screening of PDE1 inhibitors. Pretreatment of
A172 cells with the three recently described PDE1
inhibitors SCH51866 [24], compound 31 and com-
pound 30 [23] reversed the attenuating effect of
ionomycin on forskolin-induced cAMP concentrations.
That means that, in comparison to forskolin plus
ionomycin-treated cells, the cAMP concentrations
increased. Interestingly, these compounds became
effective even at 1–10 nm, which is close to the IC
50
(measured at a competitive substrate concentration of
0.5 lm cAMP ⁄ cGMP) of these compounds for the
Control
Forskolin
30 -10 log M
30 -9 log M
30 -8 log M
31 -10 log M
31 -9 log M
31 -8 log M
0
1
2
3
4
B
A
Forskolin
*
***
***
***
***
cAMP (fold of control)
***
***
Control
Forskolin
Forskolin + Ionomycin
31 -10 log M
31 -9 log M
31 -8 log M
31 -7 log M
31 -6 log M
31 -5 log M
30 -10 log M
30 -9 log M
30 -8 log M
30 -7 log M
30 -6 log M
30 -5 log M
0
1
2
3
4
5
6
7
8
Forskolin + Ionomycin
*
***
**
***
*
*
*
**
cAMP (fold of control)
Fig. 7. The PDE1 inhibitors compound 31 and compound 30 con-
centration-dependently reverse the ionomycin effect on the forsko-
lin-induced increase in intracellular cAMP concentrations, starting at
1n
M. (A) A172 cells pretreated with ionomycin (6 lM) and com-
pounds 31 and 30 () 10 to ) 5 log
M final concentration) or
untreated were stimulated for adenylyl cyclase activation with fors-
kolin (10 l
M) or vehicle (control). cAMP was measured 1 min after
forskolin stimulation in the corresponding cellular extracts by
cAMP-ELISA. A statistical analysis (Student’s paired t-test) was
used to compare the forskolin plus ionomycin-treated group with
those treated in addition with compounds 31 and 30. (B) Cells were
treated only with compounds 31 and 30 () 10 to ) 8 log
M final
concentration) or vehicle (control), and stimulated for adenylyl
cyclase activation with forskolin (10 l
M); cAMP was then mea-
sured. A statistical analysis (Student’s paired t-test) was used to
compare the forskolin-treated group with control cells. *P<0.05,
**P<0.01, ***P<0.005.
T. R. Dunkern and A. Hatzelmann Characterization of inhibitors of PDE1C
FEBS Journal 274 (2007) 4812–4824 ª 2007 The Authors Journal compilation ª 2007 FEBS 4819
human PDE1C enzyme. Within this concentration
range, or even higher, up to 100 nm, these three com-
pounds do not inhibit any of the PDEs expressed in
A172 cells except for PDE1C. Thus we can be sure to
observe effects of these inhibitors on cAMP concentra-
tions controlled by PDE1C. At higher, nonselective
concentrations, SCH51866 (at 1–10 lm), compound 31
or compound 30 (at 100 nm to 10 lm) caused a greater
increase in cAMP concentrations (in the presence of
ionomycin and forskolin) than that induced by forsko-
lin. This increase must be attributed to the inhibition
of other PDEs in addition to PDE1C at these concen-
trations by these compounds.
As expected on the basis of their low inhibitory
potency against PDE1C, vinpocetine and 8MM-IBMX
exhibited lower cellular potency. Even up to 10 lm,no
effects of these compounds were observed. This is quite
surprising, because there are several publications dem-
onstrating effects of these drugs in this concentration
range. For example, Haddad et al. [12] demonstrated
on alveolar epithelial cells that 8MM-IBMX inhibits
lipopolysaccharide-mediated IL-6 biosynthesis with an
IC
50
of 7.08 lm. Vinpocetine has been shown to
strengthen the contraction of smooth muscle cells and
shorten action potentials at 1 lm [13], and inhibit plate-
let-derived growth factor-induced proliferation of pul-
monary artery smooth muscle cells at 4 lm [14]. Even at
30 nm, vinpocetine was shown to be effective in relaxing
carbachol-constricted gall bladders [16]. When consider-
ing these contradictory data, we should keep in mind
that the nootropic drug vinpocetine exhibits additional
pharmacologic actions, which might have affected the
findings in the publications cited above. For example,
vinpocetine has been shown to modulate different types
of K
+
current [19] and to block the NaV1.8 tetrodo-
toxin-resistant Na
+
channels of rats [20].
Conclusions
Our data demonstrate the suitability of the A172 cell
system for determination of the PDE1C-specific effect
of inhibitors on cAMP levels. They further suggest
caution in the interpretation of data arising from the
experimental use of 8MM-IBMX and vinpocetine,
because of their low potency and selectivity. Thus,
newer compounds, such as SCH51866, compound 31
Control
Forskolin
Forskolin + Ionomycin
8MM-IBMX -8 log M
8MM-IBMX -7 log M
8MM-IBMX -6 log M
8MM-IBMX -5 log M
Vinpocetin -8 log M
Vinpocetin -7 log M
Vinpocetin -6 log M
Vinpocetin -5 log M
0
1
2
3
Forskolin + Ionomycin
cAMP (fold of control)
Control
Forskolin
8MM-IBMX -8 log M
8MM-IBMX -7 log M
8MM-IBMX -6 log M
8MM-IBMX -5 log M
Vinpocetin -8 log M
Vinpocetin -7 log M
Vinpocetin -6 log M
Vinpocetin -5 log M
0
2
4
6
8
10
B
A
Forskolin
cAMP (fold of control)
Fig. 8. The low selective PDE1 inhibitors vinpocetine and 8MM-
IBMX do not reverse the ionomycin effect on the forskolin-induced
increase in intracellular cAMP up to concentrations of 10 l
M. (A)
A172 cells pretreated with ionomycin (6 l
M) and vinpocetine ⁄ 8MM-
IBMX () 8to) 5 log
M final concentration) or untreated were
stimulated for adenylyl cyclase activation with forskolin (10 l
M)or
vehicle (control). cAMP was measured 1 min after forskolin stimula-
tion in the corresponding cellular extracts by cAMP-ELISA. (B) For
comparison, A172 cells pretreated with vinpocetine ⁄ 8MM-IBMX
() 8to) 5 log
M) were stimulated with forskolin (10 lM) only, and
cAMP was measured after 1 min. The mean values (as fold of
control) and standard deviations of three independent experiments
are shown.
Characterization of inhibitors of PDE1C T. R. Dunkern and A. Hatzelmann
4820 FEBS Journal 274 (2007) 4812–4824 ª 2007 The Authors Journal compilation ª 2007 FEBS
and compound 30, might be more useful as PDE1
inhibitors, due to their enhanced potency and selec-
tivity.
Experimental procedures
Materials
The PDE inhibitors vinpocetine and 8MM-IBMX were
purchased from Sigma-Aldrich GmbH (Taufkirchen,
Germany). The PDE1-selective inhibitor SCH51866, com-
pound 31 and compound 30 (Schering-Plough, Kenilworth,
NJ, USA) [23], the selective PDE4 inhibitor piclamilast
(RP73401) [27] and the PDE5 inhibitor sildenafil were pre-
pared at the chemical facilities of ALTANA Pharma AG
(Konstanz, Germany). The selective PDE3 inhibitor mota-
pizone [28] was a generous gift from Sanofi-Aventis
(formerly Rhone-Poulenc Rorer, Ko
¨
ln, Germany).
The polyclonal rabbit antibody to PDE1C is a product of
Fabgennix (Taufkirchen, Germany), and has been reported
to be not cross-reactive with PDE1A, PDE1B or other PDE
family members. The polyclonal rabbit antibody to ERK2
was purchased from Santa Cruz Biotechnology Inc. (Santa
Cruz, CA, USA). Peroxidase-coupled secondary antibodies
used for western blotting are a product of Jackson Immuno-
Research Laboratories Inc. (West Grove, PA, USA).
Cell culture
The human glioblastoma cell line A172 was cultured in
DMEM plus 4500 mgÆL
)1
glucose (Gibco, Invitrogen Life
Technologies, Grand Island, NY, USA), 2 mml-glutamine,
1mm sodium pyruvate and 10% heat-inactivated fetal
bovine serum at 37 °C and 5% CO
2
.
Measurements of PDE isoenzyme activities and
preparation of cellular extracts
Washed cells were sonicated in homogenization buffer
(137 mm NaCl, 2.7 mm KCl, 8.1 mm Na
2
HPO
4
, 1.5 mm
KH
2
PO
4
,10mm Hepes, 1 mm EGTA, 1 mm MgCl
2
,1mm
mercaptoethanol, 5 lm pepstatin A, 10 lm leupeptin,
50 lm phenylmethanesulfonyl fluoride, 10 lm soybean
trypsin inhibitor, 2 mm benzamidine, pH 8.2). The lysates
were used for PDE activity measurements as described by
Thompson & Appleman [29]. The assay mixture contained:
30 mm Tris ⁄ HCl (pH 7.4), 5 m m MgCl
2
, 0.5 lm
cAMP ⁄ cGMP, including [
3
H]cAMP or [
3
H]cGMP, 100 lm
EGTA, PDE isoenzyme-specific activators and inhibitors,
and lysates. Incubations were performed for 30 min at
37 °C, and terminated by adding 0.2 m HCl. Assays were
incubated on ice for 10 min, and then 25 lgof5¢-nucleo-
tidase (Crotalus atrox) was added for 10 min at 37 °C.
Thererafter, mixtures were loaded onto QAE-Sephadex
columns and eluted with 30 mm ammonium formate
(pH 6.0). The radioactivity in the eluate was counted.
Selective inhibitors and activators of PDE isoenzymes were
used to determine activities of PDE families as described
previously [30], with modifications. Briefly, PDE4 was
calculated as the difference in PDE activities at 0.5 lm
cAMP in the presence and absence of 1 lm piclamilast
(RP73401), and PDE3 as the difference between RP73401-
inhibited cAMP hydrolysis in the presence and absence of
10 lm motapizone. The fraction of cGMP (0.5 lm) hydro-
lysis in the presence of 10 lm motapizone that was inhib-
ited by 100 nm sildenafil represented PDE5. The increase
in cAMP (0.5 lm) hydrolysis (in the presence of 1 lm
RP73401 and 10 lm motapizone) induced by 5 lm cGMP
represented PDE2. PDE1 was defined as the increment of
cAMP hydrolysis (in the presence of 1 lm RP73401 and
10 lm motapizone) or cGMP hydrolysis induced by 1 m m
Ca
2+
and 100 nm calmodulin.
The K
m
values of the PDE1 activity were determined by
measuring the specific activity of Ca
2+
⁄ calmodulin-stimu-
lated cAMP or cGMP hydrolysis under different substrate
concentrations and by transferring the data into a linear
Lineweaver–Burk diagram.
PDE assay
⁄
inhibitor testing
Inhibition of PDE activity by the inhibitors was measured
on human PDE enzymes in a modified scintillation proxim-
ity assay (GE Healthcare UK Ltd, Little Chalfont, Buck-
inghamshire, UK). The test volume was 100 lL, and
contained 20 mm Tris buffer (pH 7.4), 0.1 mg BSAÆmL
)1
,
5mm Mg
2+
, 0.5 lm cAMP ⁄ cGMP (including [
3
H]cAMP
and [
3
H]cGMP), 1 lL of the respective substance dilution
in dimethylsulfoxide and sufficient PDE to ensure that
15–20% of the cAMP was converted. The reaction was
started by adding the substrate (cAMP ⁄ cGMP). After incu-
bation for 15 min, assays were stopped by adding scintilla-
tion proximity assay beads (50 lL, containing 3 mm 8MM-
IBMX). After the beads had sedimented, the samples were
analyzed in commercially available measuring appliances,
and the corresponding IC
50
values of the compounds were
determined from the concentration–effect curves.
siRNA tranfection and real-time PCR
For siRNA tranfection with subsequent RNA preparation,
3 · 10
5
A172 cells were seeded into 24-well plates. For trans-
fection with subsequent western blot analysis, 1 · 10
6
cells
were seeded into 10 cm dishes. The day after seeding, cells
were transfected with 10 nm pan-PDE1C siRNA smart pool
(Ambion Inc., Austin, TX, USA) [pool number M-007643–
00, sequences CCAAGGAGATTGAAGAATT (1), GAT
CATGCACTGAAATTTA (2), GATGAAACCTCTCAA
ACTG (3), and CATCATCGCTGGACAATGT (4)], using
T. R. Dunkern and A. Hatzelmann Characterization of inhibitors of PDE1C
FEBS Journal 274 (2007) 4812–4824 ª 2007 The Authors Journal compilation ª 2007 FEBS 4821
1 lgÆmL
)1
argfectin-50 lipid as the tranfection agent (Atu-
gen, Berlin-Buch, Germany). For western blotting experi-
ments, 72 h after transfection, cells were washed with
NaCl ⁄ P
i
, trypsinized, shock-frozen as a cell pellet in liquid
nitrogen, and stored at ) 80 °C. For mRNA analysis, 48 h
after transfection, the cells were lysed with b-mercaptoetha-
nol-supplemented RLT buffer provided with the RNeasy-
Quiagen RNA-preparation kit. Thereafter, RNA isolation,
quantification and cDNA synthesis from 1 lg of RNA was
performed according to the manufacturer’s standard proto-
cols. Successful cDNA synthesis was controlled by gel elec-
trophoresis of an aliquot of the cDNA samples. cDNA was
used for subsequent real-time Taq-Man PCR analysis for
PDE1C (Applied Biosystems, Foster City, CA, USA). The
sense and antisense primer sequences were 5¢-TGTGAGT
CCATTAATCGATGAAACC-3¢ and 5¢-ACCTGATCG
CTTGGCATCTG-3¢, respectively. The probe sequence was
as follows: (FAM)-AGCTGATGCTATTCAAACTCGA
ACGCCTCT-(TAMRA).
Preparation of cell extracts
Frozen cell pellets were resuspended in buffer [20 mm
Tris ⁄ HCl, pH 8.5, 1 mm EDTA, 5% (v ⁄ v) glycerine,
1mm dithiothreitol, 0.5 mm phenylmethanesulfonyl fluo-
ride] and sonicated [Bandelin sonicator, Sonopuls HD2070
plus cup booster BR30 (Berlin, Germany), 3 · 15 s]. The
resulting suspension was centrifuged at 20 000 g for
10 min at 4 °C to pellet cellular debris using a 5417R cen-
trifuge and F45-30-11 rotor (Eppendorf AC, Hamburg,
Germany). Supernatants were collected, and protein con-
centration was determined by the Bradford assay before
western blotting.
Western blot analysis
Proteins (10–30 lg) were separated on a 7.5–12% SDS
polyacrylamide gel and than blotted onto a nitrocellulose
transfer membrane (Protran nitrocellulose transfer mem-
brane; Schleicher & Schuell Bioscience GmbH, Dassel, Ger-
many) for 2–3 h. Membranes were blocked for 2 h in 5%
(w ⁄ v) milk powder in NaCl ⁄ P
i
containing 0.1% Tween-20
(PBT), incubated for 2 h with antibody to PDE1C
(1 : 2000), washed three times in PBT for 10 min, and incu-
bated for 1 h with horseradish peroxidase-coupled second-
ary anti-rabbit serum (1 : 20000). After a final washing
with PBT (three times for 10 min each), the blots were
developed by using a chemiluminescence detection system
(Lumi Light Plus; Roche GmbH, Mannheim, Germany)
and a luminescent image analyzer (Fujifilm LAS1000 Pro,
Tokyo, Japan). To control for equal protein loading, blots
were additionally incubated with a primary antibody to
extracellular signal-related protein kinase 2 (ERK2)
(1 : 3000).
cAMP measurements
A172 cells (1.5 · 10
5
cells in 5 mm Ca
2+
-containing med-
ium) were preincubated for 5 min in tubes in the presence
or absence of the various PDE1 inhibitors. Then, 6 lm
ionomycin (or Ca
2+
-containing medium in controls) was
added, and the samples were incubated for a further
5 min at 37 °C. Then, the adenylyl cyclase activator
forskolin (final concentration 10 lm) was added (or
Ca
2+
-containing medium in controls). At this time, the
final assay volume of 300 lL was reached. One minute
later, the incubations were stopped by adding 15 lLof
3.3 m HCl. After a further 15 min of incubation at room
temperature, the samples were centrifuged for 5 min at
10 000 g to pellet the cell debris using an Eppendorf cen-
trifuge 5417R and rotor F45-30-11. The supernatant was
diluted 1 : 10, and analyzed for cAMP content using a
commercially available ELISA kit (Assay Designs, Ann
Arbor, MI, USA).
Ca
2+
measurements
Measurements were performed with a scanning fluorometer
and an integrated fluid transfer workstation (Flexstation;
Molecular Devices, Sunnyvale, CA, USA) by using an exci-
tation wavelength of 485 nm and an emission wavelength
of 525 nm. The data were collected as relative fluorescence
units every 12 or 20 s.
A172 cells, 3 · 10
5
cells per well, were seeded 24 h
before measurement on 96-well microplates (black, clear
bottom) in 100 lL of culture medium. One hour before
measurements, cells were loaded with the dye fluo 3-mix
(calcium assay kit; Molecular Devices) by adding 50 lL
of the dye per well. Cells were then incubated for 50 min
at 37 °C and 5% CO
2
, and for a subsequent 10 min at
room temperature in the dark. After an initial 60 s of
measurement, different concentrations of ionomycin were
added (in some experiments, additional 5 mm Ca
2+
was
added at time point 20 s), and measurement was contin-
ued for a further 30 min. If desired, at the end of some
experiments the maximal possible Ca
2+
signal was investi-
gated by adding 10 lm ionomycin and 5 mm Ca
2+
.To
reach a subsequent decrease in Ca
2+
therafter at 35 min,
50 mm EGTA was added. All measurements were per-
formed in triplicate.
Cytotoxicity assay (lactate dehydrogenase assay)
A172 cells, 1 · 10
4
, were seeded into 96-well plates and
cultured for 24 h. Ionomycin (6 lm) or different concen-
trations of Triton X-100 (positive controls) were then
added for 15 min. For the generation of a standard curve,
different cell numbers (1 · 10
3
up to 1.3 · 10
4
cells per
well in triplicate) were seeded and treated 24 h later for
Characterization of inhibitors of PDE1C T. R. Dunkern and A. Hatzelmann
4822 FEBS Journal 274 (2007) 4812–4824 ª 2007 The Authors Journal compilation ª 2007 FEBS
1 h with a supracytotoxic concentration of 1% Triton
X-100, known to lyse all cells within this time. After the
various treatments, 50 lL of the cell culture medium
supernatant was transferred to a 96-well plate, followed
by 50 lL of a substrate solution (Promega, Madison, WI,
USA; CytoTox96 assay), and after 15 min of incubation,
an additional 50 lL of a stop solution. Thereafter, extinction
was measured at a wavelength of 490 nm. The numbers of
dead cells induced by ionomycin and the different concen-
trations of Triton X-100 were calculated on the basis of
the standard curve measurement.
Acknowledgements
We wish to acknowledge D. Heinze, D. Kubanek and
N. Spa
¨
th from the Biochemistry Department Inflam-
mation of ALTANA Pharma AG for their excellent
technical assistance.
References
1 Lugnier C (2006) Cyclic nucleotide phosphodiesterase
(PDE) superfamily: a new target for the development of
specific therapeutic agents. Pharmacol Therapeutics 109,
366–398.
2 Polli JW & Kincaid RL (1992) Molecular cloning of
DNA encoding a calmodulin-dependent phosphodiester-
ase enriched in striatum. Proc Natl Acad Sci USA 89,
11079–11083.
3 Yu J, Wolda SL, Frazier AL, Florio VA, Martins TJ &
Snyder PB (1997) Identification and characterisation of
a human calmodulin-stimulated phosphodiesterase
PDE1B1. Cell Signal 9, 519–529.
4 Yan C, Zhao AZ, Bentley JK & Beavo JA (1996)
The calmodulin-dependent phosphodiesterase gene
PDE1C encodes several functionally different splice
variants in a tissue-specific manner. J Biol Chem 271,
25699–25706.
5 Rybalkin SD, Rybalkina I, Beavo JA & Bornfeldt KE
(2002) Cyclic nucleotide phosphodiesterase 1C promotes
human arterial smooth muscle cell proliferation. Circ
Res 90, 151–157.
6 Torsney C, Anderson RL, Ryce-Paul KA & Macder-
mott AB (2006) Characterization of sensory neuron sub-
populations selectively expressing green fluorescent
protein in phosphodiesterase 1C BAC transgenic mice.
Mol Pain 2, 17–24.
7 Kostic MM, Erdogan S, Rena G, Borchert G, Hoch B,
Bartel S, Scotland G, Huston E, Houslay MD & Krause
EG (1997) Altered expression of PDE1 and PDE4 cyclic
nucleotide phosphodiesterase isoforms in 7-oxo-prosta-
cyclin-preconditioned rat heart. J Mol Cell Cardiol 29,
3135–3146.
8 Han P, Werber J, Surana M, Fleischer N & Michaeli T
(1999) The calcium ⁄ calmodulin-dependent phosphodies-
terase PDE1C down-regulates glucose-induced insulin
secretion. J Biol Chem 274, 22337–22344.
9 O’Grady SM, Jiang X, Maniak PJ, Birmachu W, Scrib-
ner LR, Bulbulian B & Gullikson GW (2002) Cyclic
AMP-dependent Cl secretion is regulated by multiple
phosphodiesterase subtypes in human colonic epithelial
cells. J Membr Biol 185, 137–144.
10 Kanda N & Watanabe S (2001) Regulatory roles of
adenylate cyclase and cyclic nucleotide phosphodiester-
ases 1 and 4 in interleukin-13 production by activated
human T cells. Biochem Pharmacol 62, 495–507.
11 Fisch JD, Behr B & Conti M (1998) Enhancement of
motility and acrosome reaction in human spermatozoa:
differential activation by type-specific phosphodiesterase
inhibitors. Hum Reprod 13, 1248–1254.
12 Haddad JJ, Land SC, Tarnow-Mordi WO, Zembala M,
Kowalczyk D & Lauterbach R (2002) Immunopharma-
cological potential of selective phosphodiesterase inhibi-
tion. I. Differential regulation of lipopolysaccharide-
mediated proinflammatory cytokine (interleukin-6 and
tumor necrosis factor-alpha) biosynthesis in alveolar
epithelial cells. J Pharmacol Exp Ther 300, 559–566.
13 Kovalev IV, Popov AG, Baskakov MB, Minochenko
IL, Kilin AA, Borodin YL, Anfinogenova YD, Kapile-
vich LV & Medvedev MA (2002) Effect of inhibitors of
cyclic nucleotide phosphodiesterases on electrical and
contractile activity of smooth muscle cells. Bull Exp Biol
Med 133, 38–40.
14 Phillips PG, Long L, Wilkins MR & Morrell NW
(2005) cAMP phosphodiesterase inhibitors potentiate
effects of prostacyclin analogs in hypoxic pulmonary
vascular remodeling. Am J Physiol Lung Cell Mol Phys-
iol 288, 103–115.
15 Bender AT, Ostenson CL, Wang EH & Beavo JA
(2005) Selective up-regulation of PDE1B2 upon mono-
cyte-to-macrophage differentiation. Proc Natl Acad Sci
USA 102, 497–502.
16 Kaneda T, Watanabe A, Shimizu K, Urakawa N &
Nakajyo S (2005) Effects of various selective phosphodi-
esterase inhibitors on carbachol-induced contraction
and cyclic nucleotide contents in the guinea pig gall
bladder. J Vet Med Sci 67, 659–665.
17 Murray F, Patel HH, Suda RY, Zhang S, Thistlewaite
P, Yuan JX & Insel PA (2006) Expression and activity
of cAMP phosphodiesterase isoforms in pulmonary
artery smooth muscle cells from patients with pulmo-
nary hypertension. Role for PDE1. Am J Physiol Lung
Cell Mol Physiol 292, 294–303.
18 Zelles T, Franklin L, Koncz I, Lendvai B & Zsilla G
(2001) The nootropic drug vinpocetine inhibits veratri-
dine-induced [Ca
2+
]i increase in rat hippocampal CA1
pyramidal cells. Neurochem Res 26, 1095–1100.
19 Solntseva EI, Bukanova JV & Skrebitsky VG (2001)
The nootropic drug vinpocetine modulates different
types of potassium currents in molluscan neurons.
T. R. Dunkern and A. Hatzelmann Characterization of inhibitors of PDE1C
FEBS Journal 274 (2007) 4812–4824 ª 2007 The Authors Journal compilation ª 2007 FEBS 4823
Comp Biochem Physiol C Toxicol Pharmacol 128, 275–
280.
20 Zhou X, Dong XW, Crona J, Maguire M & Priestley T
(2003) Vinpocetine is a potent blocker of rat NaV1.8
tetrodotoxin-resistant sodium channels. J Pharmacol
Exp Ther 306, 498–504.
21 Ukena D, Schudt C & Sybrecht GW (1993) Adeno-
sine receptor-blocking xanthines as inhibitors of
phosphodiesterase isozymes. Biochem Pharmacol 45,
847–851.
22 Schudt C, Dent G & Rabe KF (1996). Phosphodiester-
ase Inhibitors, pp. 21–40. Academic Press, London.
23 Ahn HS, Bercovici A, Boykow G, Bronnenkant A,
Chackalamannil S, Chow J, Cleven R, Cook J, Czar-
niecki M, Domalski C et al. (1997) Potent tetracyclic
guanine inhibitors of PDE1 and PDE5 cyclic guanosine
monophosphate phosphodiesterases with oral antihyper-
tensive activity. J Med Chem 40, 2196–2210.
24 Vemulapalli S, Watkins RW, Chintala M, Davis H,
Ahn HS, Fawzi A, Tulshian D, Chiu P, Chatterjee M,
Lin CC et al. (1996) Antiplatelet and antiproliferative
effects of SCH 51866, a novel type 1 and type 5 phos-
phodiesterase inhibitor. J Cardiovasc Pharmacol 28,
862–869.
25 Loughney K, Martins TJ, Harris EA, Sadhu K, Hicks
JB, Sonnenburg WK, Beavo JA & Ferguson K (1996)
Isolation and characterization of cDNAs corresponding
to two human calcium, calmodulin-regulated, 3¢,5¢-cyclic
nucleotide phosphodiesterases. J Biol Chem 271, 796–
806.
26 Corbin JD & Johnson RA (1998) Initiation and termi-
nation of cyclic nucleotide action. Methods Enzymol
159, 491–500.
27 Raeburn D, Underwood SL, Lewis SA, Woodman VR,
Battram CH, Tomkinson A, Sharma S, Jordan R, Sou-
ness JE & Webber SE et al. (1994) Anti-inflammatory
and bronchodilator properties of RP 73401, a novel and
selective phosphodiesterase type IV inhibitor. Br J
Pharmacol 113, 1423–1431.
28 Borbe HO, Hilboll G & Prop G (1986) Inhibition of
human platelet aggregation by motapizone via an
increase in intracellular cAMP. Agents Actions Suppl 20,
249–257.
29 Thompson WJ & Appleman MM (1979) Assay of cyclic
nucleotide phosphodiesterase and resolution of multiple
molecular forms of the enzyme. Adv Cycl Nucleotide
Res 10 , 69–92.
30 Rabe KF, Tenor H, Dent G, Schudt C, Liebig S &
Magnussen H (1993) Phosphodiesterase isozymes
modulating inherent tone in human airways: identifi-
cation and characterization. Am J Physiol 264, 458–
464.
4824 FEBS Journal 274 (2007) 4812–4824 ª 2007 The Authors Journal compilation ª 2007 FEBS
Characterization of inhibitors of PDE1C T. R. Dunkern and A. Hatzelmann