Báo cáo khoa học: Unraveling multistate unfolding of pig kidney fructose-1,6bisphosphatase using single tryptophan mutants docx
Bạn đang xem bản rút gọn của tài liệu. Xem và tải ngay bản đầy đủ của tài liệu tại đây (489.85 KB, 13 trang )
Unraveling multistate unfolding of pig kidney fructose-1,6-
bisphosphatase using single tryptophan mutants
Heide C. Ludwig, Fabian N. Pardo*, Joel L. Asenjo*, Marco A. Maureira, Alejandro J. Yan
˜
ez and
Juan C. Slebe
Instituto de Bioquı
´
mica, Facultad de Ciencias, Universidad Austral de Chile, Valdivia, Chile
Fructose-1,6-bisphosphatase (EC 3.1.3.11, FBPase) cat-
alyzes a control step in the gluconeogenic pathway, the
hydrolysis of fructose-1,6-bisphosphate [Fru(1,6)P
2
]to
fructose-6-phosphate and inorganic phosphate. Diva-
lent metal ions such as Mg
+2
,Mn
+2
or Zn
+2
are
required for catalytic activity [1,2]. FBPase is inhibited
synergistically by AMP and fructose-2,6-bisphosphate
[Fru(2,6)P
2
]. AMP binds to an allosteric site and its
inhibition is cooperative, whereas Fru(2,6)P
2
is a
competitive inhibitor, that binds to the active site,
according to structural and kinetic evidence [3,4].
The pig kidney FBPase is a homotetramer having
D
2
symmetry with a relative molecular mass of
146 000 [5]. The crystal structures of this enzyme com-
plexed with various ligands have been solved [4,6–8]
(pdb: 1FPB; 1FRP; 1FBF). The four subunits of
FBPase are designated C1, C2, C3 and C4 and are
labeled clockwise. The C1 and C2 subunits correspond
Keywords
fructose-1,6-bisphosphatase; protein
unfolding; single tryptophan mutants;
tetrameric intermediate; phase diagram
Correspondence
J. C. Slebe, Instituto de Bioquı
´
mica,
Universidad Austral de Chile, Campus Isla
Teja, Valdivia, Chile
Fax: +56 63 221406
Tel: +56 63 221797
E-mail:
*These authors contributed equally to this
work
(Received 18 June 2007, revised 14 August
2007, accepted 21 August 2007)
doi:10.1111/j.1742-4658.2007.06059.x
Pig kidney fructose-1,6-bisphosphatase is a homotetrameric enzyme which
does not contain tryptophan. In a previous report the guanidine hydrochlo-
ride-induced unfolding of the enzyme has been described as a multistate
process [Reyes, A. M., Ludwig, H. C., Yan
˜
ez, A. J., Rodriguez, P. H and
Slebe, J. C. (2003) Biochemistry 42, 6956–6964]. To monitor spectroscopi-
cally the unfolding transitions, four mutants were constructed containing a
single tryptophan residue either near the C1–C2 or the C1–C4 intersubunit
interface of the tetramer. The mutants were shown to retain essentially all
of the structural and kinetic properties of the enzyme isolated from pig kid-
ney. The enzymatic activity, intrinsic fluorescence, size-exclusion chromato-
graphic profiles and 1-anilinonaphthalene-8-sulfonate binding by the
mutants were studied under unfolding equilibrium conditions. The unfold-
ing profiles were multisteps, and formation of hydrophobic structures was
detected. The enzymatic activity of wild-type and mutant FBPases as a
function of guanidine hydrochloride concentration showed an initial
enhancement (maximum 30%) followed by a biphasic decay. The activity
and fluorescence results indicate that these transitions involve conforma-
tional changes in the fructose-1,6-bisphosphate and AMP domains. The
representation of intrinsic fluorescence data as a ‘phase diagram’ reveals
the existence of five intermediates, including two catalytically active inter-
mediates that have not been previously described, and provides the first
spectroscopic evidence for the formation of dimers. The intrinsic fluores-
cence unfolding profiles indicate that the dimers are formed by selective
disruption of the C1–C2 interface.
Abbreviations
ANS, 8-anilinonaphthalene-1-sulfonate; FBPase, fructose-1,6-bisphosphatase; Fru(1,6)P
2
, fructose-1,6-bisphosphate; Fru(2,6)P
2
, fructose-2,6-
bisphosphate; GdmCl, guanidinium chloride.
FEBS Journal 274 (2007) 5337–5349 ª 2007 The Authors Journal compilation ª 2007 FEBS 5337
to the upper dimer and the C3 and C4 subunits to the
lower dimer. Each subunit of the enzyme can be
divided into two folding domains: residues 1–200 con-
stitute the AMP domain, and residues 201–337 the
Fru(1,6)P
2
domain. The AMP domain has the AMP
binding site at the C1–C4 interface and the Fru(1,6)P
2
domain contains the active site at the C1–C2 interface.
Two quaternary conformations have been established,
the R- and the T-forms, that differ by a 17° rotation
of the lower dimer C3C4 relative to the upper dimer
C1C2 [9,10] (pdb: 1FBP; 4FBP). AMP induces the
transition from the active R-form to the inactive (or
less active) T-form.
Understanding the folding ⁄ unfolding and self-assem-
bly processes of oligomeric proteins remains a major
problem. Equilibrium denaturation studies of such
proteins provide important information on the rela-
tionship of folding and oligomerization processes and
on the influence of quaternary structure on protein sta-
bility [11,12]. In a previous publication from this labo-
ratory [13] the unfolding of pig kidney FBPase
induced by GdmCl was investigated. In contrast to an
earlier study [14] that suggested that inactivation and
dissociation occur simultaneously, we demonstrated
the existence of an inactive tetrameric intermediate.
Furthermore, it was shown that the equilibrium
unfolding pathway is characterized by the presence of
three intermediate states. In these studies, fluorescent
reporter groups (2-(4 ¢-maleimidylanilino)naphthalene-
6-sulfonic acid and N-(acetylaminoethyl)-5-naphthyl-
amine-1-sulfonic acid) were chemically attached to
Cys128, a reactive thiol group located near to the
active site to monitor conformational changes and
enzyme dissociation. However, the introduction of
these fluorescent groups caused a destabilization of the
active site region. Furthermore, at high protein con-
centration (1 mgÆmL
)1
) the aggregation of dimeric and
monomeric unfolding intermediates masked the transi-
tions occurring at GdmCl concentrations above 1.2 m.
However, no large aggregates have been detected by
light scattering measurements at 50 lgÆmL
)1
[13].
Finally, a main unresolved question is which of the
FBPase interfaces is broken first by the GdmCl treat-
ment.
As FBPase does not contain tryptophan, introduc-
tion of this fluorescent amino acid by site-directed
mutagenesis as nonperturbing probe is an attractive
experimental approach to examine the unfolding of the
enzyme at low protein concentration. The tryptophan
probe, which is very sensitive to a variety of environ-
mental conditions, yields structural and dynamic infor-
mation about its surroundings [15]. In the present
report, FBPase mutants carrying a single replacement
of a Phe at position 16, 89, 219 or 232 by Trp were
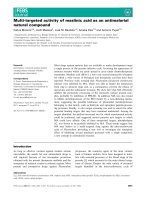
engineered (Fig. 1). Phe16 and Phe89 are residues of
the AMP domain located near the C1–C4 interface,
whereas Phe219 and Phe232 are in the Fru(1,6)P
2
domain and near the C1–C2 interface. The single-Trp
mutants were shown to retain essentially all of the
structural and kinetic properties of the enzyme isolated
from pig kidney. The GdmCl-induced unfolding transi-
tions studied by fluorescence spectroscopy provide evi-
dence for the existence of five unfolding intermediates
and indicate that the loss of quaternary structure
begins by disruption of the C1–C2 interface.
Results
Catalytic and spectroscopic properties of
tryptophan mutants of FBPase
The single tryptophan mutants, Phe16Trp, Phe89Trp,
Phe219Trp and Phe232Trp FBPases exhibited identical
electrophoretic mobility ( 37 kDa) as FBPase isolated
from pig kidney and were at least 96% pure using
SDS ⁄ PAGE as a criterion (data not shown). As seen
in Table 1, the mutations in general do not affect cata-
lytic properties significantly, except the loss of AMP
cooperativity (h value ¼ 1) observed for Phe16Trp
FBPase. The other kinetic parameters only demon-
strate slight differences with respect to the recombinant
wild-type FBPase and are similar to those published
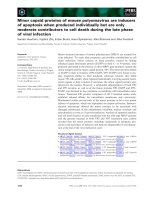
Fig. 1. Schematic of FBPase showing the location of the trypto-
phan residues. Active sites and AMP binding sites are labeled FBP
and AMP, respectively. Dotted ovals represent ligand binding sites
on faces of the tetramer hidden from view. The FBPase tetramer is
in the T-state conformation. The location of the phenylalanine resi-
dues which were mutated is shown.
Selective GdmCl disruption of FBPase C1–C2 interface H. C. Ludwig et al.
5338 FEBS Journal 274 (2007) 5337–5349 ª 2007 The Authors Journal compilation ª 2007 FEBS
elsewhere for nonrecombinant FBPase [16–18]. The
CD spectra of the nonrecombinant, recombinant wild-
type and mutant FBPases were essentially superimpos-
able from 200 to 250 nm (data not shown).
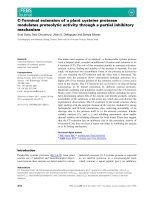
Emission spectra of equimolar amounts of the Trp
mutants, when excited at 295 nm, are shown in Fig. 2.
The emission maxima of the mutants are summarized
in Table 2. Phe16Trp and Phe219Trp FBPases have
emission maxima at 338 and 335 nm, respectively, indi-
cating that these tryptophan residues are located in a
nonpolar environment [15]. In contrast, the emission
maxima of Phe89Trp and Phe232Trp FBPases are at
356 nm and 352 nm, respectively, indicating that these
tryptophan residues are in a polar environment,
exposed to the solvent. Figure 2 also shows that
Phe232Trp FBPase presents the highest fluorescence
quantum yield, whereas the quantum yield of
Phe16Trp FBPase is considerably lower than those of
the other mutants.
The environment of a specific tryptophan residue
can also be evaluated by its accessibility to a collisional
fluorescence quencher, as acrylamide [19,20]. Table 2
presents the results of the Stern–Volmer analysis of the
quenching data of the tryptophan mutants by acrylam-
ide. The values of the Stern–Volmer constants (K
SV
)
indicate that Trp219 is shielded from the solvent
(K
SV
¼ 3.19 m
)1
), Trp16 (K
SV
¼ 5.81 m
)1
) and Trp89
(K
SV
¼ 6.28 m
)1
) are moderately accessible and
Trp232 (K
SV
¼ 11.8 m
)1
) is almost completely solvent
exposed. These results agree with the crystallographic
structure of the enzyme [21].
Examination of protein unfolding by catalytic
activity, size-exclusion high-performance liquid
chromatography and 8-anilinonaphthalene-
1-sulfonate (ANS) binding
Enzyme activity can be regarded as the most sensitive
probe for studying protein unfolding, as it reflects sub-
tle readjustments of the active site and detects very
small conformational variations of an enzyme struc-
ture. Figure 3 shows the changes in enzymatic activity
of the nonrecombinant, recombinant wild-type and the
mutant pig kidney FBPases as a function of GdmCl
Table 1. Kinetic parameters for wild-type and single tryptophan mutants of pig kidney FBPase.
Enzyme
k
cat
K
m
Fru(1,6)P
2
I
50
Fru(2,6)P
2
I
50
AMP
h
AMP
K
a
Mg
+2
s
)1
lM lM lM mM
Nonrecombinant 20.7 ± 1.0 5.9 ± 0.6 0.9 ± 0.2 10.2 ± 0.2 2.2 ± 0.1 0.16 ± 0.01
Wild-type 19.7 ± 0.9 4.8 ± 0.6 1.0 ± 0.2 7.1 ± 0.2 2.1 ± 0.1 0.28 ± 0.01
Phe16Trp 18.1 ± 1.2 5.0 ± 0.9 0.7 ± 0.3 5.7 ± 0.4 1.0 ± 0.1 0.42 ± 0.03
Phe89Trp 19.2 ± 0.8 4.3 ± 0.8 0.7 ± 0.2 3.1 ± 0.2 1.8 ± 0.2 0.87 ± 0.04
Phe219Trp 18.7 ± 1.3 6.0 ± 1.9 1.6 ± 0.3 3.4 ± 0.3 1.5 ± 0.3 0.64 ± 0.04
Phe232Trp 14.2 ± 0.9 4.6 ± 1.2 1.9 ± 0.1 4.6 ± 0.1 2.2 ± 0.2 0.66 ± 0.06
Fig. 2. Fluorescence emission spectra of FBPase mutants. Each
enzyme was 60 lgÆmL
)1
in 20 mM Tris ⁄ HCl buffer, pH 7.5, contain-
ing 0.1 m
M EDTA. The excitation wavelength was 295 nm. The var-
ious traces correspond to the following samples: –
Æ
–, Phe16Trp;
– – –, Phe89Trp; ÆÆÆÆ, Phe 219Trp; –
ÆÆ
–
ÆÆ
, Phe232 Trp; –––, recombi-
nant wild-type FBPase.
Table 2. Fluorescence properties of the single tryptophan mutants
of pig kidney FBPase. The Stern–Volmer quenching constants for
acrylamide (K
SV
) were determined in 20 mM Tris ⁄ HCl buffer,
pH 7.5, containing 0.1 m
M EDTA as described under Experimental
procedures.
Enzyme
k
max
nm
K
SV
M
)1
Phe16Trp 338 5.81 ± 0.16
Phe89Trp 356 6.28 ± 0.20
Phe219Trp 335 3.19 ± 0.18
Phe232Trp 352 11.84 ± 0.54
H. C. Ludwig et al. Selective GdmCl disruption of FBPase C1–C2 interface
FEBS Journal 274 (2007) 5337–5349 ª 2007 The Authors Journal compilation ª 2007 FEBS 5339
concentration at 15 °C. A similar behavior can be
observed for the six enzymes: after an enhancement in
enzymatic activity (maximum 30%) a decrease of the
activity occurs. According to control experiments the
residual GdmCl concentrations (2–20 lm) in the assay
medium do not affect the enzymatic activity. The
maximum activity is observed at 0.2 m (Phe89Trp,
Phe219Trp and Phe232Trp FBPases), 0.3 m (Phe16Trp
and recombinant wild-type FBPases) and 0.4 m
GdmCl (nonrecombinant FBPase). Two phases can be
distinguished in the activity decrease, an initial phase
of slight decay followed by a sharp decrease. In accor-
dance with previous data [13] the midpoint for
GdmCl-based inactivation for the nonrecombinant
enzyme is 0.75 m. The recombinant enzymes are less
resistant to GdmCl inactivation than the nonrecombi-
nant FBPase, as indicated by the lower denaturant
concentration required for half-maximum inactivation:
recombinant wild-type and Phe219Trp FBPases,
0.70 m GdmCl; Phe16Trp and Phe232Trp FBPases,
0.64 m GdmCl and Phe89Trp FBPase, 0.58 m GdmCl.
It has been described that the inactivation of non-
recombinant FBPase takes place without dissociation
of the tetramer, and therefore the enzyme at 0.9 m
GdmCl elutes as a single peak from a size-exclusion
column pre-equilibrated with the same solvent [13].
The elution profiles of the tryptophan mutants of
FBPase at various concentrations of GdmCl were
obtained (data not shown). Between 0 and 0.9 m
GdmCl the enzymes elute as a single peak centered at
7.5 min, indicating that the mutants maintain their tet-
rameric structure. A shoulder at a higher elution time
(aproximately 8.0 min) is observed in the elution pat-
terns at 1.0 and 1.2 m GdmCl, indicating the presence
of dimers (relative molecular mass 70 000), as has
been described for the nonrecombinant enzyme [13].
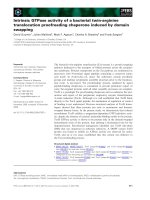
ANS, a hydrophobic fluorophore, can be used as an
external probe for the unfolding of proteins [22]. This
fluorophore has a low emission in aqueous solutions,
but its fluorescence is increased in nonpolar environ-
ments in such a way that the changes in ANS fluores-
cence are related to the increase in accessible
hydrophobic surface upon protein unfolding. As
shown in Fig. 4, there is a sharp rise in ANS fluores-
cence and thus in ANS binding to Phe89Trp FBPase
between 0.4 m and 0.6 m GdmCl. This transition is
coincident with the loss of catalytic activity. Beyond
0.7 m GdmCl the ANS emission shows a gradual
decrease, reflecting the disappearance of the hydropho-
bic patches where ANS binds. In the case of the
Phe16Trp, Phe219Trp and Phe232Trp mutants the
increase in ANS binding takes place approximately
between 0.5 m and 0.9 m GdmCl, and is also coinci-
dent with the loss of catalytic activity. These results
are similar to those described for nonrecombinant pig
kidney FBPase [13].
Monitoring changes of the intrinsic tryptophan
fluorescence
The fluorescence of the indole ring is highly sensitive
to its environment; this makes tryptophan an ideal res-
idue to detect conformational changes of protein mole-
cules [15]. GdmCl-induced denaturation of the
tryptophan mutants was monitored by the change in
fluorescence emission spectra at an excitation wave-
length of 295 nm. The results were plotted by taking
the average emission wavelength [23] and the fluores-
cence intensity at the emission maximum of each
mutant in the native state versus GdmCl concentra-
tion. The average emission wavelength was used
instead of k
max
because it is a more sensitive value as
it reflects changes in the shape of the spectrum as well
as in position. The unfolding curves (Fig. 5) are mostly
biphasic or triphasic and differ greatly in shape. All of
the tryptophan residues detect the transition by which
enzymatic activity is lost. When enzymatic activity and
fluorescence were measured for the same samples of an
unfolding experiment, a perfect coincidence between
catalytic activity loss, change of average emission
GdmCl, M
0.0 0.2 0.4 0.6 0.8 1.0 1.2
Enzymatic activity, %
0
20
40
60
80
100
120
140
Fig. 3. Enzyme activity of wild-type and mutant FBPases, as a func-
tion of GdmCl concentrations. Samples of nonrecombinant FBPase
(d), recombinant wild-type (h), or the mutant enzymes Phe16Trp
(s), Phe89Trp (m ), Phe219Trp (n) or Phe232Trp (j) (50 lgÆmL
)1
)
were incubated at different concentrations of GdmCl. The denatur-
ant effect was then evaluated measuring enzyme activity, as
described in Experimental procedures.
Selective GdmCl disruption of FBPase C1–C2 interface H. C. Ludwig et al.
5340 FEBS Journal 274 (2007) 5337–5349 ª 2007 The Authors Journal compilation ª 2007 FEBS
wavelength and emission intensity was obtained for
Phe16Trp and Phe89Trp FBPases.
The emission intensity of Phe16Trp FBPase
increases at low GdmCl concentrations in a biphasic
way (Fig. 5). The first phase, between 0 and 0.2 m
GdmCl, correlates with the increase in enzymatic activ-
ity (Fig. 3), and the second phase, between 0.55 and
0.8 m GdmCl, correlates with the activity loss. At
denaturant concentrations higher than 0.8 m GdmCl
the emission intensity decreases. The average emission
wavelength is shifted gradually towards higher values,
and a pronounced increase of this parameter is
observed between 2.0 and 2.7 m GdmCl. A probable
cause for this pronounced increase is the disruption of
the C1–C4 interface next to Trp16, which exposes the
tryptophan residue to the solvent.
For Phe89Trp FBPase a large decrease of the aver-
age emission wavelength is observed between 0.4 and
0.7 m GdmCl (Fig. 5) correlated with a decrease in the
fluorescence intensity. Notably, the maximum emission
wavelength (k
max
) value of the emission spectrum at
0.8 m GdmCl is 339 nm, characteristic for a nonpolar
environment. A shift of the average emission wave-
length in the opposite direction between 1.8 and 2.5 m
GdmCl indicates that the tryptophan residue now
moves into a polar environment. In accordance with
the results obtained for Phe16Trp FBPase, this red
shift probably corresponds to the disruption of the
C1–C4 interface next to Trp89.
The unfolding curves of Phe219Trp FBPase, which
contains a tryptophan residue located near the C1–
C2 interface, have certain features differing from
those of the mutants with a tryptophan residue near
the C1–C4 interface. The fluorescence intensity of
Phe219Trp FBPase decreases in a transition that
extends beyond 0.9 m GdmCl (Fig. 5), a concentra-
tion at which the catalytic activity is completely lost.
The intensity decrease and the increase of the average
emission wavelength between 0.9 and 1.4 m GdmCl
probably is caused by the disruption of the C1–C2
interface next to Trp219. Moreover, for Phe219Trp
FBPase only a modest increase in the average emis-
sion wavelength (less than 30% of the total increase)
and no change of the emission intensity is detected
between 1.8 and 2.7 m GdmCl. The effect of GdmCl
on the fluorescence intensity of Phe232Trp FBPase is
similar to that of the Phe219Trp mutant (Fig. 5).
This tryptophan residue, also located near the C1–C2
GdmCl, M
0.0 0.5 1.0 1.5 2.0 2.5 3.0
Enzymatic activity, %
0
20
40
60
80
100
120
140
Relative fluorescence
at 480 nm
6
8
10
12
14
16
18
20
Phe89Trp
GdmCl, M
0.0 0.5 1.0 1.5 2.0 2.5 3.0
Enzymatic activity, %
0
20
40
60
80
100
120
140
Relative fluorescence
at 480 nm
6
8
10
12
14
16
18
Phe232Trp
GdmCl, M
0,0 0,5 1,0 1 ,5 2,0 2,5 3,0
Enzymatic activity, %
0
20
40
60
80
100
120
140
Relative fluorescence
at 480 nm
6
8
10
12
14
16
18
Phe219Trp
GdmHCl, M
0,0 0,5 1,0 1,5 2,0 2,5 3,0
Enzymatic activity, %
0
20
40
60
80
100
120
140
6
8
10
12
14
16
18
Relative fluorescence
at 480 nm
Phe16Trp
Fig. 4. ANS fluorescence and catalytic activity of FBPase mutants at different concentrations of GdmCl. Samples of Phe16Trp, Phe89Trp
Phe219Trp and Phe232Trp FBPases (50 lgÆmL
)1
) were denatured by GdmCl. Catalytic activity (d) and ANS emission (s) were measured as
described in Experimental procedures. The final ANS concentration was 40 l
M.
H. C. Ludwig et al. Selective GdmCl disruption of FBPase C1–C2 interface
FEBS Journal 274 (2007) 5337–5349 ª 2007 The Authors Journal compilation ª 2007 FEBS 5341
interface, is already in a polar environment in the
native state (Table 2), and therefore only minor
changes of the average emission wavelength are
observed.
Acrylamide quenching of Phe89Trp FBPase
intrinsic fluorescence
As the blue shift of the emission spectrum of Phe89Trp
FBPase during denaturation is rather unusual, quench-
ing studies were performed. The Stern–Volmer plots
for acrylamide quenching are shown in Fig. 6 for the
mutant in the native state and after denaturation by
different GdmCl concentrations. The quenching plots
are linear within the concentration range used. Consis-
tent with the changes of the average emission wave-
length (Fig. 5), at 0.7 m and at 1.2 m GdmCl the
tryptophan residue is considerably more shielded
from the solvent (K
SV
¼ 2.90 ± 0.10 m
)1
and K
SV
¼
2.69 ± 0.12 m
)1
, respectively) than in the native
state (K
SV
¼ 6.28 ± 0.20 m
)1
). At 2.4 m GdmCl,
an increase of the Stern–Volmer constant to
Acrylamide,
M
0.0 0.1 0.2 0.3 0.4 0.5 0.6
F
0
/ F
0
1
2
3
4
5
6
7
Fig. 6. Stern-Volmer–plots of acrylamide quenching of Phe89Trp
FBPase denatured by different GdmCl concentrations. Phe89Trp
FBPase in 0.1
M Hepes-NaOH buffer, pH 7.5, containing 0.1 mM
EDTA, 5 mM dithiothreitol and 2 mM MgSO
4
was incubated in the
absence (d) or in the presence of GdmCl 0.7
M (s), 1.2 M (j)or
2.4
M (n). Quenching experiments were conducted as described in
Experimental procedures. The lines were obtained by fitting the
data to the Stern–Volmer equation.
GdmCl, M
01234
Average emission wavelength, nm
344
346
348
350
352
354
356
358
360
Emission intensity at 338 nm
20
40
60
80
100
120
140
160
GdmCl, M
01234
Average emission wavelength, nm
344
346
348
350
352
354
356
358
360
Emission intensity at 335 nm
20
40
60
80
100
120
140
160
GdmCl, M
01
Average emission wavelength, nm
344
346
348
350
352
354
356
358
360
Emission intensity at 350 nm
20
40
60
80
100
120
140
160
Phe16Trp
Phe219Trp Phe232Trp
GdmCl, M
01234
234
Average emission wavelength, nm
344
346
348
350
352
354
356
358
360
Emission intensit
y
at 356 nm
20
40
60
80
100
120
140
160
Phe89Trp
Fig. 5. Unfolding curves of FBPase mutants monitored by tryptophan fluorescence. The fluorescence emission spectra of the mutants dena-
tured by GdmCl were obtained at 15 °C. The intensity-averaged emission wavelength (d) and the fluorescence intensity measured at the
k
max
of emission of each mutant in the native form (s) are plotted as a function of GdmCl concentration. The excitation wavelength was
295 nm and the protein concentrations were: 60 lgÆmL
)1
for Phe16Trp and Phe89Trp FBPases and 30 lgÆmL
)1
for Phe219Trp and
Phe232Trp FBPases.
Selective GdmCl disruption of FBPase C1–C2 interface H. C. Ludwig et al.
5342 FEBS Journal 274 (2007) 5337–5349 ª 2007 The Authors Journal compilation ª 2007 FEBS
8.72 ± 0.22 m
)1
indicates an increased accessibility to
the solvent.
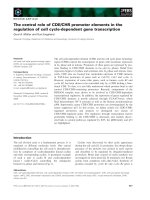
Phase diagram analysis of tryptophan
fluorescence data
The method of ‘phase diagrams’ has been elaborated
by Burstein [24] for the analysis of fluorescence data.
It has been shown that this method is extremely sensi-
tive for the detection of unfolding ⁄ refolding intermedi-
ates of proteins [24–26]. Figure 7 shows the phase
diagrams representing the unfolding of Phe16Trp
FBPase, Phe89Trp FBPase, Phe219Trp FBPase and
Phe232Trp FBPase. Four independent experiments
performed with each mutant gave similar results. The
phase diagram plotted for the Phe16Trp mutant con-
sists of six linear parts, corresponding to 0–0.3, 0.3–
0.5, 0.5–0.8, 0.8–1.4, 1.4–2.3 and 2.3–2.7 m GdmCl.
This suggests the existence of six independent transi-
tions during unfolding. The intermediate that accumu-
lates at 0.8 m GdmCl is the catalytically inactive
tetramer, whereas the first intermediate must be a tet-
rameric species of enhanced catalytic activity, as can
be deduced from Fig. 3. The second intermediate that
accumulates at 0.5 m GdmCl is an enzyme having
approximately the same activity as the native FBPase.
The intermediates formed at 1.4 m GdmCl and at
2.3 m GdmCl should be dimeric and monomeric
species, respectively. Interestingly, the phase diagram
plotted for Phe89Trp FBPase detects only one interme-
diate at 0.7 m GdmCl, corresponding to the inactive
tetramer. Concerning these results it must be pointed
out that the linearity of the parametric relationship
found in a phase diagram does not necessarily indicate
that the transition is of a one-step character [27].
This is highlighted by the results obtained for the
Fig. 7. Phase diagrams representing the unfolding of FBPase mutants induced by an increase in GdmCl concentrations. The data correspond
to two independent sets of experiments performed with each mutant. Denaturant concentration values are indicated in the vicinity of the
corresponding symbol. The fluorescence intensities of the native enzymes were taken as unity. The excitation wavelength was 295 nm.
H. C. Ludwig et al. Selective GdmCl disruption of FBPase C1–C2 interface
FEBS Journal 274 (2007) 5337–5349 ª 2007 The Authors Journal compilation ª 2007 FEBS 5343
Phe219Trp and the Phe232Trp mutants. The phase
diagrams plotted for these enzymes do not detect
unfolding intermediates.
Reactivation of FBPase upon dilution of GdmCl
When samples of the unfolded FBPase mutants in
3.5 m GdmCl were diluted to a concentration of 0.1 m
GdmCl the recoveries of enzymatic activity were as
follows: Phe16Trp FBPase, 60.9%; Phe89Trp FBPase,
57.2%; Phe219Trp FBPase, 59.8%; and Phe232Trp
FBPase, 63.6%. These results indicate that the unfold-
ing process is not completely reversible. The reduced
reversibility is similar to that observed for nonrecombi-
nant FBPase (65.8%), a value that is comparable to
previous data [13]. The reduced reversibility can be
attributed to an aggregation of intermediates. For this
reason the unfolding data shown in Fig. 5 are only
qualitatively discussed. No quantitative analysis of the
unfolding thermodynamics was attempted.
Discussion
The guanidine-induced unfolding of pig kidney FBPase
has been previously studied in this laboratory using
enzyme activity, intrinsic (tyrosine) protein fluores-
cence, fluorescence of extrinsic probes and size-exclu-
sion chromatography [13]. It has been shown that the
unfolding is a multistate process, involving as interme-
diates a catalytically inactive tetramer, compact dimers
and monomers. As the dimeric and monomeric inter-
mediates tend to associate at the relatively high protein
concentrations (1 mgÆmL
)1
) used for size-exclusion
chromatography, the coexistence of aggregates with
intermediates complicates the analysis. The introduc-
tion of tryptophan residues in different parts of the
protein (present work) provided us with the possibility
to further characterize the unfolding process at low
protein concentrations, detecting specific transitions.
Phenylalanine and tryptophan are both neutral non-
polar aromatic amino acids, and usually substitution
of Phe for Trp does not cause large changes in the
whole protein structure. As expected, the mutants pre-
sented almost the same catalytic and regulatory prop-
erties as wild-type FBPase and the CD spectra are
about the same. Clearly, the structural integrity of the
enzyme was not affected. The selective loss of AMP
cooperativity without loss of AMP sensitivity observed
for Phe16Trp FBPase is an effect that has been
described previously for the enzyme as a result of
chemical modification [28] or replacement by site-direc-
ted mutagenesis [16] of Lys50. The AMP cooperativity
is based on a specific signal transmission between
FBPase subunits that is lost without loss of the quater-
nary structure and without loss of the cooperativity
for the cofactor Mg
+2
, therefore it is reasonable to
assume that the unfolding mechanism for Phe16Trp is
the same as for wild-type FBPase.
The Phe16Trp mutant has a considerably lower
quantum yield than the other tryptophan mutants. The
local environment in protein structure can result in
either very large or very small quantum yields of Trp
residues [15]. Examination of the three-dimensional
structure of FBPase [21] reveals that the side chain of
Phe16 is at distances of less than 4 A
˚
from the side
chains of Gln20, Asn182 and Arg198, residues that
have been described as tryptophan quenchers [29,30].
The quenching is partially relieved upon the first steps
of unfolding, probably because conformational
changes at the tetramer level decrease the efficiency of
the quenching. Interestingly, the biphasic increase of
fluorescence intensity correlates with the initial increase
and the subsequent loss of enzymatic activity.
The fluorescence equilibrium unfolding curves of the
four single tryptophan mutants are very different
(Fig. 5). In general, changes in intrinsic tryptophan flu-
orescence intensity upon protein unfolding are com-
pletely unpredictable [31]. The only change that can be
predicted with confidence is that the spectrum will shift
to red upon greater exposure to solvent. Accordingly,
we have interpreted the pronounced blue shift
observed for the emission of Phe89Trp FBPase
between 0.4 and 0.7 m GdmCl as the occurrence of a
conformational change that causes a displacement of
Trp89 into an apolar environment. This kind of dis-
placement is congruent with the reduced degree of
exposition detected by acrylamide quenching experi-
ments. Concomitantly, hydrophobic patches appear on
the surface of the protein, as indicated by the increase
in ANS-binding fluorescence and the catalytic activity
disappears. It is important to note that the four
mutants remain in the tetrameric state and do not
aggregate at low concentrations of GdmCl (lower than
0.9 m) as revealed by the size-exclusion experiments.
Furthermore, the linearity of the Stern–Volmer plots
obtained for Phe89Trp FBPase by acrylamide quench-
ing at 0.7 and 1.2 m GdmCl also support the idea that
this mutant does not aggregate, as an aggregation
should cause heterogeneity and a downward curvature
of the plots.
We have interpreted the red shift near 2 m GdmCl
of the emission of Phe16Trp and Phe89Trp FBPases as
a disruption of the C1–C4 interface. A similar situa-
tion has been described for the Trp99Phe single trypto-
phan mutant of the dimeric Trp aporepressor [23],
where the emission of Trp19, a residue that is buried
Selective GdmCl disruption of FBPase C1–C2 interface H. C. Ludwig et al.
5344 FEBS Journal 274 (2007) 5337–5349 ª 2007 The Authors Journal compilation ª 2007 FEBS
at the dimer interface, is highly red shifted upon dis-
ruption of the interface. On the other hand, the disso-
ciation of the catalytically inactive tetrameric FBPase
(wild-type and mutants) into dimers begins at a
GdmCl concentration around 1 m. Clearly this process
does not affect the average emission wavelength of
Trp89, which remains constant at between 0.7 and
1.8 m GdmCl, and affects only slightly the average
emission wavelength of Trp16. It can be concluded
that the interface which is disrupted first during
unfolding of FBPase is the C1–C2 interface. The
results obtained with Phe219Trp FBPase are in line
with this notion.
The conclusion that the C1–C2 interface is disrupted
before the C1–C4 interface might at first appear to be
at odds with the following facts: (a) In FBPase the
polypeptide chains of C1 and C2 (or C3 and C4) make
up an essential unit for catalytic activity, as they mutu-
ally exchange their Arg243 residues at the active sites.
Furthermore, both chains are extensively associated
through both hydrophilic and hydrophobic interac-
tions [32]; (b) In the absence of AMP, the dimers
C1C2 and C3C4 associate primarily through interac-
tions between the side-chains of residues in two a-heli-
ces (H1 and H3) of the AMP domains. When AMP
binds to the allosteric site it elicits a 17° rotation
between the dimers C1C2 and C3C4, whereas the
C1–C2 interface is essentially locked at its existing con-
formation in the R state [33]. Nevertheless, the dissocia-
tion of the tetramers is preceded by the loss of
catalytic activity, and the structural changes that occur
at the active site region probably destroy some interac-
tions across the C1–C2 interface. Moreover, our results
indicate that the transition by which the catalytic activ-
ity is lost not only involves conformational changes in
the Fru(1,6)P
2
domain, but also at the AMP domain,
as it is detected by each of the four tryptophan resi-
dues of the mutants. Therefore it is possible that this
global change causes the formation of new interactions
which stabilize the C1–C4 interface. Interestingly, Nel-
son et al. [34] have described a spontaneous subunit
exchange between distinct homotetramers of FBPase
to form hybrid tetramers at 4 °C that obviously
requires the disruption of both interfaces.
The phase diagram plotted for Phe16Trp FBPase
suggests the existence of five intermediates. Although
the difference in the parametric relationship between
0.3 m and 0.5 m GdmCl is moderate, it can not be
ignored, as the same change was observed consistently
in four independent experiments. Then, according to
the phase diagram the first intermediate on unfolding
of Phe16Trp FBPase occurs at 0.3 m GdmCl. The exis-
tence of this intermediate is also supported by the
enhancement of catalytic activity observed at low
GdmCl concentrations for wild-type as well as for the
mutant enzymes. For the wild-type FBPase the activity
enhancement has been interpreted as a local effect,
caused by an increased conformational flexibility at the
active site [13]. Nevertheless, our present results indi-
cate that the effect is not only local, as Trp16 is 30 A
˚
away from the active site. Unfolding intermediates at a
low GdmCl concentration (around 0.1 m) have already
been described for carbonic anhydrase [35] and for
rabbit muscle creatine kinase [25]. The phase diagram
for F16W FBPase also reveals the existence of a sec-
ond active intermediate at 0.5 m GdmCl. The existence
of this intermediate explains the biphasic character of
the inactivation of the enzymes. Furthermore, this dia-
gram provides the first evidence for the accumulation
of an intermediate at 1.4 m GdmCl that corresponds
to the dimer.
According to the phase diagram, the Phe89Trp
FBPase appears to unfold in a three-state manner
(Fig. 7), in which the intermediate is the inactive tetra-
mer. However, the existence of linearity of the para-
metric relationship in a phase diagram does not
necessarily indicate that the transition is of a one-step
character [27]. Although the transition between confor-
mational states proceeds via an intermediate, the para-
metric relationship can be practically linear in the
following cases: (a) if the values of the measured charac-
teristics of the intermediate state are close to those of
the initial or final states; and (b) if the values of the
measured characteristics of the intermediate state are
somewhat between those of the initial and final states.
This is highlighted by the phase diagrams obtained for
the Phe219Trp and Phe232Trp FBPases. The multiple
probes of the unfolding of these mutants (activity, ANS
binding, tryptophan fluorescence and size-exclusion
chromatography) indicate the not-one-step character of
the process. Nevertheless, the phase diagrams of these
mutants clearly do not detect any intermediate.
In conclusion, our data are consistent with the fol-
lowing scheme of GdmCl-induced unfolding of
FBPase:
where T
N
,T
A1
,T
A2
and T
I
are the native enzyme, the
tetrameric intermediate of increased catalytic activity,
the second active tetrameric intermediate and the inac-
tive tetrameric intermediate, respectively; D are the
dimers (C1C4 and C2C3); M and U are a monomeric
intermediate and the unfolded monomer, respectively;
and A corresponds to aggregates. The existence of M
H. C. Ludwig et al. Selective GdmCl disruption of FBPase C1–C2 interface
FEBS Journal 274 (2007) 5337–5349 ª 2007 The Authors Journal compilation ª 2007 FEBS 5345
is supported by the phase diagram of the Phe16Trp
mutant and by our previous report [13], in which the
fluorescence anisotropy of an N-(acetylaminoethyl)-5-
naphthylamine-1-sulfonic acid-labeled FBPase and the
average emission wavelength of a 2-(4¢-maleimidylanili-
no)naphthalene-6-sulfonic acid-labeled FBPase were
measured. On the other hand, the inclusion of aggre-
gates in the scheme is based on previous results [13].
These aggregates are formed at high protein concentra-
tions. A similar behavior has been described for rabbit
muscle creatine kinase [25]. Size-exclusion chromato-
graphy studies of this enzyme show the formation of
large aggregates at a high (2 mgÆmL
)1
) but not at a
low (0.1 mgÆmL
)1
) protein concentration.
Interestingly, although the unfolding behavior of
FBPase has been studied [13,14,36], the formation of
the active tetrameric intermediates T
A1
and T
A2
and
the notion that the loss of quaternary structure begins
by disruption of the C1–C2 interface are described
here for the first time.
Experimental procedures
Materials
Fructose-1,6-bisphosphatase was purified from pig kidney
(nonrecombinant enzyme) as described previously [37].
ANS was obtained from Molecular Probes (Eugene, OR).
Auxiliary enzymes were purchased from Sigma (St. Louis,
MO) and GdmCl from Merck (Darmstadt, Germany). All
other reagents were of analytical grade.
Preparation, expression and purification of
FBPase mutants
Replacement of phenylalanine residues with tryptophan
was carried out using the Altered sites II in Vitro Muta-
genesis System kit, following the manufacturer’s (Pro-
mega, Madison, WI) instructions, as previously described
[16]. The following mutagenic oligonucleotides were used
(the bases changed appear in bold): 5¢-GCTCACCCTAA
CCGCTGGGTCATGGAGGAGGGCAG-3¢ (Phe16Trp);
5¢-GTTAAAGTCATCTTGGGCCACCTGCGTTCTC-3¢
(Phe89Trp); 5¢-GGCTATGCCAGGGAGTGGGACCCTG
CCATCACTGAG-3¢ (Phe219Trp); 5¢-CAGAGGAAGAA
GTGGCCCCCAGA-3¢ (Phe232Trp).
The mutations were confirmed by unique restriction
enzyme digestion and by sequence analysis of the mutagenic
FBPase plasmids as described earlier [16]. Protein expres-
sion and purification were performed as described [16]. For
expression, the fragments encoding the wild-type or muta-
genic FBPases were excised from the corresponding plasmid
and cloned into the vector pET15b (Novagen, San Diego,
CA). The purified His-FBPases were subjected to
proteolysis with thrombin in order to remove the His-tag.
The protein concentration of the samples was measured
using the Bio-Rad Protein assay kit with FBPase isolated
from pig kidney as standard, or determined by absorbance
at 280 nm using a e
1mg⁄ mL
value of 0.755 [37] for the
enzyme isolated from pig kidney and 0.904 for the single-
tryptophan mutants (determined by comparison with the
enzyme isolated from pig kidney).
Spectrophotometric assay of fructose-1,6-
bisphosphatase activity
The enzyme activity was determined spectrophotometrically
at 30 °C by following the rate of NADH formation at
340 nm in the presence of an excess of both glucose-6-phos-
phate dehydrogenase and phosphoglucose isomerase [16,38].
Unless stated otherwise, the reaction system (0.5 mL) con-
tained 50 mm Tris ⁄ HCl buffer, pH 7.5, 0.1 mm EDTA,
5mm MgSO
4
,30lm Fru(1,6)P
2
, 0.3 mm NAD
+
and
1.2 enzyme units of each auxiliary enzyme. Digital absor-
bance values were collected using a Hewlett Packard 8453
spectrophotometer (Hewlett Packard, Palo Alto, CA) and
the linear data, from beyond the coupling lag period, were fit
to a straight line on a coupled computer using the UV-visible
CHEM STATION program. One unit of activity is defined
as the amount of enzyme that catalyzes the formation of
1 lmol of fructose-6-phosphate per min at 30 °C under the
conditions described [16]. Because the nonrecombinant and
mutant FBPases exhibit partial substrate inhibition at high
substrate concentrations, substrate saturation curves for all
enzymes were fit by nonlinear regression to a modified form
of the Michaelis–Menten equation which incorporated a
term for substrate inhibition [16,39]. The K
a
value and the
Hill coefficient (h) for Mg
+2
were determined by saturation
curves fitting the data to the Hill equation. AMP and
Fru(2,6)P
2
inhibition curves were fit to the Taketa and Pogell
equation [40]. To prevent FBPase reactivation during the
enzyme assay used for the examination of protein unfolding,
trypsin (20 lg proteinÆ mL
)1
) was added to the assay mixture
[13].
Equilibrium unfolding
Equilibrium unfolding of FBPases was performed in 0.1 m
Hepes-NaOH buffer, pH 7.5, containing 0.1 mm EDTA,
5mm dithiothreitol, 2 mm MgSO
4
and GdmCl at the desired
concentration. The solutions were incubated for 4 h at 15 °C
before analysis. The concentration of the GdmCl stock solu-
tion was determined by refractometry according to Pace [41].
Reactivation studies
The enzymes (900 lgÆmL
)1
) were incubated in 3.5 m
GdmCl in 0.1 m Hepes ⁄ NaOH buffer (pH 7.5) containing
Selective GdmCl disruption of FBPase C1–C2 interface H. C. Ludwig et al.
5346 FEBS Journal 274 (2007) 5337–5349 ª 2007 The Authors Journal compilation ª 2007 FEBS
0.1 m EDTA, 5 mm dithiothreitol and 2 mm MgSO
4
for
4 h at 15 ° C. The denatured enzymes were diluted in the
same buffer without denaturant to attain a final concentra-
tion of 0.1 m GdmCl and a protein concentration of
25 lgÆmL
)1
. The recovery of catalytic activity was mea-
sured after further incubation at 15 °C for enough time to
ascertain that it attained a final stable value.
Size-exclusion HPLC
HPLC was run on a Hewlett Packard HP 1100 chromato-
graph equipped with a Protein–Pack 300 SW 10 lm column
(0.78 · 30 cm; Waters). The experiments were performed
essentially as described by Reyes et al. [13]. FBPase samples
(1 mgÆmL
)1
) at different GdmCl concentrations in 50 mm
Hepes-NaOH, pH 7.5, at 15 °C, containing 0.1 mm EDTA,
5mm dithiothreitol, 2 mm MgSO
4
, and 100 mm Na
2
SO
4
,
were prepared 4 h before injection onto the column pre-
equilibrated at 15 °C with the same concentration of
GdmCl in the same buffer.
Intrinsic fluorescence and ANS-binding experi-
ments
Fluorescence spectra were taken at 15 °C on a Perkin-
Elmer LS-50 spectrofluorometer (Perkin-Elmer, Norwalk,
CT) using excitation and emission slits of 6 nm. The fluo-
rescence was corrected by subtraction of the solvent signal.
For intrinsic tryptophan fluorescence an excitation wave-
length of 295 nm was used and emission spectra were col-
lected from 310 to 400 nm. The intensity-averaged emission
wavelength, [23] was calculated using Eqn (1):
hki¼
P
kIðkÞ
P
IðkÞ
ð1Þ
where I(k) is the fluorescence intensity at wavelength k.
ANS binding was studied as described previously [13].
Briefly, ANS (50 lm) was added to the protein samples
after reaching the GdmCl unfolding equilibrium and the
emission was measured at 480 nm, using an excitation
wavelength of 400 nm.
Fluorescence quenching experiments
The experiments were performed at 15 ° C on a Perkin-
Elmer LS-50 spectrofluorometer. Small aliquots of a stock
acrylamide solution were added to solutions of the enzyme
in 20 mm Tris ⁄ HCl buffer, pH 7.5, containing 0.1 mm
EDTA or alternatively in 0.1 mm Hepes-NaOH buffer,
pH 7.5, containing 0.1 mm EDTA, 5 mm dithiothreitol,
2mm MgSO
4
and GdmCl at different concentrations. The
intensity of tryptophan fluorescence emission upon excita-
tion at 295 nm was detected between 310 and 400 nm as a
function of acrylamide concentration. The emission of
blank solutions was subtracted. The fluorescence at k
max
was corrected for dilution and for the inner filter effect due
to the absorbance of acrylamide at 295 nm (A
295
¼
0.25 m
)1
Æcm
)1
) [19]. The data were analyzed using the
Stern–Volmer equation, F
0
⁄ F ¼ 1+K
SV
[Q], where F
0
and F are the fluorescence intensities in the absence and the
presence, respectively, of the quencher, Q, and K
SV
is the
Stern–Volmer constant.
Circular dichroism
CD spectra of wild-type and mutant FBPases in Tris ⁄ HCl
buffer, pH 7.5, containing 0.1 mm EDTA were recorded at
room temperature on a Jasco 600 spectrometer (Jasco, Eas-
ton, MD) using the 720 software and a cuvette of 0.1 cm
path length. Five scans of each spectrum were collected
from 250 to 200 nm in increments of 1 nm and averaged.
Each averaged spectrum was blank-corrected and smoothed
by using the software package provided with the instrument.
‘Phase diagram’ method
The ‘phase diagram’ method is a sensitive approach for the
detection of unfolding ⁄ refolding intermediates of proteins
[25,27,35]. The essence of this method is to build up the
diagram of I(k
1
) versus I(k
2
), where I(k
1
) and I(k
2
) are
the fluorescence intensity values measured on wavelengths
k
1
and k
2
under different experimental conditions for a pro-
tein undergoing structural transformations.
Acknowledgements
We thank Dr Octavio Monasterio from the Facultad
de Ciencias, Universidad de Chile, Santiago, for giving
us the chance to use the CD-spectrometer. This work
was supported by grants from FONDECYT 1051122
and from the Direccio
´
n de Investigacio
´
n, Universidad
Austral de Chile, S-200574.
References
1 Pilkis SJ & Claus TH (1991) Hepatic gluconeogene-
sis ⁄ glycolysis: regulation and structure ⁄ function rela-
tionships of substrate cycle enzymes. Annu Rev Nutr 11,
465–515.
2 Benkovic SJ & deMaine MM (1982) Mechanism of
action of fructose 1,6-bisphosphatase, Adv Enzymol
Relat Areas Mol Biol 53, 45–82.
3 Pilkis SJ, el-Maghrabi MR & Claus TH (1988) Hor-
monal regulation of hepatic gluconeogenesis and glyco-
lysis, Annu Rev Biochem 57, 755–783.
4 Liang JY, Huang S, Zhang Y, Ke H & Lipscomb WN
(1992) Crystal structure of the neutral form of fructose
1,6-bisphosphatase complexed with regulatory inhibitor
H. C. Ludwig et al. Selective GdmCl disruption of FBPase C1–C2 interface
FEBS Journal 274 (2007) 5337–5349 ª 2007 The Authors Journal compilation ª 2007 FEBS 5347
fructose 2,6-bisphosphate at 2.6-A resolution, Proc Natl
Acad Sci USA 89, 2404–2408.
5 Marcus F, Edelstein I, Reardon I & Heinrikson RL
(1982) Complete amino acid sequence of pig kidney
fructose-1,6-bisphosphatase, Proc Natl Acad Sci USA
79, 7161–7165.
6 Xue Y, Huang S, Liang JY, Zhang Y & Lipscomb
WN (1994) Crystal structure of fructose-1,6-bisphos-
phatase complexed with fructose 2,6-bisphosphate,
AMP, and Zn2+ at 2.0-A resolution: aspects of syner-
gism between inhibitors, Proc Natl Acad Sci USA 91,
12482–12486.
7 Liang JY, Zhang Y, Huang S & Lipscomb WN (1993)
Allosteric transition of fructose-1,6-bisphosphatase, Proc
Natl Acad Sci USA 90, 2132–2136.
8 Zhang Y, Liang JY, Huang S, Ke H & Lipscomb WN
(1993) Crystallographic studies of the catalytic mecha-
nism of the neutral form of fructose-1,6-bisphosphatase.
Biochemistry 32, 1844–1857.
9 Ke HM, Zhang YP & Lipscomb WN (1990) Crystal
structure of fructose-1,6-bisphosphatase complexed with
fructose 6-phosphate, AMP, and magnesium, Proc Natl
Acad Sci USA 87, 5243–5247.
10 Ke HM, Liang JY, Zhang YP & Lipscomb WN (1991)
Conformational transition of fructose-1,6-bisphospha-
tase: structure comparison between the AMP complex
(T form) and the fructose 6-phosphate complex (R
form). Biochemistry 30, 4412–4420.
11 Jaenicke R (1987) Folding and association of proteins,
Prog Biophys Mol Biol 49, 117–237.
12 Jaenicke R & Lilie H (2000) Folding and association of
oligomeric and multimeric proteins, Adv Protein Chem
53, 329–401.
13 Reyes AM, Ludwig HC, Yanez AJ, Rodriguez PH &
Slebe JC (2003) Nativelike intermediate on the unfold-
ing pathway of pig kidney fructose-1,6-bisphosphatase.
Biochemistry 42, 6956–6964.
14 Yuan C, Xie ZQ, Zhang FW & Xu GJ (2001) Associa-
tion and activation of fructose 1,6-bisphosphase during
unfolding and refolding: spectroscopic and enzymatic
studies, J Protein Chem 20, 39–47.
15 Lakowicz JR (1999) Principles of Fluorescence Spectros-
copy, 2nd edn. Kluver Academic ⁄ Plenum Publishers,
New York.
16 Ca
´
rcamo JG, Yanez AJ, Ludwig HC, Leon O,
Pinto RO, Reyes AM & Slebe JC (2000) The C1–C2
interface residue lysine 50 of pig kidney fructose-
1,6-bisphosphatase has a crucial role in the cooperative
signal transmission of the AMP inhibition, Eur J
Biochem 267, 2242–2251.
17 Kelley-Loughnane N & Kantrowitz ER (2001) AMP
inhibition of pig kidney fructose-1,6-bisphosphatase,
Biochim Biophys Acta 1548, 66–71.
18 Nelson SW, Honzatko RB & Fromm HJ (2002) Hybrid
tetramers of porcine liver fructose-1,6-bisphosphatase
reveal multiple pathways of allosteric inhibition, J Biol
Chem 277, 15539–15545.
19 Eftink MR & Ghiron CA (1976) Exposure of trypto-
phanyl residues in proteins. Quantitative determination
by fluorescence quenching studies. Biochemistry 15, 672–
680.
20 Eftink MR & Ghiron CA (1981) Fluorescence quench-
ing studies with proteins. Anal Biochem 114, 199–227.
21 Choe JY, Fromm HJ & Honzatko RB (2000) Crystal
structures of fructose 1,6-bisphosphatase: mechanism of
catalysis and allosteric inhibition revealed in product
complexes. Biochemistry 39, 8565–8574.
22 Ptitsyn OB, Pain RH, Semisotnov GV, Zerovnik E &
Razgulyaev OI (1990) Evidence for a molten globule
state as a general intermediate in protein folding. FEBS
Lett 262, 20–24.
23 Royer CA, Mann CJ & Matthews CR (1993) Resolu-
tion of the fluorescence equilibrium unfolding profile of
trp aporepressor using single tryptophan mutants. Pro-
tein Sci 2, 1844–1852.
24 Burstein EA (1976) Intrinsic Protein Fluorescence: Origin
and Applications, Series Biophysics edn, Viniiti, Mos-
cow.
25 Kuznetsova IM, Stepanenko OV, Turoverov KK, Zhu
L, Zhou JM, Fink AL & Uversky VN (2002) Unravel-
ing multistate unfolding of rabbit muscle creatine
kinase, Biochim Biophys Acta 1596, 138–155.
26 Liang YF, Sanglier S, Zhou BR, Xia Y, Van Dorsselaer
A, Maechling C, Kilhoffer MC & Haiech J (2003)
Unfolding of rabbit muscle creatine kinase induced by
acid. A study using electrospray ionization mass spec-
trometry, isothermal titration calorimetry, and fluores-
cence spectroscopy, J Biol Chem 278, 30098–30105.
27 Kuznetsova IM, Stepanenko OV, Povarova OI, Bikta-
shev AG, Verkhusha VV, Shavlovsky MM & Turoverov
KK (2002) The place of inactivated actin and its kinetic
predecessor in actin folding-unfolding. Biochemistry 41 ,
13127–13132.
28 Ludwig HC, Herrera R, Reyes AM, Hubert E & Slebe
JC (1999) Suppression of kinetic AMP cooperativity of
fructose-1,6-bisphosphatase by carbamoylation of lysine
50, J Protein Chem 18, 533–545.
29 Chen Y & Barkley MD (1998) Toward understanding
tryptophan fluorescence in proteins. Biochemistry 37,
9976–9982.
30 Clark PL, Liu ZP, Zhang J & Gierasch LM (1996)
Intrinsic tryptophans of CRABPI as probes of structure
and folding. Protein Sci 5, 1108–1117.
31 Kronman MJ & Holmes LG (1971) The fluorescence of
native, denatured and reduced-denatured proteins. Pho-
tochem Photobiol 14, 113–134.
32 Ke HM, Thorpe CM, Seaton B, Lipscomb WN & Mar-
cus F (1990) Structure refinement of fructose-1,6-bis-
phosphatase and its fructose 2,6-bisphosphate complex
at 2.8 A resolution, J Mol Biol 212, 513–539.
Selective GdmCl disruption of FBPase C1–C2 interface H. C. Ludwig et al.
5348 FEBS Journal 274 (2007) 5337–5349 ª 2007 The Authors Journal compilation ª 2007 FEBS
33 Zhang Y, Liang JY, Huang S & Lipscomb WN (1994)
Toward a mechanism for the allosteric transition of pig
kidney fructose-1,6-bisphosphatase, J Mol Biol 244,
609–624.
34 Nelson SW, Honzatko RB & Fromm HJ (2001) Sponta-
neous subunit exchange in porcine liver fructose-1,6-bis-
phosphatase. FEBS Lett 492, 254–258.
35 Bushmarina NA, Kuznetsova IM, Biktashev AG, Turo-
verov KK & Uversky VN (2001) Partially folded con-
formations in the folding pathway of bovine carbonic
anhydrase II: a fluorescence spectroscopic analysis.
Chembiochem 2, 813–821.
36 Jiang RF & Tsou CL (1994) Inactivation precedes
changes in allosteric properties and conformation of
d-glyceraldehyde-3-phosphate dehydrogenase and fruc-
tose-1,6-bisphosphatase during denaturation by guanidi-
nium chloride. Biochem J 303, 241–245.
37 Reyes A, Burgos ME, Hubert E & Slebe JC (1987)
Selective thiol group modification renders fructose-1,6-
bisphosphatase insensitive to fructose 2,6-bisphosphate
inhibition, J Biol Chem 262, 8451–8454.
38 Reyes AM, Bravo N, Ludwig H, Iriarte A & Slebe
JC (1993) Modification of Cys-128 of pig kidney
fructose 1,6-bisphosphatase with different thiol
reagents: size dependent effect on the substrate and
fructose-2,6–bisphosphate interaction, J Protein Chem
12, 159–168.
39 Lu G, Williams MK, Giroux EL & Kantrowitz ER
(1995) Fructose-1,6-bisphosphatase: Arginine-22 is
involved in stabilization of the T allosteric state.
Biochemistry 34, 13272–13277.
40 Taketa K & Pogell BM (1965) Allosteric inhibition
of rat liver fructose 1,6-diphosphatase by adenosine
5¢-monophosphate, J Biol Chem 240, 651–662.
41 Pace CN (1986) Determination and analysis of urea and
guanidine hydrochloride denaturation curves. Methods
Enzymol 131, 266–280.
H. C. Ludwig et al. Selective GdmCl disruption of FBPase C1–C2 interface
FEBS Journal 274 (2007) 5337–5349 ª 2007 The Authors Journal compilation ª 2007 FEBS 5349