Báo cáo khoa học: Effect of annealing time of an ice crystal on the activity of type III antifreeze protein pdf
Bạn đang xem bản rút gọn của tài liệu. Xem và tải ngay bản đầy đủ của tài liệu tại đây (276.4 KB, 8 trang )
Effect of annealing time of an ice crystal on the activity
of type III antifreeze protein
Manabu Takamichi
1,2
, Yoshiyuki Nishimiya
1
, Ai Miura
1
and Sakae Tsuda
1,2
1 Functional Protein Research Group, Research Institute of Genome-based Biofactory, National Institute of Advanced Industrial Science and
Technology (AIST), Toyohira, Sapporo, Japan
2 Division of Biological Sciences, Graduate School of Science, Hokkaido University, Kita, Sapporo, Japan
Antifreeze proteins (AFPs) are a structurally diverse
class of macromolecules that interact with water mole-
cules located in the surface of an ice crystal at temper-
atures below the melting point of the solution [1].
Interaction of a substantial number of AFPs with the
ice surface modifies the shape of the ice crystal, result-
ing in unique morphologies, such as a hexagonal
bipyramid or hexagonal trapezohedron [2]. AFPs inhi-
bit ice growth by adsorbing onto the ice surface
(adsorption–inhibition model) [3,4] as the temperature
is lowered, and such inhibition becomes insufficient
below a certain temperature that is favourable for the
initiation of crystal growth. For AFP solutions, this
‘ice-growth initiation temperature’ (T
ini
) is different
from the melting point (T
m
) of the ice crystal, and the
T
ini
is referred to as the nonequilibrium freezing point
(nonequilibrium T
f
). The difference between T
m
and
the nonequilibrium T
f
is defined as thermal hysteresis
(TH), and is generally used as a measure of the growth
inhibition ability of an AFP [5]. Therefore, determina-
tion of the T
ini
and T
m
of a seed ice crystal is an essen-
tial procedure to evaluate the TH activity of AFP.
However, the mechanism of ice binding that alters the
TH value remains unclear [6].
The TH value of AFPs has been evaluated using
a nanolitre osmometer and the ‘capillary technique’
[5,7]. In the former, submicrolitre volumes of an AFP
solution are introduced into an oil droplet, the temper-
ature of which is controlled by a Peltier device. The
TH value is determined by observing the growth of an
Keywords
adsorption–inhibition; annealing time;
notched-fin eelpout; thermal hysteresis;
type III antifreeze protein
Correspondence
S. Tsuda, Functional Protein Research
Group, Research Institute of Genome-based
Biofactory, National Institute of Advanced
Industrial Science and Technology (AIST),
2-17-2-1 Tsukisamu-Higashi, Sapporo
062-8517, Japan
Fax: +81 11 857 8983
Tel: +81 11 857 8912
E-mail:
Website: />index_e.html
(Received 26 July 2007, revised 29 Septem-
ber 2007, accepted 24 October 2007)
doi:10.1111/j.1742-4658.2007.06164.x
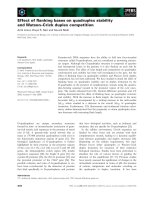
Antifreeze proteins (AFPs) possess a unique ability to bind to a seed ice
crystal to inhibit its growth. The strength of this binding has been evalu-
ated by thermal hysteresis (TH). In this study, we examined the dependence
of TH on experimental parameters, including cooling rate, annealing time,
annealing temperature and the size of the seed ice crystal for an isoform of
type III AFP from notched-fin eelpout (nfeAFP8). TH of nfeAFP8 dramat-
ically decreased when using a fast cooling rate (0.20 °CÆmin
)1
). It also
decreased with increasing seed crystal size under a slow cooling rate
(0.01 °CÆmin
)1
), but such dependence was not detected under the fast cool-
ing rate. TH was enhanced 1.4- and 2.5-fold when ice crystals were
annealed for 3 h at 0.05 and 0.25 °C below T
m
, respectively. After anneal-
ing for 2 h at 0.25 °C below T
m
, TH activity showed marked dependence
on the size of ice crystals. These results suggest that annealing of an ice
crystal for 2–3 h significantly increased the TH value of type III AFP.
Based on a proposed adsorption–inhibition model, we assume that type III
AFP undergoes additional ice binding to the convex ice front over a 2–3 h
time scale, which results in the TH dependence on the annealing time.
Abbreviations
AFGP, antifreeze glycoprotein; AFP, antifreeze protein; nfeAFP8, an isoform of type III AFP from Notched-fin eelpout; TH, thermal
hysteresis.
FEBS Journal 274 (2007) 6469–6476 ª 2007 The Authors Journal compilation ª 2007 FEBS 6469
ice crystal on the device through a microscope within a
cooling gradient. Previous studies have used a similar
procedure for the capillary technique with a larger ice
crystal [5,6]. Duman (2001) demonstrated that consid-
erably higher levels of TH are determined using the
nanolitre osmometer compared with the capillary tech-
nique for the same AFP sample [6]. The sample used
was the AFP of the beetle Dendroides canadensis,
which displayed TH of 1.4 °C using the capillary tech-
nique, and 5.5 °C using the nanolitre osmometer [6].
In addition, several physicochemical factors influence
TH activity [8], and there is a linear and negative cor-
relation between TH activity and the logarithm of the
mass fraction of ice in a sample for cerambycid beetle
Rhagium inquisitor AFP [9,10]. A similar observation
was also reported for the common mealworm Tenebrio
molitor, for which differential scanning calorimetry
was employed [11].
For fish AFPs, TH activity of approximately 1 °Cis
close to the maximum value observed. Fish AFPs can
be classified into four types (I–IV) or as antifreeze gly-
coproteins (AFGPs). Type I AFP, with relative mole-
cular weights ranging from 3.3 to 5 kDa, contains
alanine-rich amphipathic a-helices [12]. Type II AFP is
a globular protein with an approximate relative molecu-
lar weight of 14 kDa that exhibits high structural
homology to a carbohydrate-recognition domain of
C-type lectin [13]. Type III AFP is a 6.5 kDa compact
globular protein characterized by a unique internal two-
fold symmetry motif [14]. Type IV is assumed to form a
four-helix bundle structure [15]. AFGPs are glycopro-
teins whose relative molecular weight ranges from 3 to
34 kDa, and comprises a repetitive tripeptide (Ala-Ala-
Thr) whose Thr side chain is modified by a disaccharide
moiety [16]. The structural characteristics of these fish
AFPs and their target ice crystal surface are different
from those of insect AFPs. A faster cooling rate
decreases the apparent TH value of fish AFPs, and lar-
ger ice crystals tend to initiate crystal growth at higher
temperatures [17]. The TH activity of a small species of
AFGP depends on the freezing rate (i.e. cooling bath
temperature), while a large AFGP showed no such
dependence [18]. Chapsky and Rubinsky (1997) exam-
ined the kinetic ice binding of fish type I AFP using a
technique called temperature-gradient thermometry
[19]. For fish type III AFP, no time-dependence of TH
activity has been examined to date. These data raise the
question about the key determinant that has a signifi-
cant influence on the TH activity of an AFP species.
The present study examined the TH value of a
recombinant 65-residue type III AFP called nfeAFP8,
which was recently discovered in the Notched-fin
eelpout [20]. nfeAFP8 exhibits 94% sequence identity
with HPLC12, a well-examined type III AFP isoform
found in the ocean pout Macrozoarces americanus [21].
For TH measurements, we utilized a custom-made
photomicroscope system equipped with a temperature
controller and a sample holder, for which data consis-
tency with a commercial freezing-point osmometer had
been verified. We then examined the dependence of
TH value on the cooling rate, the seed ice crystal size,
crystal annealing time, and annealing temperature. The
data obtained revealed that the TH value is signifi-
cantly increased when the ice crystal is annealed for a
long time at a lower annealing temperature. Based on
these results, we discuss the ice-binding mechanism of
type III AFP that causes TH enhancement over a very
slow time scale.
Results
Before determining the TH activity of nfeAFP8, the
performance of our photosystem was verified using
solutions of NaCl and glucose. The sample solution in
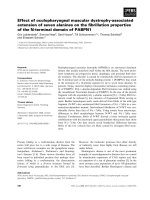
the capillary tube (Fig. 1) was initially cooled with the
temperature controller until completely frozen. The
sample was then warmed until an ice crystal was
apparent. As expected, the ice crystal prepared in each
sample exhibited a ‘disk-like’ morphology, which did
not subsequently change [22]. We carefully manipu-
lated the temperature controller to fix the diameter of
the seed crystal at approximately 20 lm, and examined
whether there was a difference between T
ini
and T
m
.
It appeared that the temperatures were affected by
a change in the temperature controller of only
± 0.01 °C, consistent with equality between T
ini
and
T
m
for the solutions of NaCl and glucose, affirming
that they possess no specific ice-binding ability (i.e.
T
ini
¼ equilibrium T
f
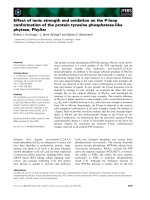
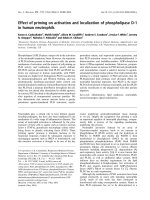
). In Fig. 2A, the concentration
dependence of the equilibrium T
f
(¼ T
m
) for NaCl and
glucose are shown by open circles and open squares,
respectively. The corresponding data measured using a
freezing-point osmometer are also plotted in Fig. 2A
(closed circles and closed squares). The linear profiles
obtained with our photosystem and the osmometer
perfectly overlapped for the NaCl and glucose solu-
tions. These results indicated that our system precisely
evaluates the T
ini
and T
m
values of a seed ice crystal in
a solution.
An example of TH determination for nfeAFP8 using
our photosystem is shown in Fig. 2B, for which
nfeAFP8 was dissolved to a final concentration of
0.1 mm. The figure depicts a series of images of an ice
crystal formed in solution at )0.46 °C; the crystals had
a bipyramidal structure due to adsorption of nfeAFP8
onto their surfaces. Adsorption of the AFP stopped ice
Time-dependent enhancement of thermal hysteresis M. Takamichi et al.
6470 FEBS Journal 274 (2007) 6469–6476 ª 2007 The Authors Journal compilation ª 2007 FEBS
crystal growth during the 0.01 °CÆmin
)1
temperature
decrease (images a and b), but failed to stop growth at
)0.81 °C (image c) and allowed subsequent crystal
growth (images d–h). The nonequilibrium T
f
of
nfeAFP8 was hence determined to be )0.81 °C. As a
separate experiment determined the T
m
to be )0.30 °C
for an ice crystal in the same sample, 0.51 °C is the
TH value of 0.1 mm nfeAFP8 under these experimen-
tal conditions.
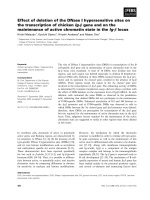
Figure 3A shows the concentration dependence of
the TH activity of nfeAFP8 measured at cooling rates
of 0.01 °CÆmin
)1
(closed circles) and 0.20 °CÆmin
)1
(open circles). The TH activity obtained with a slow
cooling rate (0.01 °CÆmin
)1
) was significantly (1.7-fold)
higher than that obtained with the fast cooling rate
(0.20 °CÆmin
)1
). Figure 3B is a plot of the TH depen-
dence on the cooling rate of 0.1 mm nfeAFP8. The TH
value decayed exponentially with increasing cooling
rate, and reached a plateau at a rate of approximately
0.10 °CÆmin
)1
.
When the relationship between TH and crystal size
was assessed, a marked difference was noted between
the cooling rates of 0.01 and 0.20 °CÆmin
)1
(Fig. 3C).
The TH activity for a slow rate of cooling
(0.01 °CÆmin
)1
) markedly decreased with increasing ice
crystal size, while that measured using a fast cooling
rate (0.20 °CÆmin
)1
) exhibited only a slight decrease. A
high TH value (approximately 0.7 °C) was obtained
only when a slow cooling rate (0.01 °C min
)1
) was
used for a small ice crystal.
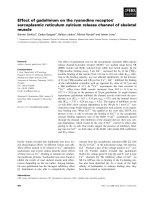
Figure 4A is a plot of TH activity measured for
0.1 mm nfeAFP8 after the annealing of an ice bipyra-
mid for 0–3 h. The annealing was performed at a T
m
of )0.05 °Cor)0.25 °C. Each experiment used the
same cooling rate of 0.20 °CÆmin
)1
. The TH value
Photomicroscope
CCD Camera
Object glas s
Computer
Temp. controlle r
Display
A
B
Crystal & Temp. monitor)
LN
2
dewa r
Stage
Capillary holder
Viewing hole
Capillary (sample)
Capillary
Sample solution
Oil
Air
Capillary holde r
Freezing plate
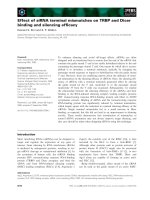
Fig. 1. Experimental set-up (photosystem)
for viewing the growth and melting of ice
crystal to determine thermal hysteresis
value of an AFP solution. (A) The photosys-
tem composed of a photomicroscope (Leica
DMLB100), a temperature controller (Lin-
kam THMS 600), a Colorvideo 3CCD camera
(Sony), and an image-processing computer.
(B) The capillary cell containing a 0.75 lL
sample solution, and setting of the sample
into the holder.
4.0
3.5
A
B
0.5
1.0
1.5
2.0
2.5
3.0
0
0 0 .25 1.000.75
0.50
NaCl
Glucose
photo-system & osmometer
ΔT
f
(
o
C)
Concentration (
M
)
20
μ
m
h
g
f
e
d
c
b
a
Fig. 2. (A) Concentration dependence of the equilibrium freezing
point of NaCl and glucose solutions. Open symbols represent the
data determined using the photosystem, and closed symbols are
those obtained using a commercial osmometer (Vogel, model
OM802). The error bars represent standard deviations of the data
obtained from at least three experiments. (B) Snapshots showing
the change in an ice bipyramid created in a 0.1 m
M solution of
type III AFP from Notched-fin eelpout (denoted nfeAFP8, cooling
rate 0.01 °CÆmin
)1
). (a) T ¼ –0.46 °C; (b) T ¼ –0.61 °C; (c)–(h)
T ¼ –0.81 °C. The nonequilibrium freezing point of )0.81 °C was
evaluated from this experiment.
M. Takamichi et al. Time-dependent enhancement of thermal hysteresis
FEBS Journal 274 (2007) 6469–6476 ª 2007 The Authors Journal compilation ª 2007 FEBS 6471
tended to increase in proportion to the crystal anneal-
ing time. When the ice bipyramid was annealed for 3 h
at a T
m
of )0.05 °C, TH activity increased 1.4-fold
compared with time zero. This TH increase reached
2.5-fold when the 3 h annealing was performed at a
T
m
of )0.25 °C.
Dependence of TH on the size of the seed ice crystal
was also examined for 0.1 mm nfeAFP8 at a cooling
rate of 0.20 °CÆmin
)1
. The closed circles in Fig. 4B rep-
resent TH values obtained after 2 h annealing of the
ice bipyramid at a T
m
of )0.25 °C, and the open cir-
cles, which are reproduced from Fig. 3C, depict com-
parable data obtained without ice crystal annealing.
TH decreased exponentially with increasing crystal size
only after 2 h annealing at a T
m
of )0.25 °C, and no
TH dependence on crystal size was evident when TH
was measured soon after creation of the ice bipyramid.
Discussion
In the present study, we first examined the TH depen-
dence of nfeAFP8 on the rate of cooling (Fig. 3), uti-
lizing our in-house-built photomicroscope system.
Data consistency between the system and a freezing-
point osmometer (Fig. 2) validated the performance of
the system for evaluating TH value. Using this system,
we demonstrated that a slower rate of cooling ampli-
fies TH, while a faster rate of cooling progressively
diminishes TH until it reaches a plateau. A similar,
but not identical, observation has been made for a
small species of AFGP using a freezing-point osmome-
ter; the AFGP exhibited significant antifreeze activity
upon slow cooling, but lacked such activity if cooled
quickly [18]. In addition, a time-dependent change in
T
f
of a type I AFP solution has been demonstrated
0
0.1
0.2
0.3
0.4
0.5
0.6
0.7
0 0.1 0.2 0.3 0.4
0
0.1
0.2
0.3
0.4
0.5
0.6
Concentration (mM)
0.01
o
C/min
0.20
o
C/min
0 0.10 0.200.05 0.15
Coolin
g
rate (
o
C/min)
Thermal hysteresis (
o
C)
Thermal hysteresis (
o
C)
(slow)
(fast)
slow fast
0
0.1
0.2
0.3
0.4
0.5
0.6
0.7
0.8
0.01
o
C/min
0.20
o
C/min
Ice crystal size (
μ
m)
03515 252010 30
Thermal hysteresis (
o
C)
(slow)
(fast)
C
A
B
Fig. 3. (A) Concentration dependence of TH for a 20 lm long ice crystal measured using 0.01 °CÆmin
)1
(closed circles) and 0.20 °CÆmin
)1
(open circles) rates of cooling. (B) Dependence of TH on the rate of cooling (°CÆmin
)1
). (C) Dependence of TH on the size of the ice crystal.
Each point represents the mean of three experiments and the error bar represents the standard deviation. All experiments were performed
immediately after preparation of an ice crystal in a 0.1 m
M solution of nfeAFP8.
Annealing time (h)
0
0.1
0.2
0.3
0.4
0.5
0.6
0.7
0.8
0 1.0 2.0 3.0
Annealing Temp.
= T
m
- 0.25 °C
1.4
2.5
1.0
Ice crystal size (
μ
m)
0
0.1
0.2
0.3
0.4
0.5
0.6
0.7
0.8
0.9
0
15 252010
30 35
Annealing Time
= 2 h
Annealing Time = 0 h
Thermal hysteresis (°C)
Thermal hysteresis (°C)
A
B
Annealing Temp.
= T
m
- 0.05 °C
Fig. 4. Influence of annealing time and ice crystal size on TH. (A)
Thermal hysteresis of nfeAFP8 measured after annealing of an ice
bipyramid for a certain period of time (0–3 h). The measurement
was repeated for three times at the annealing temperatures of
T
m
)0.25 °C (closed circles) and T
m
)0.05 °C (open circles) using a
cooling rate of 0.20 °CÆmin
)1
. (B) Dependence of thermal hysteresis
of nfeAFP8 on the size of the seed ice crystal. Closed circles are
the data obtained after 2 h of annealing, and open circles are those
without annealing. All other experimental parameters are the same
as Fig. 3.
Time-dependent enhancement of thermal hysteresis M. Takamichi et al.
6472 FEBS Journal 274 (2007) 6469–6476 ª 2007 The Authors Journal compilation ª 2007 FEBS
using temperature-gradient thermometry [19]. No such
time-dependent change in TH was reported for insect
AFPs, while a linear and negative correlation was
detected between TH and the logarithm of the mass
fraction of ice crystal versus the total water mass for
AFP from cerambycid beetle R. inquisitor [9,10].
We examined the dependence of TH on the crystal
size under fast (0.20 °CÆmin
)1
) and slow
(0.01 °CÆmin
)1
) cooling rates to clarify the correlation
between the cooling rate and seed ice crystal size.
These results show that TH decreases with increasing
crystal size at the slow cooling rate, and does not
depend on the crystal size at the fast cooling rate.
These results imply that the cooling rate dominates the
TH dependence on the seed crystal size. As actual tem-
perature control of the freezing plate in our system is
stepwise, a different cooling rate will produce a differ-
ent time lapse of cooling on a sample. In other words,
there is a longer annealing period before starting the
TH measurement at a slower cooling rate. We there-
fore examined whether an annealing period of 2–3 h
influenced the TH value of nfeAFP8. An annealing
experiment was performed within the hysteresis gap
(0.25 and 0.05 °C below T
m
), and TH was measured at
a fixed cooling rate (0.20 °CÆmin
)1
). These parameters
revealed that the annealing time amplifies TH, the
amplification level is enhanced by lowering of the
annealing temperature, and TH shows dependence on
crystal size only after 2–3 h of annealing. As the time-
dependent amplification of TH explains the detection
of a higher TH value at the slower cooling rate, it may
be concluded that the time of annealing is an essential
influence on the TH value of nfeAFP8.
For type III AFP, the 3D structure and the ice-bind-
ing mechanism have been extensively examined. High-
resolution X-ray and NMR structures have revealed
that a remarkably flat and amphipathic surface is
constructed on type III AFP, enabling complementary
binding to the flat ice prism plane [14,21]. When the
type III AFP solution contains a seed ice crystal, the
AFP molecules come closer to the ice through the dif-
fusion process, for which an association constant of
10
7
)10
8
s
)1
Æm
)1
can be assumed from the Smulochow-
ski model [23]. The AFP molecules then undergo
prompt binding onto the flat ice plane, which has been
thought to progress irreversibly according to the
adsorption–inhibition mechanism at the ice–water
interface [3,4]. Subsequently, convex ice fronts are
formed between the ice-bound AFPs on the flat plane,
as depicted in Fig. 5A. At this stage, the ice crystal
adopts a bipyramidal shape. During subsequent
TH measurements, the convex ice front overgrows
(Fig. 5B, dashed line), allowing uncontrolled growth at
the nonequilibrium T
f
. This leads to the detection of a
nonzero TH value at time zero (0 h of annealing).
The height and curvature of the convex ice front are
defined by spacing between adsorbed AFP molecules
(i.e. the Kelvin effect [24]), such that the TH value
reflects the fraction of ice-bound AFPs on the flat ice
plane. Indeed, TH increases in proportion with the
total concentration of nfeAFP8, as can be seen in
Fig. 3A. The fraction of AFPs on the flat ice plane is
not, however, changed during the present time-depen-
dent experiment on TH (Fig. 4) as we fixed the con-
centration of AFP at 0.1 mm. A plausible explanation
for the time-dependence of TH is that nfeAFP8 under-
goes ‘secondary’ binding onto the convex ice front
over a very slow time scale (2–3 h; Fig. 5C). Indeed, a
recent study on ice etching revealed that type III AFP
can bind to several ice planes in addition to the (10–
10) prism plane [14]. TH is the level of supercooling
required to nucleate ice growth from the ‘weak’ convex
ice fronts, the growth of which is not strongly inhib-
ited by AFP. If AFP undergoes secondary binding
C
AFP
low TH
TH measurement
A
annealing time (2–3 h)
TH measurement
B
D
solution
ice
ice
ice
high TH
ice
Fig. 5. Schematic drawing of ice growth
inhibition of type III AFP based on the
‘adsorption–inhibition’ model [3,4]. (A) A
convex ice front is created after primary
binding of type III AFP onto the flat ice
plane. (B) Overgrowth of the convex ice
front, giving a low TH value. (C) Possible
secondary ice binding of type III AFP onto
the convex ice front during the annealing
period (2–3 h). (D) AFPs bound onto the
convex ice front narrow the growth area
(dashed line), leading to an enhancement of
TH activity.
M. Takamichi et al. Time-dependent enhancement of thermal hysteresis
FEBS Journal 274 (2007) 6469–6476 ª 2007 The Authors Journal compilation ª 2007 FEBS 6473
over a very slow time scale after the primary ice bind-
ing, it stabilizes the convex ice front (Fig. 5D), leading
to the time-dependent change in TH activity. This con-
cept further explains the increased level of time-depen-
dent amplification of TH at the lower annealing
temperature (Fig. 4A). The convex ice front will
become more accentuated by lowering the annealing
temperature, which will raise the opportunity for bind-
ing of AFPs to the growing convex ice front, thereby
enhancing TH activity. We recently monitored the flu-
orescence of seed ice crystals at 30 min intervals in a
solution of a fusion protein comprising nfeAFP8 and
green fluorescence protein (nfeAFP8–GFP) (see supple-
mentary Fig. S1). We observed a slight increase of
fluorescence intensity in a region proximal to the
seed ice surface, accompanying a slight growth of ice
crystals in proportion with the annealing time (0–3 h).
It is noteworthy that such an intensity change was
observed only at the lower annealing temperature
(T
m
)0.25 °C). These preliminary data are also consis-
tent with the idea of progressive binding of AFP over
a time scale of 2–3 h.
A larger number of convex ice fronts are presumably
located on a larger-sized ice crystal. If secondary
binding of AFP has the ability to stabilize convex ice
surfaces, such stabilization becomes imperfect with an
increasing number of weak points on the ice crystal.
This supposition is consistent with the data obtained
after 2 h of annealing (Fig. 4B, closed circles), for
which a reduction in TH was apparent with increasing
size of the ice crystal. The lack of significant size
dependence of TH activity (Fig. 4B, open circles)
might be ascribed to nonstabilization of the weak
point of any size of the crystals, because of the lack of
secondary binding of AFP at time zero (0 h of anneal-
ing). It should be noted that no apparent time-depen-
dent TH increase was detected for different types of
AFP (type I AFP from great sculpin and type II AFP
from Japanese smelt; data not shown). Therefore, it is
not clear whether such a slow accumulation process is
a general mechanism for any type of AFP. Several past
studies have shown that the bipyramidal ice crystal
can be maintained for a long time [25], but no TH
data have been reported for such an ice bipyramid. We
believe that a simple TH measurement before and after
2 h will enable us to learn more about the secondary
binding of AFP over a very slow time scale, which will
be detected as enhancement of the observed TH value.
To summarize, we have successfully prepared a
recombinant type III AFP isoform and carefully mea-
sured its TH activity using an in-house-built photomi-
croscope system. Measurement of TH dependence on
various experimental parameters revealed, for the first
time, that annealing time significantly causes an
enhancement of TH activity of fish type III AFP. The
adsorption–inhibition model may explain this time-
dependent change in TH if type III AFP undergoes sec-
ondary binding to the convex ice front following bind-
ing to the primary ice plane.
Experimental procedures
Sample preparation of AFPIII
A sample of the type III AFP isoform nfeAFP8 was pre-
pared for TH measurements as described previously [20]
with the following modifications. A soluble fraction con-
taining a recombinant nfeAFP8 after sonication of Escheri-
chia coli BL21 (DE3) was dialyzed against 50 mm citric
acid buffer (pH 2.9). After dialysis, cation-exchange chro-
matography was performed using an Econo-Pac High S
cartridge (Bio-Rad, Hercules, CA, USA) with a linear NaCl
gradient (0–0.5 m)in50mm sodium citrate buffer (pH 2.9).
The purified nfeAFP8 was concentrated (approximately
7mgÆmL
)1
), and then diluted prior to TH determination.
For all the TH experiments, the sample was dissolved in
0.1 m ammonium bicarbonate (pH 7.9).
TH measurement system
The experimental set-up using a commercial photomicro-
scope system (denoted as the ‘photosystem’) is illustrated in
Fig. 1. The two main instruments in this system were a Leica
DMLB100 photomicroscope (Leica Microsystems, Wetzlar,
Germany) and a Linkam THMS 600 temperature controller
(Linkam Scientific Instruments Ltd, Tadworth, Surrey, UK)
equipped with a liquid nitrogen Dewar flask. The latter con-
trolled the temperature of the freezing plate with an accuracy
of 0.01 °C by combining the use of an electric heater and
liquid nitrogen. The left portion of Fig. 1(B) illustrates the
position of the sample solution in a quarter of a Hirschmann
capillary tube (Hirschmann Labogera
¨
te, Heilbronn, Ger-
many) (length 30 mm, diameter 0.92 mm); each end of the
tube was sealed using mineral oil (approximately 1 lL each)
to prevent vaporization of the sample solution (approxi-
mately 0.75 lL). The sample-containing capillary was then
loaded into a custom-made copper capillary holder (diameter
17 mm, thickness 2.5 mm) (Fig. 1B, right), which was placed
into the freezing plate on the cooling stage (Fig. 1A). After
positioning of the capillary tube, 15 lL of ethylene glycol
was poured through the viewing hole (Fig. 1B, right) to
achieve thermal conductivity between the holder and capil-
lary tube. The ice crystal image was captured using a Color-
video 3CCD camera (Sony, Tokyo, Japan) (Fig. 1A), and
the temperature status was simultaneously viewed on a dis-
play and saved as a video file on a personal computer
(Fig. 1A). We determined T
f
and T
m
by monitoring a slower
Time-dependent enhancement of thermal hysteresis M. Takamichi et al.
6474 FEBS Journal 274 (2007) 6469–6476 ª 2007 The Authors Journal compilation ª 2007 FEBS
playback of the video. The size and length of the ice bipyra-
mid was evaluated from the crystal image captured by the
video. For accurate determination of the crystal length, we
initially captured the image of a 30 lm fiber inserted into the
sample solution, and found that the captured length needed
to be multiplied by 1.2 to determine the actual length of the
crystal. Measurement of the T
f
and T
m
values was repeated
at least three times, and the values were averaged. More
details of the TH measurement procedure are described in
Results.
A model OM802 commercial freezing-point osmometer
(Vogel, Giessen, Germany) was used to check the perfor-
mance of the photosystem. We initially placed a 50 lL sam-
ple into the cooling bath ()7 °C) of the osmometer. When
the sample temperature reached )7 °C, the instrument
automatically inserted a frosty probe into the sample solu-
tion to initiate the growth of ice crystals. Accordingly,
latent heat was emitted owing to the phase transition from
liquid to solid state, which raised the temperature of the
sample. After completion of the rise in temperature, an ice–
water equilibrium state was achieved at a certain negative
temperature, which was the T
f
value in this instrument.
Before performing measurements, the osmometer was nor-
malized with a standard fluid of 300 mOsmol.
Acknowledgements
We are grateful to Brian Sykes at the University of
Alberta (Edmonton, Canada) for fruitful discussions
on the ice-binding mechanism of nfeAFP8.
References
1 Jia Z & Davies PL (2002) Antifreeze proteins: an
unusual receptor–ligand interaction. Trends Biochem Sci
27, 101–106.
2 Davies PL & Hew CL (1990) Biochemistry of fish
antifreeze proteins. FASEB J 4, 2460–2468.
3 Raymond JA & DeVries AL (1977) Adsorption inhibi-
tion as a mechanism of freezing resistance in polar
fishes. Proc Natl Acad Sci USA 74, 2589–2593.
4 Knight CA & DeVries AL (1994) Effects of a
polymeric, nonequilibrium ‘antifreeze’ upon ice growth
from water. J Crystal Growth 143, 301–310.
5 DeVries AL (1986) Antifreeze glycopeptides and
peptides: interactions with ice and water. Methods
Enzymol 127, 293–303.
6 Duman JG (2001) Antifreeze and ice nucleator proteins
in terrestrial arthropods. Annu Rev Physiol 63, 327–357.
7 Chakrabartty A, Yang DS & Hew CL (1989) Structure–
function relationship in a winter flounder antifreeze
polypeptide. II. Alteration of the component growth
rates of ice by synthetic antifreeze polypeptides. J Biol
Chem 264, 11313–11316.
8 Li N, Andorfer CA & Duman JG (1998) Enhancement
of insect antifreeze protein activity by solutes of low
molecular mass. J Exp Biol 201, 2243–2251.
9 Zachariassen KE & Husby JA (1982) Antifreeze effect
of thermal hysteresis agents protects highly supercooled
insects. Nature 298, 865–867.
10 Zachariassen KE, DeVries AL, Hunt B & Kristiansen E
(2002) Effect of ice fraction and dilution factor on the
antifreeze activity in the hemolymph of the cerambycid
beetle Rhagium inquisitor. Cryobiology 44, 132–141.
11 Hansen TN & Baust JG (1988) Differential scanning
calorimetric analysis of antifreeze protein activity in the
common mealworm, Tenebrio molitor. Biochim Biophys
Acta 957, 217–221.
12 Sicheri F & Yang DS (1995) Ice-binding structure and
mechanism of an antifreeze protein from winter
flounder. Nature 375, 427–431.
13 Gronwald W, Loewen MC, Lix B, Daugulis AJ,
Sonnichsen FD, Davies PL & Sykes BD (1998) The
solution structure of type II antifreeze protein reveals a
new member of the lectin family. Biochemistry 37, 4712–
4721.
14 Antson AA, Smith DJ, Roper DI, Lewis S, Caves LS,
Verma CS, Buckley SL, Lillford PJ & Hubbard RE
(2001) Understanding the mechanism of ice binding by
type III antifreeze proteins. J Mol Biol 305, 875–889.
15 Deng G, Andrews DW & Laursen RA (1997) Amino
acid sequence of a new type of antifreeze protein, from
the longhorn sculpin Myoxocephalus octodecimspinosis.
FEBS Lett 402, 17–20.
16 Tachibana Y, Fletcher GL, Fujitani N, Tsuda S, Monde
K & Nishimura S (2004) Antifreeze glycoproteins:
elucidation of the structural motifs that are essential for
antifreeze activity. Angew Chem 43, 856–862.
17 Fletcher GL, Hew CL & Davies PL (2001) Antifreeze
proteins of teleost fishes. Annu Rev Physiol 63, 359–390.
18 Raymond JA & DeVries AL (1972) Freezing behavior
of fish blood glycoproteins with antifreeze properties.
Cryobiology 9
, 541–547.
19 Chapsky L & Rubinsky B (1997) Kinetics of antifreeze
protein-induced ice growth inhibition. FEBS Lett 412,
241–244.
20 Nishimiya Y, Sato R, Takamichi M, Miura A & Tsuda
S (2005) Co-operative effect of the isoforms of type III
antifreeze protein expressed in Notched-fin eelpout,
Zoarces elongates Kner. FEBS J 272, 482–492.
21 So
¨
nnichsen FD, DeLuca CI, Davies PL & Sykes BD
(1996) Refined solution structure of type III antifreeze
protein: hydrophobic groups may be involved in the
energetics of the protein–ice interaction. Structure 4,
1325–1337.
22 DeLuca CI, Comley R & Davies PL (1998) Antifreeze
proteins bind independently to ice. Biophys J 74, 1502–
1508.
M. Takamichi et al. Time-dependent enhancement of thermal hysteresis
FEBS Journal 274 (2007) 6469–6476 ª 2007 The Authors Journal compilation ª 2007 FEBS 6475
23 Smoluchowski MV (1917) Versuch einer mathematis-
chen Theorie der Koagulationskinetik kolloider
Lo
¨
sungen. Z Phys Chem 92, 129–168.
24 Wilson PW (1993) Explaining thermal hysteresis by the
Kelvin effect. Cryo-Lett 14, 31–36.
25 Haymet ADJ, Ward LG, Harding MM & Knight CA
(1998) Valine substituted winter flounder ‘antifreeze’:
preservation of ice growth hysteresis. FEBS Lett 430,
301–306.
Supplementary material
The following supplementary material is available
online:
Fig. S1. Time-dependent changes in photomicroscope
image of an ice bipyramid in the solution of nfeAFP–
GFP.
This material is available as part of the online article
from
Please note: Blackwell Publishing is not responsible
for the content or functionality of any supplementary
materials supplied by the authors. Any queries (other
than missing material) should be directed to the corre-
sponding author for the article.
Time-dependent enhancement of thermal hysteresis M. Takamichi et al.
6476 FEBS Journal 274 (2007) 6469–6476 ª 2007 The Authors Journal compilation ª 2007 FEBS