THE KEY INDICATORS for Asia and the Pacific 2012 pdf
Bạn đang xem bản rút gọn của tài liệu. Xem và tải ngay bản đầy đủ của tài liệu tại đây (9.81 MB, 337 trang )
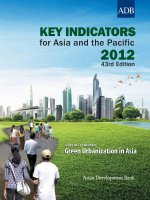
KEY INDICATORS
for Asia and the Pacific
2012
Printed in the Philippines
Asian Development Bank
6 ADB Avenue, Mandaluyong City
1550 Metro Manila, Philippines
www.adb.org
Printed on recycled paper.
KEY INDICATORS
for Asia and the Pacific
2012
Green Urbanization in Asia
SPECIAL CHAPTER:
Key Indicators for Asia and the Pacific 2012
Key Indicators for Asia and the Pacific 2012, the 43rd edition of this series, is a statistical data book
presenting economic, financial, social, and environmental indicators for the 48 regional members of the
Asian Development Bank (ADB). This issue of Key Indicators presents in Part I a special chapter—Green
Urbanization in Asia—followed by statistical tables in Parts II and III with short, nontechnical
commentaries on economic, financial, social, and environmental developments.
Part II comprises the first set of statistical tables and commentaries, which look at the Millennium
Development Goals and progress in the region toward achieving key targets. The second set of tables in
Part III is grouped into seven themes, and provides a broader picture of economic, financial, social, and
environmental developments. This publication aims to present the latest key statistics on development
issues concerning the economies of Asia and the Pacific to a wide audience, including policy makers,
development practitioners, government officials, researchers, students, and the general public. This year,
ADB also publishes the second edition of the Framework of Inclusive Growth Indicators, a special
supplement to Key Indicators.
About the Asian Development Bank
ADB’s vision is an Asia and Pacific region free of poverty. Its mission is to help its developing member
countries reduce poverty and improve the quality of life of their people. Despite the region’s many
successes, it remains home to two-thirds of the world’s poor: 1.8 billion people who live on less than
$2 a day, with 903 million struggling on less than $1.25 a day. ADBis committed to reducing poverty
through inclusive economic growth, environmentally sustainable growth, and regional integration.
Based in Manila, ADB is owned by 67 members, including 48 from the region. Its main instruments
for helping its developing member countries are policy dialogue, loans, equity investments, guarantees,
grants, and technical assistance.
All rights reserved. Published in 2012.
Printed in the Philippines.
ISBN: 978-92-9092-816-4
Publication Stock No. FLS124810-3
Cataloging-In-Publication Data
Asian Development Bank.
Key Indicators for Asia and the Pacific 2012.
Mandaluyong City, Philippines: Asian Development Bank, 2012.
1. economic indicators 2. financial indicators 3. social indicators 4. energy and environmental indicators
5. millennium development goals 6. infrastructure indicators 7. governance indicators
I. Asian Development Bank.
The views expressed in this book do not necessarily reflect the views and policies of the
Asian Development Bank (ADB) or its Board of Governors or the governments they represent.
ADB does not guarantee the accuracy of the data included in this publication and accepts no
responsibility for any consequence of their use.
By making any designation of or reference to a particular territory or geographic area, or by using the
term “country” in this document, ADB does not intend to make any judgments as to the legal or other
status of any territory or area.
ADB encourages printing or copying information exclusively for personal and noncommercial use
with proper acknowledgment of ADB. Users are restricted from reselling, redistributing, or creating
derivative works for commercial purposes without the express, written consent of ADB.
Asian Development Bank
6 ADB Avenue, Mandaluyong City
1550 Metro Manila, Philippines
Tel +63 2 632 4444
Fax +63 2 636 2444
www.adb.org
iii
Foreword
The 43
rd
Development Goals (MDGs) indicator series for the 48 regional members. The Key Indicators provides
Framework of Inclusive Growth Indicators supplements the main Key Indicators
the region will be confronted with even greater environmental challenges that are already serious,
clearly describes Asia
protected areas.
2
hope that the Key Indicators
Haruhiko Kuroda
Haruhiko Kuroda
President
v
Acknowledgments
The was prepared by the
Development Indicators and Policy Research Division of the Economics and Research Department,
under the overall supervision of Douglas H. Brooks.
Glenita Amoranto, Barbara Dizon, Nalwino Billones, Eileen Capilit, Modesta de Castro, Anna
Goals (MDGs), regional trends and tables, and country tables. They also wrote the analysis of key
the economics editor for Parts II and III.
and Guia De Guzman were the copy editors. Francis Manio designed the cover. Rhommell Rico did
Ma. Roselia Babalo and Clarita Dalaguit-Truong rendered secretarial and proofreading services.
Key
.
Changyong Rhee
Chief Economist
vii
Contents
Foreword iii
Acknowledgments v
xvi
Guide for Users xxi
Highlights xxvii
PART I
– SPECIAL CHAPTER
4
9
11
Greenhouse Gas Emissions 13
14
Resilience to Climate Change 15
19
Urban Slums and Urban Poverty 19
19
21
22
24
25
26
Summary 28
28
29
34
38
Finance, Transparency, and Accountability 38
Summary 40
40
42
viii
4
15
16
16
17
17
Table 7 The Environmental Kuznets Curve for Asia 21
Table 8 United States Imports of High-Tech Green Equipment (%) 23
25
26
27
Table 12 Water Pricing 31
5
5
5
6
6
7
9
9
10
10
Figure 11 Urban and Rural Inequality in Asia (%) 10
11
11
10 above 100 µg/m
3
, 2008–2009 12
Figure 15 PM
10 Kernel Density, 2008–2009 12
12
2
Emissions in 2008 13
2
Emissions (t/capita) 13
18
19
19
2
Emissions (t/capita) and GDP Per Capita (in 2005 PPP) 21
2
21
ADB Developing Member Economies) 22
23
25
25
26
27
28
10 32
Box 1 Metros Moving People in Delhi and Shanghai 14
15
Contents
Box 3 The Environmental Kuznets Curve 20
24
34
Box 6 From Waste to Energy in Singapore 34
Box 7 Kawasaki Eco-Town 36
37
Box 9 Small-Scale Energy Systems: Garment Factories in Bangladesh 37
37
Box 11 Kampung Code River: Upgrading a Slum 39
Box 12 Restoring the Cheonggyecheon River 40
PART II
49
51
Table 2. Millennium Development Goals Progress Tracking 52
54
whose income is less than one dollar a day 62
including women and young people 63
64
65
Table 2.1 Target 2.A: Ensure that by 2015, children everywhere, boys and girls alike,
will be able to complete a full course of primary schooling 69
72
76
78
Table 4.1 Target 4.A: Reduce by two-thirds, between 1990 and 2015,
82
Table 5.1 Target 5.A: Reduce by three-quarters, between 1990 and 2015,
88
89
91
for all those who need it 96
Table 6.2 Target 6.C: Have halted by 2015 and begun to reverse the incidence
of malaria and other major diseases 97
99
Table 7.1 Target 7.A: Integrate the principles of sustainable development into country
policies and programs and reverse the loss of environmental resources 106
Table 7.2 Target 7.B: Reduce biodiversity loss, achieving, by 2010,
108
109
of at least 100 million slum dwellers 111
112
Table 8.1 Target 8.A: Develop further an open, rule-based, predictable,
117
Table 8.2 Target 8.B: Address the special needs of least developed countries 118
Table 8.3 Target 8.C: Address the special needs of landlocked developing countries
and small island developing states 120
55
55
56
56
57
57
58
58
59
59
60
66
66
67
73
74
. 74
79
Figure 4.2 Under-Five and Infant Mortality Rates, 1990 and 2010 80
80
84
84
85
85
86
86
91
92
Figure 6.3 Change in Tuberculosis Incidence Rates, 1990 and 2010 93
93
94
Figure 7.1 Percentage of Land Area Covered by Forest, 1990 and 2010 100
Figure 7.2 Percentage of Protected Terrestrial and Marine Areas, 1990 and 2010 101
Contents
Figure 7.3 Percentage Change of Per Capita Emissions of Carbon Dioxide, 2009 compared with 1990 101
102
102
103
103
104
104
113
113
114
114
114
115
115
116
Box 1 Millennium Development Goals 49
94
125
134
135
136
137
138
139
140
Labor Force and Employment
141
Table 1.9 Unemployment Rate (%) 142
143
Table 1.11 Employment in Agriculture (% of total employment) 144
Table 1.12 Employment in Industry (% of total employment) 145
Table 1.13 Employment in Services (% of total employment) 146
Poverty Indicators
Table 1.14 Poverty and Inequality 147
Table 1.15 Human Development Index 148
Social Indicators
Table 1.16 Life Expectancy at Birth (years) 149
150
151
Table 1.19 Adult Literacy Rate (15 years and over, %) 152
153
154
155
156
163
164
Table 2.3 GNI Per Capita, Atlas Method (current dollars) 165
166
167
168
169
170
171
Table 2.10 Exports of Goods and Services (% of GDP) 172
Table 2.11 Imports of Goods and Services (% of GDP) 173
174
Table 2.13 Growth Rates of Real GDP (%) 175
Table 2.14 Growth Rates of Real GDP Per Capita (%) 176
177
178
179
180
181
182
Table 2.21 Growth Rates of Real Exports of Goods and Services (%) 183
Table 2.22 Growth Rates of Real Imports of Goods and Services (%) 184
185
186
187
Prices
Table 3.1 Growth Rates of Consumer Price Index (%) 193
Table 3.2 Growth Rates of Food Consumer Price Index (%) 194
Table 3.3 Growth Rates of Wholesale/Producer Price Index (%) 195
196
Money and Finance
Table 3.5 Growth Rates of Money Supply (M2) (%) 197
Table 3.6 Money Supply (M2) (% of GDP) 198
Table 3.7 Interest Rate on Savings Deposits (% per annum, period averages) 199
Table 3.8 Interest Rate on Time Deposits of 12 Months (% per annum, period averages) 200
Table 3.9 Lending Interest Rate (% per annum, period averages) 201
202
203
Table 3.12 Bank Nonperfoming Loans (% of total gross loans) 204
Table 3.13 Growth Rates of Stock Market Price Index (%) 205
206
207
Exchange Rates
208
Table 3.17 Purchasing Power Parity Conversion Factor
209
Table 3.18 Price Level Indices
210
Contents
211
Balance of Payments
Table 4.1 Trade in Goods Balance (% of GDP) 216
Table 4.2 Trade in Services Balance (% of GDP) 217
Table 4.3 Current Account Balance (% of GDP) 218
219
220
221
222
External Trade
223
Table 4.9 Growth Rates of Merchandise Exports (%) 224
225
Table 4.11 Growth Rates of Merchandise Imports (%) 226
Table 4.12 Trade in Goods (% of GDP) 227
228
229
230
231
Capital Flows
232
233
Table 4.19 Aggregate Net Resource Flows from All Sources
234
External Indebtedness
235
Table 4.21 Total External Debt of Developing Member Economies (% of GNI) 236
Table 4.22 Total External Debt of Developing Member Economies
(% of exports of goods, services, and income) 237
238
Table 4.24 Total Debt Service Paid by Developing Member Economies
(% of exports of goods, services, and income) 239
Tourism
240
241
242
Transport
Table 5.1 Road Indicators: Network 247
248
Table 5.3 Road Indicators: Safety 249
Table 5.4 Rail Indicators 250
Electricity
251
252
253
254
Energy
258
259
Table 6.3 Energy Imports, Net (% of energy use) 260
Table 6.4 Energy Use (kilotons of oil equivalent) 261
Environment
Table 6.5 Agriculture Land Use (% of land area) 262
263
265
Government Finance
Table 7.1 Fiscal Balance (% of GDP) 271
Table 7.2 Tax Revenue (% of GDP) 272
Table 7.3 Total Government Revenue (% of GDP) 273
Table 7.4 Total Government Expenditure (% of GDP) 274
275
Table 7.6 Government Expenditure on Health (% of GDP) 276
Table 7.7 Government Expenditure on Social Security and Welfare (% of GDP) 277
Governance
Table 7.8 Doing Business Start-Up Indicators 278
279
125
126
128
129
130
156
156
157
Figure 2.4 Real GDP Growth, 2010 and 2011 (%) 158
159
159
159
159
160
160
161
161
162
Figure 3.1 Percentage Growth of Money Supply, 2010–2011 (annual percentage change) 187
188
Figure 3.3 Nominal and Ex-post Real Interest Rates on Short Term Treasury Bills, 2011 188
Figure 3.4 Bank Non-performing Loans, 2009–2011 (% of total gross loans) 188
190
Figure 3.6 All Items and Food Price Indices, 2011 (annual percentage change) 191
211
212
212
212
213
Contents
213
213
214
Figure 4.9 External Debt as a Percentage of GNI, 2000 and 2010 214
242
243
243
244
Figure 5.5 Sources of Electricity (Top Producers), 2009 244
244
245
245
Figure 6.1 Percentage Breakdown of Energy Use by Region, 2009 (kilotons of oil equivalent) 254
Figure 6.2 Net Energy Imports as a Percentage of Energy Use, 2007–2009 255
Figure 6.3 Percentage Change in GDP per Unit of Energy Use between 2000 and 2009 255
257
Figure 7.1 Fiscal Balance as a Percentage of GDP, 2010 and 2011 265
Figure 7.2 Tax Revenue as a Percentage of GDP, 2010 and 2011 266
Figure 7.3 Total Government Expenditure as a Percentage of GDP, 2010 and 2011 266
and Social Security Welfare as a Percentage of GDP, 2011 267
Figure 7.5 Cost of Business Start-up Procedure (% of GNI per capita) 267
Figure 7.6 Days Required to Start Up Business, 2006 and 2011 268
Figure 7.7 Time and Cost Required to Start a Business, 2011 269
269
129
Table 1.2 Human Development Index, 2011 132
127
131
133
189
191
256
127
131
133
256
189
191
Box Table 3.3 Food Weights in CPI 191
Millennium Development Goals 283
Regional Trends and Tables 293
Statistical Partners
would not have been possible without
quality of life of people around the region.
Da Afghanistan Bank
Armenia Central Bank of Armenia
Australia Australian Bureau of Agricultural and Resource Economics and Sciences
Bureau of Resources and Energy Economics
Reserve Bank of Australia
Azerbaijan Central Bank of the Republic of Azerbaijan
Bangladesh Bangladesh Bank
Ministry of Finance
Bhutan Ministry of Finance
Ministry of Labor and Human Resources
Royal Monetary Authority of Bhutan
Ministry of Finance
Cambodia Ministry of Economy and Finance
Ministry of Finance and Economic Management
Reserve Bank of Fiji
Georgia Ministry of Finance of Georgia
Hong Kong Monetary Authority
Ministry of Finance
Reserve Bank of India
Indonesia Bank Indonesia
Ministry of Energy and Mineral Resources
PT Pertamina (Persero)
Ministry of Agriculture, Forestry and Fisheries
Ministry of Economy, Trade and Industry
Ministry of Finance
Korea, Republic of Bank of Korea
Ministry of Strategy and Finance
Ministry of Finance
Malaysia Bank Negara Malaysia
Ministry of Finance
Maldives Monetary Authority
Ministry of Finance and Treasury
Development Assistance and Compact Management
Mongolia Bank of Mongolia
Nauru Ministry of Finance and Economic Planning
Ministry of Finance
Nepal Rastra Bank
Ministry of Finance
State Bank of Pakistan
Palau Bureau of Budget and Planning, Ministry of Finance
Papua New Guinea Bank of Papua New Guinea
Department of Treasury
Philippines Bangko Sentral ng Pilipinas
Bureau of Local Government Finance
Bureau of the Treasury
Department of Budget and Management
Department of Energy
Central Bank of Samoa
Economic Policy and Planning Division, Ministry of Finance
Singapore Economic Development Board
Ministry of Finance
Ministry of Manpower
Monetary Authority of Singapore
Solomon Islands Central Bank of Solomon Islands
Sri Lanka Central Bank of Sri Lanka
Taipei,China Central Bank of China
Council for Economic Planning and Development
Ministry of Finance
Thailand Bank of Thailand
Ministry of Finance
Timor-Leste Central Bank of Timor-Leste (formerly Banking and Payments Authority of
Timor-Leste)
Ministry of Finance
Uzbekistan Cabinet of Ministers, Government of Uzbekistan
Central Bank of Uzbekistan
Ministry of Finance of the Republic of Uzbekistan
Economic Management)
Ministry of Finance
CEIC Data Company Ltd.
United States Census Bureau
World Bank
Guide for Users
The
Part II comprises tables on indicators for the Millennium Development Goals (MDGs). The indicators are presented
Key Indicators
includes as many of the indicators for the new targets as possible. The tables contain indicators associated with
each MDG target.
and Governance. Each theme is further divided into subtopics. The tables contain indicators related to a subtopic.
The MDGs and themes in Parts II and III start with a brief analysis of key trends of selected indicators. The
Development Bank (ADB). The term “country,” used interchangeably with “economy,” is not intended to make any
judgment as to the legal or other status of any territory or area. The 48 economies have been broadly grouped into
regional members of ADB, both developing and developed. Indicators are shown for the most recent year or period for
which data are available and, in most tables, for an earlier year or period (usually 1990 or 1995).
Data for the MDG indicators, regional trends and tables, and country tables are obtained mainly from two sources:
to impute the missing data.
Fiscal Year
.
Afghanistan 21 March 2011–20 March 2012 2011
Hong Kong, China
India
Myanmar
Singapore
Australia
Bangladesh
Bhutan
2011
Pakistan
Samoa
Tonga
Micronesia, Federated States of
Palau
Thailand
Key Symbols
– Magnitude equals zero
0 or 0.0 Magnitude is less than half of unit employed
| Marks break in series
< Less than
Greater than or equal to
<
Less than or equal to
na Not applicable
Measurement Units
kg kilogram
km kilometer
kt kiloton
Abbreviations and Acronyms
ADB Asian Development Bank
BRT bus rapid transit
CIF cost, insurance, and freight
CNG compressed natural gas
2
carbon dioxide
CPI consumer price index
EFB empty fruit bunches
EKC Environmental Kuznets Curve
FDI foreign direct investment
GHG greenhouse gas
GPI gender parity index
GRUMP Global Rural Urban Mapping Project
HDI human development index
KILM Key Indicators of the Labour Market
LCU local currency unit
LDC least developed countries
Ln natural logarithm
MDG Millennium Development Goal
NPL non-performing loan
PLI price level index
PM
10
PPP purchasing power parity
TB tuberculosis
US United States
WDI World Development Indicators
WDPA World Database on Protected Areas

