Báo cáo khoa học: Interactions of HIPPI, a molecular partner of Huntingtin interacting protein HIP1, with the specific motif present at the putative promoter sequence of the caspase-1, caspase-8 and caspase-10 genes pdf
Bạn đang xem bản rút gọn của tài liệu. Xem và tải ngay bản đầy đủ của tài liệu tại đây (446.3 KB, 14 trang )
Interactions of HIPPI, a molecular partner of Huntingtin
interacting protein HIP1, with the specific motif present at
the putative promoter sequence of the caspase-1, caspase-8
and caspase-10 genes
P. Majumder1, A. Choudhury2, M. Banerjee1, A. Lahiri2 and N. P. Bhattacharyya1
1 Structural Genomics Section, Saha Institute of Nuclear Physics, Bidhan Nagar, Kolkata, India
2 Department of Biophysics, Molecular Biology and Genetics, University of Calcutta, Kolkata, India
Keywords
caspase; HIPPI; motif; pDED; transcription
regulation
Correspondence
N. P. Bhattacharyya, Structural Genomics
Section, Saha Institute of Nuclear Physics,
1 ⁄ AF Bidhan Nagar, Kolkata 700 064, India
Fax: +91 033 2337 4637
Tel: +91 033 2337 5345
E-mail:
(Received 11 April 2007, revised 1 June
2007, accepted 5 June 2007)
doi:10.1111/j.1742-4658.2007.05922.x
To investigate the mechanism of increased expression of caspase-1 caused
by exogenous Hippi, observed earlier in HeLa and Neuro2A cells, in this
work we identified a specific motif AAAGACATG () 101 to ) 93) at the
caspase-1 gene upstream sequence where HIPPI could bind. Various mutations in this specific sequence compromised the interaction, showing the
specificity of the interactions. In the luciferase reporter assay, when the
reporter gene was driven by caspase-1 gene upstream sequences () 151 to
) 92) with the mutation G to T at position ) 98, luciferase activity was
decreased significantly in green fluorescent protein–Hippi-expressing HeLa
cells in comparison to that obtained with the wild-type caspase-1 gene
60 bp upstream sequence, indicating the biological significance of such
binding. It was observed that the C-terminal ‘pseudo’ death effector
domain of HIPPI interacted with the 60 bp () 151 to ) 92) upstream
sequence of the caspase-1 gene containing the motif. We further observed
that expression of caspase-8 and caspase-10 was increased in green fluorescent protein–Hippi-expressing HeLa cells. In addition, HIPPI interacted
in vitro with putative promoter sequences of these genes, containing a similar motif. In summary, we identified a novel function of HIPPI; it binds to
specific upstream sequences of the caspase-1, caspase-8 and caspase-10
genes and alters the expression of the genes. This result showed the motifspecific interaction of HIPPI with DNA, and indicates that it could act as
transcription regulator.
It has been known for more than 13 years that
increased CAG repeats beyond position 36 in exon1 of
the Huntingtin (Htt) gene causes Huntington’s disease
[1], resulting in increased apoptosis in a specific region
of the brain [2]. Among various interacting partners of
the protein Htt [3–5], Huntingtin interacting protein 1
(HIP1), identified in the yeast two-hybrid assay [6] and
subsequently characterized as an endocytic adaptor
protein with clatharin assembly activity, binds to
various cytoskeleton proteins [7]. In the search for
interacting partners of HIP1, a novel protein HIPPI
(HIP1 protein interactor) has recently been identified.
HIPPI does not have any known domains except for a
‘pseudo’ death effector domain (pDED) and a myosinlike domain. Interaction of HIPPI with HIP1 takes
place through the pDED present in both proteins. The
HIPPI–HIP1 heterodimer recruits procaspase-8, and
activates the initiator caspase and its downstream
Abbreviations
DED, death effector domain; EMSA, electrophoretic mobility shift assay; GFP, green fluorescent protein; GST, glutathione S-transferase;
HD, Huntington’s disease; HIP1, Huntingtin interacting protein 1; HIPPI, Huntingtin interacting protein 1 protein interactor; Htt, Huntingtin;
IOD, integrated optical density; pDED, ‘pseudo’ death effector domain; TSS, transcription start site.
3886
FEBS Journal 274 (2007) 3886–3899 ª 2007 The Authors Journal compilation ª 2007 FEBS
P. Majumder et al.
apoptotic cascades [8,9]. It has been shown earlier that
the interaction of HIP1 with normal Htt (a protein with
fewer than 36 Gln) is stronger than that observed with
the mutated Htt (a protein with more than 36 Gln residues) [10]. On the basis of this observation, it has been
proposed that the weaker interaction of HIP1 with
mutated Htt in Huntington’s disease (HD) may
increase the amount of freely available HIP1 and
enhance the propensity for the HIP1–HIPPI heterodimer to form. The increased amount of HIP1–HIPPI
may in turn lead to the increase in cell death observed
in HD [8]. A role of HIPPI in apoptosis regulation has
also been inferred from other studies. Apoptin, a
chicken anemia virus-encoded protein, has been shown
to colocalize with HIPPI in the cytoplasm of normal
cells, whereas in tumor cells the two proteins localize
separately in the nucleus and cytoplasm. It has been
proposed that the HIPPI–apoptin interaction may
suppress apoptosis [11]. The bifunctional apoptosis
inhibitor, which regulates neuronal apoptosis, also
interacts with HIPPI, although the functional relevance
of this interaction remains unknown [12]. Very recently,
it has been reported that HIPPI interacts with the
postsynaptic scaffold protein Homer1c and regulates
apoptosis in striatal neurons [13]. All these studies
show that HIPPI, through its interacting partner,
regulates apoptosis. Even though the exact function of
HIPPI remains unknown, it has been shown, using
knockout mouse (Hippi– ⁄ –), that HIPPI is involved the
Sonic hedgehog signaling pathway [14].
Interactions of several transcription factors with Htt
and alterations of a large number of genes observed in
microarray studies support the hypothesis that the
pathology of HD is mediated through alterations in
transcription [15]. In several studies using cellular and
animal models of HD (where the mutated full-length
Htt gene or exon1 are expressed by knockin), the
expression of the caspase-1, caspase-3, caspase-2,
caspase-6 and caspase-7 genes is increased [16,17]. How
the expression of these genes is altered is not known.
We have previously shown that exogenous expression of Hippi increases various apoptotic markers. In
the course of this study, it was also observed that the
endogenous expression of caspase-1, caspase-3 and
caspase-7 is upregulated in green fluorescent protein
(GFP)–Hippi-expressing cells, whereas the mitochondrial genes ND1 and ND4 and the antiapoptotic gene
Bcl-2 are downregulated [9]. Recently, we have also
shown that HIPPI can directly interact with the caspase-1 gene upstream 60 bp sequence () 151 to ) 92)
in vitro and in vivo [18]. In the present investigation,
we identified and characterized a motif within this
60 bp sequence of the caspase-1 gene where HIPPI
Role of HIPPI as a transcription regulator
could bind specifically. In addition, we observed that a
similar motif was present at the putative promoter
sequences of the caspase-8 and caspase-10 genes; the
expression of these genes was also increased in GFP–
Hippi-expressing HeLa cells. In vitro experiments
showed that HIPPI also interacted with the promoter
sequences of these genes.
Results
Specific motif at the upstream sequences
of the caspase-1 gene
To search for the specific DNA sequence motif where
HIPPI might interact, we analyzed 1 kb upstream
regions of the caspase-1, caspase-3 and caspase-7 genes
using four different motif prediction algorithms, i.e.
meme, alignace, bioprospector and mdscan. The
motifs predicted using the different methods, parameters and sequence sets (masked ⁄ unmasked) were then
assembled and compared, and the redundant motifs
were discarded (data not shown). The motif predicted using the methods mentioned was 5¢-AA
AGA[CG]A[TA][GT]-3¢. We investigated whether any
similar motif was present within the 60 bp stretch of
the caspase-1 gene upstream sequence where HIPPI
actually interacted [18]. It was observed that the motif
5¢-AAAGACATG-3¢ () 101 to ) 93) was present in
the positive strand of the caspase-1 gene upstream
sequence. This motif was conserved in promoters of
caspase-1 orthologs from Pan troglodytes (DOOP ID:
83123145, ) 245 to ) 253) and Macaca mulatta (DOOP
ID: 94252893, ) 245 to ) 253). The motif sequences
of the caspase-3 gene (5¢-AAAGAGATG-3¢, ) 828 to
) 820) and the caspase-7 gene (5¢-AAAGACATA-3¢,
) 245 to ) 253) were present in the positive strand. In
subsequent studies, we tested whether HIPPI could
interact with the 5¢-AAAGACATG-3¢ () 101 to ) 93)
motif present in the putative promoter of the caspase-1
gene.
Interactions of HIPPI with AAAGACATG and
various mutants of this sequence at the
caspase-1 gene upstream sequence
The specific sequence AAAGACATG identified within
the 60 bp upstream sequence was used to test whether
HIPPI interacted with this motif. The results of a
typical electrophoretic mobility shift assay (EMSA)
experiment carried out using the above-mentioned
sequence and its mutants (mutations at the fourth, fifth
and sixth positions) are shown in Fig. 1A. A mobility
shift of the band corresponding to [32P]ATP[cP]-labeled
FEBS Journal 274 (2007) 3886–3899 ª 2007 The Authors Journal compilation ª 2007 FEBS
3887
Role of HIPPI as a transcription regulator
P. Majumder et al.
dsDNA, AAAGACATG, in the presence of glutathione S-transferase (GST)–HIPPI (Fig. 1A, panel I,
lane 3) indicated interaction of the purified protein
with the motif. No shift was observed in the presence
of GST protein only (lane 2).
EMSA with mutants of the 9 bp motif AAAGA
CATG indicated that AAAGAGATG (mutation of
the sixth nucleotide, C to G) interacted with the GST–
HIPPI, as is evident from the mobility shift of the
band corresponding to radiolabeled dsDNA in the
presence of purified protein (Fig. 1A, panel II, lanes 3
and 4). However, mutation at the fourth nucleotide
(G to T) and fifth nucleotide (A to C) affected the
interaction. In both cases, there was no shift of the
probe, as shown in lane 2 and lane 6, indicating that
GST–HIPPI did not interact with these mutated
motifs.
A similar result was also obtained in the fluorescence quenching study (Fig. 1B, panel I). With increasing amounts of dsDNA (AAAGACATG and
AAAGAGATG), the fluorescence (kemission ¼ 340 nm,
kexcitation ¼ 295 nm) of GST–HIPPI protein was
reduced and reached a plateau. The value of the
dissociation constant, determined from the plateau
region, obtained with AAAGACATG was calculated
to be 1.2 nm (Fig. 1C, panel I). A similar result was
obtained with AAAGAGATG, with a dissociation
constant of 0.3 nm (Fig. 1C, panel II). A fluorescence
quenching assay with the DNA AAAGACACG (point
mutation at the eighth position T to C of the predicted
motif mentioned above) revealed a decrease in the
intrinsic fluorescence of GST–HIPPI protein, indicating binding of the protein with this mutated motif
(Fig. 1B, panel II). The apparent dissociation constant
(Kd) of this binding was 4 nm (Fig. 1C, panel III).
However, a similar assay with AAATACATG and
AAAGCCATG did not alter the GST–HIPPI fluorescence significantly (Fig. 1B, panel I), which further
supported the results of EMSA with the same DNA
sequences, discussed before (Fig. 1A, panel II). Further
point mutations at the second (A to G), third (A to
G), seventh (A to C) and ninth (G to A) nucleotides
of the 9 bp motif AAAGACATG and a subsequent
fluorescence quenching study indicated no significant
quenching of fluorescence of GST–HIPPI in the presence of these mutants. This result revealed that GST–
HIPPI did not interact with these mutated sequences
of the 9 bp motif (Fig. 1B, panel II).
To explore the nature of the interactions of GST–
HIPPI with AAAGACATG, we increased the concentration of NaCl from 50 mm (normally used in all
binding assays) to 1000 mm. As is evident from Fig. 2,
with the increasing concentrations of NaCl, the fluor3888
escence intensities of GST–HIPPI increased, indicating
a lesser extent of interactions of GST–HIPPI with AA
AGACATG. This result indicated that the interaction
of GST–HIPPI with AAAGACATG was electrostatic
in nature, although other possibilities cannot be ruled
out.
The above results showed that purified GST–HIPPI
interacted with the 9 bp motif AAAGACATG present
at the upstream sequence () 101 to ) 93) of the caspase-1 gene, and that mutation at the sixth and eighth
positions of the motif did not affect this binding, as is
evident from the significant quenching of GST–HIPPI
protein fluorescence observed with the respective
sequences (Fig. 1B, panels I and II). A summary of
the results is shown in Table 1. From the experimental
studies described above with the various mutant motifs
and their interactions in vitro with HIPPI, the consensus HIPPI-binding motif AAAGASAHK, i.e. AAAG
A[GC]A[ATC][TG], was derived.
Reduction of the promoter activity of the 60 bp
()151 to ) 92) caspase-1 gene upstream sequence
by mutation at position ) 98 (G to T) to the
specific motif AAAGACATG ()101 to ) 93) in
GFP–Hippi-expressing cells
We have earlier shown that the 717 bp () 700 to
+ 17) and 60 bp () 151 to ) 92) sequences can act as
the promoter in the luciferase reporter assay in HeLa
as well as in Neuro2A cells. It has been shown that the
luciferase activity of pGL3 when driven by the 717 bp
caspase-1 gene upstream sequence is higher than that
obtained with the 60 bp-driven construct [18]. This has
been attributed to the presence of binding sites for
other factors within these flanking sequences [19]. As
shown above, the 60 bp upstream sequence contains
the motif AAAGACATG () 101 to ) 93), and mutation at position ) 98 (G to T) abolished the interaction
of HIPPI. To check whether this mutation also decreases the expression of the reporter gene driven by this
mutated 60 bp caspase-1 gene upstream sequence
in vivo, we carried out the luciferase assay after cloning
both the wild-type 60 bp sequence and the mutated
60 bp sequence in pGL3. The luciferase activity, seen
in GFP–Hippi-expressing HeLa cells when the luciferase gene was driven by the 60 bp region with a
mutation at position ) 98 (G to T), was decreased
(Fig. 3) significantly (P ¼ 0.01) in comparison with
that obtained with the wild-type 60 bp sequence. The
result of this experiment is shown in Fig. 3, and indicates that mutation of the specific site of the binding
motif at the putative promoter sequence of the
caspase-1 gene, where HIPPI can bind, decreased the
FEBS Journal 274 (2007) 3886–3899 ª 2007 The Authors Journal compilation ª 2007 FEBS
P. Majumder et al.
Role of HIPPI as a transcription regulator
1
A
2
3
shifted
band
1
shifted
band
2
3
I
B
6
II
AAAGAGATG
AAAGACATG
AAAGCCATG
AAATACATG
8.00E+007
16
14
Fluoriscence340
1.00E+008
Fluoriscence340
5
Probe
(9 bp)
Probe
AAAGACATG
6.00E+007
4.00E+007
2.00E+007
0.00E+000
0.00
4
0.01
0.02
0.03
0.04
10
8
6
4
0.00
0.05
AAGGACATG
AGAGACATG
AAAGACCTG
AAAGACACG
AAAGACATA
12
0.02
0.06
0.04
[DNA]µM
I
0.08
[DNA]µM
II
C
AAAGAGATG
1.50E-008
1.10E-008
1.30E-008
1/ΔF
1.30E-008
1.20E-008
1.28E-008
1.00E-008
25
50
75
100
0.100
0.095
0.090
0.085
1.26E-008
0
AAAGACACG
Kd=4 nM
0.105
Kd=1.2 nM
1/ΔF340
1/ΔF340
0.110
Kd=0.29 nM
1.32E-008
AAAGACATG
1.40E-008
20 25 30 35 40 45 50
1/[DNA]µM
I
1/[DNA]µM
II
0.080
0
11
22
33
44
55
1/[DNA]µM
III
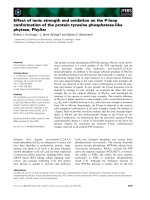
Fig. 1. In vitro binding assay of putative HIPPI-binding motif AAAGACATG and its mutant. (A) EMSA of binding of the end-labeled 9 bp motif
AAAGACATG and two of its mutants with purified GST–HIPPI protein. Panel I. Lane1: probe (200 nM of [32P]ATP[cP]-labeled 9 bp motif
AAAGACATG) only. Lane 2: probe + 4 lM GST protein. Lane 3: probe + 1.7 lM GST–HIPPI. Panel II. Typical results of similar analysis with
the same 9 bp DNA with mutation at the fourth, fifth or sixth base and GST–HIPPI protein are shown. Lane 1: 200 nM [32P]ATP[cP]-labeled
AAATACATG (probe only). Lane 2: 200 nM same probe + 3.8 lM GST–HIPPI protein. Lane 3: band corresponding to 200 nM [32P]ATP[cP]labeled AAAGAGATG (probe only). Lane4: 200 nM probe + 3.8 lM GST–HIPPI protein. Lane 5: AAAGCCATG (probe only). Lane 6: result
obtained with 200 nM same probe + 3.8 lM GST–HIPPI protein. (B) Quenching of intrinsic fluorescence of GST–HIPPI (0.8 lM) at 340 nm
(kexc ¼ 295 nm) in the presence of the 9 bp putative motif sequence and six of its mutants. Panel I. Fluorescence quenching of GST–HIPPI
protein due to addition of AAAGACATG (red line) and its mutants: AAAGAGATG (black line), AAAGCCATG (green line), AAATACATG (blue
line). Inset: Curves representing wavelength scan of each point of quenching experiment with the 9 bp motif sequence AAAGACATG. Fluorescence intensities were measured in a Fluoromax 3 spectrofluoremeter. Panel II. Study of any quenching of intrinsic fluorescence of GST–
HIPPI due to addition of point-mutated sequences of the 9 bp potent HIPPI-binding motif, namely: AAGGACATG (black line), AGAGACATG
(red line), AAAGACCTG (green line), AAAGACACG (blue line) and AAAGACATA (sky blue line). Positions of point mutations are indicated by
underlines. (C) Linear plot of 1 ⁄ DF versus 1 ⁄ c, where as DF is the change in fluorescence with respect to the intrinsic fluorescence of GST–
HIPPI due to addition of DNA with concentration c (lM). Kd values were calculated from such plots. In panel I, DF is of GST–HIPPI versus c
of 9 bp motif sequence AAAGACATG. In panel II and panel III, DF is of GST–HIPPI versus c of mutated products of 9 bp sequence: AAAGA
GATG and AAAGACACG, respectively.
promoter activity of the 60 bp upstream sequences significantly. As shown above, the interaction of HIPPI
with the mutated 9 bp motif (G to T at the fourth
position of the motif) was abolished, whereas the
60 bp sequence with the mutated motif exhibited substantial promoter activity. This could be due to addi-
tional transcription regulator-binding sites within the
flanking sequence of the motif. It has been shown that
p53 can bind within this region [19]. The luciferase
activity of the pGL3 driven by the mutated 60 bp
caspase-1 gene upstream sequence in GFP–Hippiexpressing HeLa cells was similar (3.0 ± 1.1) to that
FEBS Journal 274 (2007) 3886–3899 ª 2007 The Authors Journal compilation ª 2007 FEBS
3889
Role of HIPPI as a transcription regulator
P. Majumder et al.
8
GST-Hippi 25µg + AAAGACATG 0.05 µ M
Fluorescence340
14000000
12000000
10000000
8000000
6000000
4000000
2000000
0
200 400 600 800 1000
[NaCI]mM
Fig. 2. (A) Sigmoidal curve (R2 ¼ 0.924) showing gradual increase
in fluorescence intensity of GST–HIPPI (0.8 lM) at 340 nm (kexc ¼
295 nm) at saturation level of binding with the 9 bp motif AAAGACATG with increasing salt (NaCl) concentrations ranging from
50 mM to 1 M.
Table 1. Summary of binding study with the putative HIPPI-binding
motif and its mutants. ND, not determined.
Fluorescence quenching
Sequence
EMSA
Result
Average Kd (nM)
AAAGACATG
AGAGACATG
AAGGACATG
AAATACATG
AAAGCCATG
AAAGAGATG
AAAGACCTG
AAAGACACG
AAAGACATA
+
ND
ND
–
–
+
ND
ND
ND
+
–
–
–
–
+
–
+
–
0.25
1.5
p=0.01
7
6
5
4
3
2
1
0
60_HI
60M_HI
Fig. 3. The caspase-1 gene upstream 60 bp and a point mutation
(G to T) incorporated in the same sequence at position ) 98, cloned
in the pGL3 enhancer plasmid (60 M) and transfected (4 lg each) in
GFP–Hippi-expressing cells. Cells expressing GFP–Hippi were monitored by the presence of GFP under a fluorescence microscope.
About 80–90% of cells expressed GFP after 20 h of transfection
with GFP–Hippi. Transfected cells are denoted as 60_Hi and
60 M_Hi, respectively. The corresponding average fold increase
(n ¼ 3) in luciferase activities compared to control (cell expressing
only pGL3 without any insert) are given in bar diagrams. P-values
of significance are mentioned above the bar diagram in each of the
cases studied.
caspase-1 in GFP–Hippi-expressing cells was due to
interaction of HIPPI with this motif.
4
observed in HeLa cells (without any detectable HIPPI
expression) when the luciferase gene was driven by the
60 bp wild-type sequence (1.2 ± 1.3). The difference
was not statistically significant (P ¼ 0.4). Furthermore,
there was no significant difference (P ¼ 0.6) between
the luciferase activities in HeLa cells expressing pGL3
driven either by the 60 bp wild-type sequence
(1.2 ± 1.3) or the 60 bp mutated (1.7 ± 0.9) sequence.
Thus, these luciferase activities could be due to the
presence of promoter-binding site(s) within the 60 bp
caspase-1 gene upstream sequence other than for
HIPPI. This indicated that, due to point mutation
at position 98 (G to T), HIPPI could not bind to the
caspase-1 gene upstream to transcribe the downstream
gene; this was manifested by about a two-fold decrease
in luciferase acitivity. Thus, the results of promoter
assay experiments further confirmed the in vitro result
that mutation of the motif abolished the binding of
HIPPI to the specific sequence of the caspase-1 gene
upstream sequence, and the increased expression of
3890
Fold increase in chemiluminiscence
R2=0.92422
16000000
Interaction of pDED of HIPPI with upstream
sequences of the caspase-1 gene
To check which portion of HIPPI was responsible for
this interaction, a cDNA portion corresponding to the
two termini of HIPPI, i.e. the N-terminal portion comprising amino acid residues 10–334 (NCBI protein ID
NP_060480) and the C-terminal pDED region (amino
acids 335–429), were cloned and expressed in bacteria,
and the proteins were purified. Interactions of the purified 6X(HN)-pDED and the N-terminal domains of
HIPPI [also tagged with 6X(HN)] were studied in vitro
by EMSA and fluorescence quenching. The results
revealed that the 6X(HN)-pDED domain of HIPPI
interacted with the 60 bp upstream sequence of the
caspase-1 gene (Fig. 4A, panel II, lanes 1 and 3). In
contrast, the N-terminal region of HIPPI did not interact with the upstream sequence of the caspase-1 gene
(Fig. 4A, panel I, lane 3). This result showed that the
C-terminal end containing the pDED domain of
HIPPI could interact with the upstream sequence of
the caspase-1 gene.
FEBS Journal 274 (2007) 3886–3899 ª 2007 The Authors Journal compilation ª 2007 FEBS
P. Majumder et al.
Role of HIPPI as a transcription regulator
A
1
1
shifted
band
2
3
labeled
Casp1
ups 717 bp
labeled
Casp1ups
60 bp
I
C1ups 717bp (HIPPI-pDED)
C1ups 717bp (HIPPI-Nterm)
C1ups 60bp (HIPPI-pDED)
9
8
7
6
5
4
3
2
1
0
0.00
0.21
4
II
C1ups 60bp (6XHN-HIPPI_pDED)
Kd=0.34nM
0.20
1/ΔF
Fluorescence305
B
2 3
shifted
band
0.19
0.18
0.01
0.02
I
0.03
0.04
0.17
0 20 40 60 80100 120 140
II
Fig. 4. (A) In vitro binding assay of pDED of HIPPI with the caspase-1 gene upstream sequences. In panel I, typical results of
EMSA with the 717 bp caspase-1 probe and 6X(HN)-pDED of Hippi
and 6X(HN)-tagged N-terminal domain of Hippi protein are shown.
Lane 1 shows the result with the probe only (400 nM). Lanes 2 and
3 show results obtained when 400 nM probe was allowed to interact with 2.7 lM 6X(HN)-pDED of HIPPI and 5.2 lM 6X(HN)-tagged
N-terminal domain of HIPPI, respectively. In panel II, 500 nM 60 bp
caspase-1 gene upstream sequence () 151 to ) 92) labeled with
[32P]dCTP[aP] was used as probe. Lanes 1 and 2 show results
obtained with probe only and probe + 4.8 lM BSA (nonspecific protein), respectively. Lane 3 shows the result when 500 nM probe
was allowed to react with 1.6 lM 6X(HN)-pDED of HIPPI, and lane
4 shows the result obtained when 500 nM labeled 60 bp probe was
allowed to react with 1.6 lM 6X(HN)-pDED protein in the presence
of 500 nM unlabeled 60 bp caspase-1 gene upstream sequence. (B)
Panel I, quenching of intrinsic fluorescence of 6x(HN)-tagged pDED
of HIPPI (pDED-HIPPI, 2 lM) at 305 nm in presence of the 717 bp
(squares) and 60 bp (triangles) upstream sequences of the caspase-1 gene (denoted as C1ups 717 bp and C1ups 60 bp, respectively) and any change in intrinsic fluorescence of 6x(HN)-tagged Nterminal domain of HIPPI (HIPPI-Nterm, 1 lM) at 305 nm in the
presence of 717 bp upstream sequence of the caspase-1 gene,
denoted by circles. Panel II shows a linear plot of 1 ⁄ DF versus 1 ⁄ c
where, DF represents the decrease in intrinsic fluorescence of
6x(HN)-tagged HIPPI-pDED protein in the presence of the 60 bp
upstream sequence of the caspase-1 gene; c, concentration (lM).
The apparent binding constant (Kd) was calculated from this plot
and is given with the graph.
As 6X(HN)-pDED of HIPPI does not contain any
tryptophan, a 280 nm excitation filter was used, and
the fluorescence (characteristics of tyrosine and phenylalanine) was measured at 305 nm. A decrease in
the fluorescence intensity of 6X(HN)-pDED due to
the addition of the 60 bp region of the caspase-1 gene
upstream sequence was observed. Addition of the
caspase-1 gene upstream 60 bp sequence could also
quench the intrinsic fluorescence of 6X(HN)-pDED of
HIPPI from 6.997 to 1.802 (Fig. 4B, panel I) with an
apparent binding constant (Kd) 0.34 nm; a double
reciprocal plot is shown in Fig. 4B, panel II.
However, addition of the upstream sequences of the
caspase-1 gene (717 bp) to the N-terminal domain
(without the pDED domain) of HIPPI did not
decrease the fluorescence intensities determined by
exciting either at 295 nm (kem ¼ 340 nm; fluorescence
intensity changed from 15.62 to 14.42 due to addition
of 0.5 lm DNA) or 280 nm (kem ¼ 305 m; fluorescence intensity changed from 8.77 to 7.59). This result
also showed that pDED of HIPPI actually interacted
with the caspase-1 gene upstream sequences. We
recently observed that pDED of HIPPI could also
interact in vivo with the caspase-1 gene upstream
sequence (data not shown).
Increase in caspase-1 gene expression and
induction of apoptosis by C-terminal pDED
of HIPPI
The role played by pDED of HIPPI in alteration of
caspase-1 gene expression in HeLa cells was monitored
by western blot analysis using antibody to caspase-1
(Fig. 5, middle panel). The band intensities were
measured using image master vds software. The average integrated optical density (IOD) of three different
experiments is shown in Table 2. The results indicated
that caspase-1 expression, as detected by western blot
Fig. 5. Role of exogenous pDED of HIPPI in alteration of caspase-8
and caspase-1 activation in HeLa cells. Western blot analysis using
antibodies to caspase-8 (upper panel) and caspase-1 (middle panel)
with total protein isolated from HeLa cells (H), HeLa cells expressing GFP-tagged N-terminus of HIPPI containing Myosin-like
domain (HiN), and that expressing GFP-tagged pDED of HIPPI
(HiD). The upper bands of the upper panel correspond to procaspase-8 (57 kDa), and the lower bands represent the 12 kDa activated caspase-8; the upper bands of the middle panel correspond to
procaspase-1 (45 kDa), and the lower bands correspond to the
20 kDa activated caspase-1. The lowermost panel shows the level
of b-actin (14.4 kDa).
FEBS Journal 274 (2007) 3886–3899 ª 2007 The Authors Journal compilation ª 2007 FEBS
3891
Role of HIPPI as a transcription regulator
P. Majumder et al.
Table 2. Comparison of apoptosis induction and alteration in caspase-1 gene expression in GFP-tagged pDED of HIPPI and N-terminal
domain of HIPPI-expressing HeLa cells.
Endpoints
Caspase-1
expression
Nuclear
fragmentation
Caspase-8
activation
Caspase-1
activation
Caspase-3
activation
HeLa
8.9 ± 2.6
2.4 ± 0.9
9.2 ± 2.0
40.4 ± 3.6
1.5 ± 0.3
GFP–pDED
of HIPPI (fold)
54.9 ± 2.1
(6.2-fold)
32.5 ± 1.8
(13.5-fold)
23.1 ± 1.3
(2.5-fold)
90.2 ± 11.1
(2.2-fold)
10.8 ± 2
(7.2-fold)
P-values
GFP–N-terminus
of HIPPI (fold)
P-values
0.0001
12.5 ± 3.9
0.3
0.0001
0.0002
0.0005
17.6 ± 1.9
(7.3-fold)
14.8 ± 4.9
0.0002
57.2 ± 10.4
0.06
0.001
5.1 ± 2.2
(3.4-fold)
0.048
analysis, was increased in GFP–pDED-expressing cells
by 4.4 ± 0.7-fold as compared to that in parental
HeLa cells. However, this increase in the N-terminal
part of HIPPI-expressing cells was only 1.4-fold. The
increase in caspase-1 expression was again 6.2 ± 1.1fold in pDED HIPPI-expressing cells as compared to
the N-terminal part of HIPPI-expressing cells.
To test whether the C-terminal pDED of HIPPI
could induce apoptosis more efficiently than the N-terminal domain in our system, these two domains cloned
in pEGFP C1 vectors were transfected into HeLa cells.
After 32 h, when 80–90% of cells were expressing
GFP-tagged protein, we determined the nuclear fragmentation as an indication of apoptosis induction and
caspase activation. GFP–pDED-expressing cells exhibited nuclear fragmentation in 32.5 ± 1.8% of the total
cell population, whereas this value in the GFP-tagged
N-terminal domain of HIPPI-expressing cells was only
17.6 ± 1.9%. This difference was statistically significant (P ¼ 0.0006). Thus, GFP–pDED of HIPPI was
more effective in inducing apoptosis in HeLa cells.
Fluorometric determination of caspase-1 activity by a
commercially available kit indicated that, in GFP–
pDED of HIPPI-expressing cells, caspase-1 activity
was 1.6-fold higher (P ¼ 0.02) than that observed in
the GFP–N-terminal domain of HIPPI-expressing
HeLa cells. Fluorometric determination of caspase-8
activity indicated that in HeLa cells expressing GFP–
pDED of HIPPI, caspase-8 activation was also 1.6-fold
higher in comparison to that obtained in the GFP–Nterminal domain of HIPPI-expressing cells. This value
was also statistically significant (P ¼ 0.047, n ¼ 3).
Activation of caspase-1 and caspase-8 in GFP–pDEDexpressing cells was further supported by western blot
analysis (Fig. 5) using total protein isolated from HeLa
cells expressing pDED and the N-terminal domain of
HIPPI. It is evident from Fig. 5 that ectopic pDED
3892
0.1
Fold increase: pDED
versus N-terminal
domain (P-values)
4.4-fold
(0.0005)
1.8-fold
0.0006
1.6-fold
(0.047)
1.6-fold
(0.02)
2.1-fold
(0.03)
expression in HeLa cells induced cleavage of procaspase-8 (Fig. 5, upper panel) and procaspase-1 (Fig. 5,
middle panel) proteins more efficiently as compared to
that of the N-terminal domain of HIPPI. A similar
higher activation (2.1-fold, P ¼ 0.03) of caspase-3 was
observed in GFP–pDED of HIPPI-expressing cells in
comparison to that observed in GFP-–N-terminal
HIPPI-expressing HeLa cells. These results are shown
in Table 2.
Presence of the motif and the putative promoter
sequences of caspase-8 and caspase-10 increased
expression of the genes in GFP–Hippi-expressing
HeLa cells
The derived motif AAAGASAHK, i.e. AAAGA[GC]
A[ATC][TG], was used to search for the presence of
the motif at the 1000 bp upstream sequences of the
caspase-8 and caspase-10 genes using motiflocator
( />html). These genes are supposed to be involved in HD.
The results for similar motifs identified in the caspase-1
(for reference) caspase-3, caspase-7, caspase-8 and
caspase-10 genes are shown in the Table 3. In Table 3,
the start and end positions of the motifs are indicated
by distance from the transcription start site (TSS). The
position upstream of the TSS of any gene is denoted
by ‘–’ followed by the distance from the TSS. In the
caspase-8 gene, the putative upstream sequence motifs
AAAGAGAAC () 955 to ) 963) in the positive
strand, and AAAGAAAAG () 418 to ) 410) and AA
AGACATA () 800 to ) 808) in the negative strand,
were observed (variants are underlined). As shown
above, mutation at the last base, G to A, abolished
the interaction of HIPPI, so the last motif would not
interact with HIPPI. The other two motifs might be
the target of HIPPI. In the upstream sequence of the
FEBS Journal 274 (2007) 3886–3899 ª 2007 The Authors Journal compilation ª 2007 FEBS
P. Majumder et al.
Role of HIPPI as a transcription regulator
Table 3. Summary of the presence of similar motifs in caspase-1, caspase-3, caspase-7, caspase-8 and caspase-10 gene upstream
sequences.
Sequence name
Strand
Start
End
Match type
Motif sequence
ENSG00000137752
Caspase-1
ENSG00000164305
Caspase-3
ENSG00000165806
Caspase-7
ENSG00000064012
Caspase-8
+
–
–
–
–
–
+
–
–
+
–
–
–
)
)
)
)
)
)
)
)
)
)
)
)
)
) 93
) 667
) 806
) 793
) 347
) 307
) 955
) 800
) 410
) 254
) 643
) 717
) 849
Consensus
Allowing one substitution
Consensus
Consensus
Allowing one substitution
Allowing one substitution
Allowing two substitutions
Allowing one substitution
Allowing two substitutions
Allowing one substitution
Allowing two substitutions
Allowing two substitutions
Allowing one substitution
AAAGACATG
AAAGACAGG
AAAGAGATT
AAAGAGATG
AAAGACATA
AAAGACATA
AAAGAGAAC
AAAGACATA
AAAGAAAAG
AAACAGATG
AAAGAAAAG
AAAGAAAAG
GAAGACATT
ENSG00000003400
Caspase-10
101
675
814
801
355
315
963
808
418
262
651
725
857
caspase-10 gene, four variant motifs were identified.
Among them, AAACAGATG () 254 to ) 262) is
present in the positive strand, and the sequences AA
AGAAAAG () 651 to ) 643), AAAGAAAAG () 725
to ) 717) and GAAGACATT () 849 to ) 857) are present in the negative strand.
Given that the caspase-8 and caspase-10 genes harbor similar motifs as that in the caspase-1 gene and
increase caspase-1 expression, we first tested the
expression of the caspase-8 and caspase-10 genes in
GFP–Hippi-expressing cells by the semiquantitative
RT-PCR described previously [18]. The numbers of
PCR cycles and the amount of total RNA were chosen
A
so that the yield of RT-PCR products was in the linear
range. The IOD value of the RT-PCR product
obtained with RNA isolated from GFP–Hippi-expressing HeLa cells was increased 2.5-fold in comparison
to the value obtained when RNA from the HeLa cells
was used. This increase was statistically significant
(P ¼ 0.0004). A similar significant increase in the IOD
value of the RT-PCR products for the caspase-10 gene
(1.8-fold, P ¼ 0.0002) was detected. A bar diagram
showing the mean IOD of bands corresponding to
caspase-8 and caspase-10 gene-specific products run on
1.5% agarose gel is shown in Fig. 6A). A representative photograph of the RT-PCR products run on
B
Fig. 6. (A) Bar diagrams showing mean of IOD of bands obtained by RT-PCR at caspase-8 and caspase-10 loci, along with error bars calculated on the basis of three independent experiments using mRNA isolated from GFP–Hippi-expressing (gray bar) and parental (white bars)
HeLa cells. Levels of significance (P-values) are shown on the top of the bars. (B) Picture of RT-PCR products run on 1.5% agarose gel and
stained with ethidium bromide, representing PCR amplification with RNA isolated from HeLa cells (lane 1:H), GFP–Hippi-expressing HeLa
cells (lane 2:Hi), and reaction carried out where no RNA was added (lane 3:ve). The uppermost panel shows the PCR reaction carried out
with caspase-8 (164 bp)-specific primers; the middle panel represents PCR amplification using primers specific for caspase-10 (178 bp)
genes; and the lowermost panel shows bands (315 bp) corresponding to b-actin (loading control).
FEBS Journal 274 (2007) 3886–3899 ª 2007 The Authors Journal compilation ª 2007 FEBS
3893
Role of HIPPI as a transcription regulator
P. Majumder et al.
agarose gel is shown in Fig. 6B. Equally intense signals
for internal control (b-actin gene-specific primers) were
obtained in all the cases (Fig. 6B, lowermost panel).
Fluorescence quenching assay to measure the
interactions of GST–HIPPI with the caspase-8 and
caspase-10 gene upstream sequences
Discussion
In the present work, we have shown that HIPPI interacted specifically with the motif AAAGACATG () 101
to ) 93) present in the upstream region of the caspase-1
gene in vitro. Decreased expression of the reporter gene
luciferase when driven by the 60 bp caspase-1 upstream
sequence () 151 to ) 92) containing this motif with a
mutation at position 98 position (G to T) in comparison with the wild-type 60 bp upstream sequence was
observed. The same mutation in the motif also abolished the interactions of HIPPI in vitro. In addition, we
observed that HIPPI could interact with the putative
promoter sequences of the caspase-8 and caspase-10
genes. Expression of caspase-8 and caspase-10, as
detected by semiquantitative RT-PCR, was also
increased in the GFP–Hippi-expressing HeLa cells.
The motif derived from bioinformatics analysis and
interaction studies of HIPPI with various mutants of
AAAGACATG present in the caspase-1 gene was
AAAGASAHK, i.e. AAAGA[GC]A[ATC][TG]. For
the caspase-8 gene, there are three variations in the
motif from that of the motif in the caspase-1 gene
upstream region. Our experimental data suggest that
3894
B
Casp8ups (GST-HIPPI)
Kd=0.33 nM
Kd=15 nM
0.20
1/ΔF
0.140
0.135
Casp10ups (GST-HIPPI)
0.25
0.145
1/ΔF
Expression of caspase-8 and caspase-10 increased in
GFP–Hippi-expressing cells, as described above, and
DNA sequences similar to the putative HIPPI-binding
motif were present within the 1000 bp upstream
sequences of the caspase-8 and caspase-10 genes
(Table 3). To check interactions of GST–HIPPI with
these upstream regions containing the motifs, the
caspase-8 gene upstream 710 bp () 991 to ) 282) and
caspase-10 gene upstream 768 bp () 914 to ) 147)
regions were PCR-amplified. The results, shown in
Fig. 7A, indicated quenching of GST–HIPPI intrinsic
fluorescence at 340 nm, due to addition of increasing
concentrations (0.001 lm to 0.05 lm) of the caspase-8
and caspase-10 gene upstream sequences.
Average (n ¼ 2) Kd values for binding of purified
GST–HIPPI with the caspase-8 gene (0.32 ± 0.13 nm)
and the caspase-10 gene (11 ± 3.8 nm) upstream
sequences were calculated from reciprocal plots as described previously [18], and typical cases are shown in
Fig. 7B, panel I and panel II, respectively.
Caspase10 ups + GST-Hippi
11
Caspase8 ups + GST-Hippi
10
9
8
7
6
5
4
3
2
0.00 0.01 0.02 0.03 0.04 0.05
[DNA]µM
F340
A
0.15
0.10
0.130
0.05
0.125
0 10 20 30 40 50 60 70
1/[DNA]µM
I
0.00
0
10 20 30 40 50
1/[DNA]µM
II
Fig. 7. (A) In vitro binding study of GST–HIPPI with caspase-8 gene
() 991 to ) 282) and caspase-10 gene () 914 to ) 147) upstream
sequences. The upper line (squares) represents a gradual decrease
in the intrinsic fluorescence of GST–HIPPI protein (0.8 M) at
340 nm (kex ¼ 295 nm) due to addition of the caspase-10 gene
upstream sequence. The lower line in the graph (triangles) represents a similar alteration in fluorescence intensity of GST–HIPPI
when the caspase-8 gene upstream sequence was added gradually
to it. (B) Linear plot of 1 ⁄ DF versus 1 ⁄ c, where DF represents
change in intrinsic fluorescence of GST–HIPPI due to addition of
upstream sequences from the caspase-8 (panel I) and caspase-10
(panel II) genes, and c represents final concentration (lM) of DNA
allowed to bind with the protein.
the change of C at the sixth position to G, and of T to
C at the eighth position, did not decrease the interaction, whereas a change from G to A at the ninth position compromised the interactions (Fig. 1B, panel I
and panel II). The change at the ninth position of the
motif in the caspase-8 gene upstream sequence is G to
C. As the caspase-8 gene 710 bp upstream sequence
() 991 to ) 282) was shown to interact with HIPPI, we
speculated that HIPPI interacted with the motif
AAAGAGAAC () 963 to ) 955). We could not
exclude the possibility that the other motif AAAG
AAAAG () 418 to ) 410) present in the negative
strand of the caspase-8 gene promoter interacted with
HIPPI. Further experiments are necessary to establish
this. Interaction of HIPPI with the motif AAAGA
CATA () 808 to 800) at the positive strand (the variant substitution G to A is underlined) of the caspase-8
gene was not possible, as we showed above that this
particular motif did not interact with HIPPI (Fig. 1B).
The putative HIPPI-binding motifs at the caspase-10
FEBS Journal 274 (2007) 3886–3899 ª 2007 The Authors Journal compilation ª 2007 FEBS
P. Majumder et al.
gene upstream sequences are AAACAGATG () 254 to
) 262) in the positive strand, and AAAGAAAAG
() 651 to 643), AAAGAAAAG () 725 to ) 717) and
GAAGACATT () 849 to ) 857) in the negative
strand. We were unable to exclude any of the motifs
as the target of HIPPI, as we observed that HIPPI
interacted with the putative promoter 768 bp () 914
to ) 147) sequence of the caspase-10 gene (Fig. 7B,
panel II). Further experiments are necessary to determine the specific sequences where HIPPI could interact
at the upstream sequence of this gene.
It is interesting to note that even though the initial
motif search revealed that the upstream sequence of the
caspase-7 gene contains the AAAGACATA sequence
present in duplicate within the ) 355 to ) 347 and ) 315
to 307 regions, our experiments with this motif revealed
that HIPPI did not interact with it (Fig. 1B, panel II).
Thus, the increase in caspase-7 expression in GFP–
Hippi cells [9] might not be due to the direct interaction
of HIPPI with the promoter sequence. This was further
supported by the observations that purified HIPPI did
not interact with the caspase-7 gene upstream 592 bp
sequence () 1080 to 489) in vitro (by EMSA and fluorescence quenching) or in vivo (chromatin immunoprecipitation assay using antibody to HIPPI) (data not
shown). We also failed to detect any interactions of
purified HIPPI with the caspase-3 gene upstream 652 bp
sequence () 997 to ) 346) (data not shown), even
though the exact motifs with which HIPPI could interact were present in the negative strand (Table 3) of the
gene. The reason behind this still remains obscure;
whether strand bias or the neighboring nucleotides
prevented the interaction remains to be determined.
HIPPI does not have any similarity with known proteins having DNA-binding motifs. However, it contains the pDED at the C-terminus (amino acid
residues 335–426) and a myosin-like domain. The
pDED of HIPPI shows only 34.9% similarity and
21% identity to other known death effector domains
(DEDs), and 39.2% similarity and 26.7% identity with
the pDED of HIP1. It has been shown that the interaction of HIPPI with HIP1 is mediated through the
pDED present at HIP1. The pDED differs from its
conformational neighbor DED by the presence of
charged residues at the interacting helices, as opposed
to the hydrophobic ones in the later [8]. DED-containing proteins are known to participate in diverse cellular functions, including apoptosis through receptor
signaling [20,21]. Other DED-containing proteins, such
as DEDD, are known to bind DNA and inhibit RNA
polymerase I activity in vivo [22]. Direct evidence that
the DED-containing proteins DEDD and FLAME-3
interact with the transcription factor TFIIIC102 and
Role of HIPPI as a transcription regulator
thus regulate the transcription of the target genes has
been also provided [23]. We hypothesized that the
pDED of HIPPI might have similar DNA-binding
ability to that of its distant relative DEDD.Our findings that the purified C-terminal pDED of HIPPI was
able to interact with the caspase-1 gene upstream
sequence (Fig. 4A,B), similar to what was observed
with full-length HIPPI [18], and that the exogenous
expression of cDNA corresponding to the pDED of
HIPPI alone was sufficient to increase caspase-1
expression and apoptosis (Fig. 5, Table 2) showed that
the C-terminal pDED of HIPPI contributed to the
increased expression of caspase-1 and apoptosis.
HIPPI generally resides in the cytoplasm. How this
cytoplasmic protein is transported to the nucleus
remains unknown. In an earlier study, we showed that
exogenously expressed Hippi in HeLa cells can be
detected in the nuclear fraction [Fig. 2(b) in Majumder
et al. [9]]. It can be seen that there was no detectable
endogenous expression of Hippi in HeLa cells, whereas
the expression of HIP1 was detected in HeLa cells
[Fig. 2(c), III, in Majumder et al. [9]]. Recently, transportation of androgen receptor to the nucleus has been
reported to be mediated through HIP1 [24]. On the
basis of this observation, we hypothesized that HIP1
might play similar role in the transport of HIPPI into
the nucleus. We are presently testing this hypothesis.
The role of HIPPI in HD, if any, remains unknown.
Even though the caspase-8 and caspase-10 genes have
been implicated in poly-Q-mediated toxicity [25,26], it
is not known whether the expression of these genes is
altered. The role of HIPPI in the increased expression
of caspase-1 observed in various models and HD
patients has to be established. We speculated that
excess available HIP1 in HD, due to weaker interaction of HIP1 with the mutated Htt allele, leads to the
formation of more HIPPI–HIP1 heterodimer, which in
turn increases caspase-1 expression. We were able to
immunoprecipitate the caspase-1 gene promoter by
antibody to HIPPI after crosslinking DNA protein
in vivo [18]. However, we failed to do the same thing
with antibody to HIP1 (data not shown), indicating
that HIP1 does not directly interact with the putative
promoter of the caspase-1 gene. Thus, the role of
HIP–HIPPI heterodimer formation in the increased
expression of caspase-1, caspase-8 and caspase-10 is
not clear. We speculated that it might be necessary for
transporting HIPPI into the nucleus.
In summary, together with our earlier observations
[9,18], we observed in the present work that HIPPI
interacted with the specific motif present in the putative
promoters of the caspase-1, caspase-8 and caspase-10
genes and altered the expression of these genes. The
FEBS Journal 274 (2007) 3886–3899 ª 2007 The Authors Journal compilation ª 2007 FEBS
3895
Role of HIPPI as a transcription regulator
P. Majumder et al.
presence of this motif in the promoters of other genes
and regulation by HIPPI is now actively being investigated. Even though the role of HIPPI in HD remains
obscure, the protein takes part in the regulation of
caspase-1, caspase-8 and caspase-10 gene expression.
Experimental procedures
Cell culture
HeLa cells were obtained from National Cell Science Center, Pune, India, and routinely grown in MEM medium
(HIMEDIA, Mumbai, India) supplemented with 10% fetal
bovine serum (Life Technology, Rockville, MD, USA) at
37 °C in 5% CO2 atmosphere under humidified conditions.
(P8), and AAAGACATA (P9), and their complementary
sequences CATGTCTCT (P2C), CATGTCCTT (P3C),
CATGTATTT (P4C), CATGGCTTT (P5C), CATCTCTTT
(P6C), CAGGTCTTT (P7C), CGTGTCTTT (P8C), and
TATGTCTTT (P9C), were also synthesized chemically. The
underlined sequences are changes from the original motif
observed at the caspase-1 gene upstream sequence (P1).
Each single-stranded oligonucleotide was mixed with
reverse oligonucleotide in a 1 : 1 molar ratio in sterile
water; the mixture was then heated to 95 °C for 15 min
and slowly cooled to 4 °C to allow perfect annealing.
The kinase reaction was carried out with these doublestranded oligoneucleotides using polynucleotide kinase in
the presence of 1 · polynucleotide kinase buffer and
[32P]ATP[cP] (BRIT, Hyderabad, India). The radiolabeled
oligonucleotides were used for EMSA as described previously [18].
Computational analysis to identify the motif
One kilobase upstream sequences for genes (the caspase-1,
caspase-3 and caspase-7 genes) whose expressions are
increased by exogenous Hippi expression [9] were retrieved
from the ENSEMBL database using the biomart data
retrieval tool ( />Putative cis regulatory elements were searched in these
upstream sequences using four widely used motif prediction
programs: meme, alignace, bioprospector and mdscan
[27–30]. The search was also carried out on a second
sequence dataset, which was prepared by masking the promoters of the upregulated genes using repeatmasker
(). The motif prediction process was
repeated several times with different parameters and different motif lengths. The results were compiled, and motifs
that occur within the 60 bp caspase-1 gene upstream
sequence () 151 to ) 92) were selected out using a custom
perl script. To test the phylogenetic conservation of the predicted motifs, 1 kb upstream sequences of caspase-1 gene
orthologs were downloaded from the DOOP database
() and were scanned for occurrence of
the predicted motifs.
The in silico and experimentally derived motif consensus
sequence AAAGASAHK, i.e. AAAGA[GC]A[ATC][TG],
was searched for in upstream sequences of the caspase-8
and caspase-10 genes using patmatch [31].
The pDED and N-terminal region of HIPPI encoded by
the cDNA (gi|19923513) region (1003–1278 and 30–1003),
respectively, were amplified by PCR using specific primer
sets, namely, Hi_pDEDF (5¢-ACGCGTCGACGTCGGA
AATGGAGGAGTGACGG-3¢),
Hi_pDEDR
(5¢-CG
GGATCCCGTTAATAAAAGCCTGTTGCTGGTT-3¢),
Hi_Nterm F (5¢-ACGCGTCGACGTCATGACTGCTGCT
CTGGCCGT-3¢), and Hi_Nterm R (5¢-CGGGATCCCGC
TGCTGGTATCGCTCCTTTG-3¢), and cloned in pPROTET and pEGFP plasmids using methods essentially described previously [9]. pPROTET Clones were transformed
in Escherichia coli strain BL21 Pro, and protein expression
was induced by incubating with anhydrotetracycline
(90 ngỈmL)1) for 5 h. Proteins were isolated from cells by a
freeze–fracture method, and purified by Ni2+–nitrilotriacetic acid affinity chromatography. Finally, the sizes of the
pDED and N-terminal domain of HIPPI with the tag
6X(HN) were determined by 12.5% SDS ⁄ PAGE. The sizes
were 13 kDa for pDED, and 40 kDa for the N-terminus of
HIPPI. pEGFP clones were transfected in HeLa cells as
described previously [9].
EMSA
Motif sequences and methods for making
dsDNA and labeling
Motif sequence AAAGACATG (designated as P1) in the
upstream region of the caspase-1 gene () 101 to ) 93) and
its complementary sequence CATGTCTTT (P1C) were
synthesized (IDT, Coralville, IA, USA). In addition, oligonucleotides, namely AGAGACATG (P2), AAGGACATG
(P3), AAATACATG (P4), AAAGCCATG (P5), AA
AGAGATG (P6), AAAGACCTG (P7), AAAGACACG
3896
Cloning of the Hippi pDED domain and N-terminal
domain of Hippi in the bacterial expression
plasmid pProTET and mammalian vector pEGFP
Different concentrations of GST–HIPPI or 6X(HN)-pDED
of HIPPI were added to the probe 9 bp motif sequences, and
mutated forms (allowed to bind with GST–HIPPI) or
caspase-1 gene upstream sequences [allowed to bind with
6X(HN)-pDED of HIPPI] in binding buffer (1·: Hepes,
12.5 mm; EDTA, 0.5 mm; dithiothreitol, 0.25 mm; KCl,
37.5 mm; glycerol, 5%; MgCl2, 2.5 mm) containing
50 ngỈlL)1 poly(dI:dC) were incubated at room temperature
FEBS Journal 274 (2007) 3886–3899 ª 2007 The Authors Journal compilation ª 2007 FEBS
P. Majumder et al.
for 40 min. At the end of incubation, products were loaded
on 5% polyacrylamide gel and the gel was run at 200 V for
4.5 h at 4 °C. The gel was then dried at 80 °C for about
45 min. The dried gel was exposed to X-ray film (Kodak,
Mumbai, India) overnight at ) 80 °C. After the film had been
developed, positions of bands on the film were indicative of
the positions of the probe. Cold 60 bp caspase-1 gene
upstream sequence (without [32P]dCTP[aP] incorporation) in
excess was used as competitive inhibitor of the reaction
between the labeled 60 bp caspase-1 gene upstream sequence
and 6X(HN)-pDED of HIPPI to determine the specificity of
the interaction.
Fluorimetric quenching study
The purified GST–HIPPI protein was diluted (final concentration varied from 0.8 lm to 4 lm) in reaction buffer
(100 mm Tris ⁄ HCl, pH 8.0, 50 mm NaCl). The concentration of DNA was increased gradually (3 nm to 200 nm) to
the fixed amount of the protein, and the fluorescence intensities were measured at 340 nm [305 nm for 6X(HN)-pDED of
HIPPI], exciting at 295 nm [280 nm for 6X(HN)-pDED of
HIPPI protein] in a Hitachi 4010 Spectrofluorimeter (Hitachi, Tokyo, Japan) or Spex FluoroMax 3 Spectrofluorimeter
(Edison, NJ, USA). Changes in fluorescence intensities (DF)
due to addition of upstream sequences of the caspase-1 gene
were calculated. From double reciprocal plot of DF and concentrations of DNA in the ranges where the decrease in fluorescence intensities reached saturation, apparent dissociation
constants (Kd) for each DNA–protein binding reaction were
calculated following the methods described by Sing & Rao
[32].
Semiquantitative RT-PCR with gene-specific
primers
Methods for RNA isolation, first-strand DNA synthesis,
etc. have been published previously [33]. After isolation,
RNA was treated with RNase-free DNase (Sigma Chemicals, St Louis, USA) to remove possible genomic DNA
contaminants. The first strand of cDNA was synthesized as
described before, and used to study the expression of caspase-8 and caspase-10 by PCR. The caspase-8 gene-specific
primers were: forward, 5¢-AAGCAAACCTCGGGGATAC
T-3¢; reverse, 5¢-GGGGCTTGATCTCAAAATGA-3¢. The
caspase-10 gene-specific primers were: forward, 5¢-GA
CGCCTTGATGCTTTCTTC-3¢; reverse, 5¢-ATGAAGGC
GTTAACCACAGG-3¢. PCR conditions for these two
genes were similar, except for the annealing temperature.
The common PCR conditions used for each of these loci
were: initial denaturation at 94 °C for 1 min, followed by
35 cycles each containing three steps, denaturation at 94 °C
for 15 s, annealing at 50 °C (for caspase-8) or at 60 °C (for
caspase-10) for 30 s, and extension at 72 °C for 1 min and
finally extension for 10 min at 72 °C.
Role of HIPPI as a transcription regulator
Luciferase assay
The caspase-1 gene upstream 60 bp DNA () 151 to ) 92)
was cloned in pGL3 as described previously [18]. A mutation
(G to T) at position ) 98 of the 60 bp () 151 to ) 92)
upstream sequence of the caspase-1 gene was introduced
using specific primers (forward, 5¢-CCTGATGCAGGCTA
CAGTTCT-3¢; and reverse, 5¢-GCATATGCATGTATT
TATTTTTCTTC-3¢) and standard procedures. The specific
mutation (G to T) was confirmed by sequencing. HeLa cells
were transfected with GFP–Hippi. Twenty-four hours after
transfection, more than 90% of the transfected cells were
expressing GFP-tagged protein (as visualized under a fluorescence microscope) [9]. The 60 bp or mutated 60 bp
sequences (G to T at position ) 98) of the caspase-1 gene
upstream sequence cloned in pGL3 vector and control pGL3
plasmid (without any insert) were transfected separately in
HeLa cells expressing GFP–Hippi, and the cells were grown
in the presence of geniticin (marker present at the pEGFP
plasmid). Control pGl3 and 60 bp mutated 60 bp sequences
of the caspase-1 gene upstream sequences cloned in pGL3
plasmid were also transfected into the parental HeLa cells.
All these transfections were carried out using Lipofectamine
2000 reagent (Invitrogen, Carlsbad, CA, USA), following
the procedure provided by the manufacturer. After 48 h of
transfection of pGL3, cells were harvested and lysed, and
luciferase substrate (Promega, Madison, WI, USA) was
added. Luciferase activity was measured in a Sirius tube
luminometer (Berthold Detection Systems, Pforzheim,
Germany). In the same experiments, the transfection efficiencies of pGL3-containing upstream sequences of the
caspase-1 gene in both control and GFP–Hippi-transfected
cells were monitored by cotransfecting the b-galactosidase
gene containing vector pSV-b-galactosidase (Promega) and
measuring the b-galactosidase activity along with luciferase activity. Appropriate correction was made for equal
transfection, using results obtained with the b-galactosidase
activity. The transfection efficiency of the Hippi construct
cloned in pEGFP plasmid was monitored by assaying
GFP–Hippi expression in those cells as described previously
[9], and appropriate correction was incorporated on the
basis of this.
Detection of nuclear fragmentation, and
caspase-1, caspase-3 and caspase-8 activation
Nuclear fragmentation, and caspase-1, caspase-3 and
caspase-8 activation, were detected using methods described
previously [9].
Western blot analysis
The methods of total protein isolation from exponentially
growing cells and western blot analysis using antibodies to
FEBS Journal 274 (2007) 3886–3899 ª 2007 The Authors Journal compilation ª 2007 FEBS
3897
Role of HIPPI as a transcription regulator
P. Majumder et al.
caspase-1 and caspase-8 were similar to those published
previously [9].
13
References
1 MacDonald ME, Ambrose CM, Duyao MP, Myers
RH, Lin C, Srinidhi L, Barnes G, Taylor SA, James M,
Groot N et al.(1993) A novel gene containing a
trinucleotide repeat that is expanded and unstable on
Huntington’s disease chromosomes. Cell 72, 971–983.
2 Pattison LR, Kotter MR, Fraga D & Bonelli RM (2006)
Apoptotic cascades as possible targets for inhibiting cell
death in Huntington’s disease. J Neurol 253, 1137–1142.
3 Goehler H, Lalowski M, Stelzl U, Waelter S, Stroedicke
M, Worm U, Droege A, Lindenberg KS, Knoblich M,
Haenig C et al. (2004) A protein interaction network
links GIT1, an enhancer of huntingtin aggregation, to
Huntington’s disease. Mol Cell 15, 853–865.
4 Harjes P & Wanker EE (2003) The hunt for huntingtin
function: interaction partners tell many different stories.
Trends Biochem Sci 28, 425–433.
5 Li S & Li X (2004) Huntingtin–protein interactions and
the pathogenesis of Huntington’s disease. Trends Genet
20, 146–154.
6 Wanker EE, Rovira C, Scherzinger E, Hasenbank R,
Walter S, Tait D, Colicelli J & Lehrach H (1997) HIP-I:
a huntingtin interacting protein isolated by the yeast
two-hybrid system. Hum Mol Genet 6, 487–495.
7 Vecchi M & Di Fiore PP (2005) It’s HIP to be a hub:
new trends for old-fashioned proteins. J Cell Biol 170,
169–171.
8 Gervais FG, Singaraja R, Xanthoudakis S, Gutekunst
C, Leavitt BR, Metzler M, Hackam AS, Tam J, Vaillancourt JP, Houtzager V et al. (2002) Recruitment and
activation of caspase8 by the Huntingtin-interacting
protein HIP1 and a novel partner Hippi. Nat Cell Biol
4, 95–105.
9 Majumder P, Chattopadhyay B, Mazumder A, Das P &
Bhattacharyya NP (2006) Induction of apoptosis in cells
expressing exogenous Hippi, a molecular partner of
huntingtin-interacting protein HIP1. Neuro Biol Dis 22,
242–256.
10 Kalchman MA, Koide HB, McCutcheon K, Graham
RK, Nichol K, Nishiyama K, Kazemi-Esfarjani P, Lynn
FC, Wellington C, Metzler M et al. (1997) HIP1, a
human homologue of S. cerevisiae Sla2p, interacts with
membrane-associated huntingtin in the brain. Nat Genet
16, 44–53.
11 Cheng CM, Huang SP, Chang YF, Chung WY & You
CY (2007) The viral death protein Apoptin interacts with
Hippi, the protein interactor of Huntingtin-interacting
protein. 1. Biochem Biophys Res Commun 305, 359–
364.
12 Roth W, Kermer P, Krajewska M, Welsh K, Davis S,
Krajewski S & Reed JC (2003) Bifunctional apoptosis
3898
14
15
16
17
18
19
20
21
22
23
24
25
26
inhibitor (BAR) protects neurons from diverse cell
death pathways. Cell Death Differ 10, 1178–1187.
Sakamoto K, Yoshida S, Ikegami K, Minakami R,
Kato A, Udo H & Sugiyama H (2007) Homer1c interacts with Hippi and protects striatal neurons from
apoptosis. Biochem Biophys Res Commun 352, 1–5.
Houde C, Dickinson RJ, Houtzager VM, Cullum R,
Montpetit R, Metzler M, Simpson EM, Roy S, Hayden
MR, Hoodless PA et al. (2006) Hippi is essential for
node cilia assembly and Sonic hedgehog signaling. Dev
Biol 300, 523–533.
Sugars KL & Rubinsztein DC (2003) Transcriptional
abnormalities in Huntington disease. Trends Genet 19,
233–238.
Vis JC, Schipper E, de Boer-van Huizen RT, Verbeek
MM, de Waal RM, Wesseling P, ten Donkelaar HJ &
Kremer B (2005) Expression pattern of apoptosis-related markers in Huntington’s disease. Acta Neuropathol
(Berlin) 109, 321–328.
Li SH, Lam S, Cheng AL & Li XJ (2000) Intranuclear
huntingtin increases the expression of caspase-1 and
induces apoptosis. Hum Mol Genet 9, 2859–2867.
Majumder P, Chattopadhyay BS, Sukanya S, Ray T,
Banerjee M, Mukhopadhyay D & Bhattacharyya NP
(2007) Interaction of HIPPI with putative promoter
sequence of caspase-1 in vitro and in vivo. Biochem
Biophys Res Commun 323, 80–85.
Gupta S, Radha V, Furukawa Y & Swarup G (2001)
Direct transcriptional activation of human caspase1
by tumor suppressor p53. J Biol Chem 276, 10585–
105858.
Ashkenazi A & Dixit VM (1998) Death receptors: signaling and modulation. Science 281, 1305–1308.
Weber CH & Vincenz C (2001) The death domain
superfamily: a tale of two interfaces? Trends Biochem
Sci 26, 475–481.
Schickling O, Stegh AH, Byrd J & Peter ME (2001)
Nuclear localization of DEDD leads to caspase6 activation through its death effector domain and inhibition of
RNA polymerase I dependent transcription. Cell Death
Differ 8, 1157–1168.
Zhan Y, Hegde R, Srinivasula SM, Fernandes-Alnemri
T & Alnemri ES (2002) Death effector domain-containing proteins DEDD and FLAME-3 form nuclear
complexes with the TFIIIC102 subunit of human transcription factor IIIC. Cell Death Differ 9, 439–447.
Mills IG, Gaughan L, Robson C, Ross T, McCracken
S, Kelly J & Neal DE (2005) Huntingtin interacting
protein 1 modulates the transcriptional activity of nuclear hormone receptors. J Cell Biol 170, 191–200.
´
Sanchez I, Xu C, Juo P, Kakizaka A, Blenis J & Yuan
J (1999) Caspase-8 is required for cell death induced by
expanded polyglutamine repeats. Neuron 22, 623–633.
Miyashita MUT, Ohtsuka Y, Okamura-Oho Y, Shikama Y & Yamada M (2001) Extended polyglutamine
FEBS Journal 274 (2007) 3886–3899 ª 2007 The Authors Journal compilation ª 2007 FEBS
P. Majumder et al.
27
28
29
30
selectively interacts with caspase-8 and -10 in nuclear
aggregates. Cell Death Differ 8, 377–386.
Liu X, Brutlag DL & Liu JS (2001) BioProspector: discovering conserved DNA motifs in upstream regulatory
regions of co-expressed genes. Pac Symp Biocomput
127–138.
Bailey TL & Elkan C (1994) Fitting a mixture model by
expectation maximization to discover motifs in biopolymers. In Proceedings of the Second International Conference on Intelligent Systems for Molecular Biology
(Altman R, Brutlag D, Karp P, Lathrop R & Searls D,
eds) pp. 28–36. AAAI Press, Menlo Park, CA.
Roth FP, Hughes JD, Estep PW & Church GM (1998)
Finding DNA regulatory motifs within unaligned noncoding sequences clustered by whole-genome mRNA
quantitation. Nat Biotechnol 16, 939–945.
Liu XS, Brutlag DL & Liu JS (2002) An algorithm for
finding protein–DNA binding sites with applications to
Role of HIPPI as a transcription regulator
chromatin-immunoprecipitation microarray experiments.
Nat Biotechnol 20, 835–839.
31 Yan T, Yoo D, Berardini TZ, Mueller LA, Weems DC,
Weng S, Cherry JM & Rhee SY (2005) PatMatch: a
program for finding patterns in peptide and nucleotide
sequences. Nucleic Acids Res 33, W262–W266.
32 Singh J & Rao MR (1987) Interaction of rat testis
protein, TP, with nucleic acids in vitro. Fluorescence
quenching, UV absorption and thermal denaturation
studies. J Biol Chem 262, 734–740.
33 Chaudhuri K, Banerjee R, Pandit B, Mukherjee A,
Das S, Sengupta S, Roychoudury S & Bhattacharyya
NP (2003) Identification of two differentially expressed
mitochondrial genes in a methotrexate resistant
Chinese hamster cell strain derived from V79 cells
using RNA finger printing by arbitrary primed
polymerase chain reaction (RAP-PCR). Radiat Res 160,
77–85.
FEBS Journal 274 (2007) 3886–3899 ª 2007 The Authors Journal compilation ª 2007 FEBS
3899