Báo cáo khoa học: Dissociation/association properties of a dodecameric cyclomaltodextrinase Effects of pH and salt concentration on the oligomeric state pot
Bạn đang xem bản rút gọn của tài liệu. Xem và tải ngay bản đầy đủ của tài liệu tại đây (441.08 KB, 13 trang )
Dissociation/association properties of a dodecameric
cyclomaltodextrinase
Effects of pH and salt concentration on the oligomeric state
Hee-Seob Lee
1
, Jin-Soo Kim
1
, Kyuho Shim
1
, Jung-Woo Kim
1
, Kuniyo Inouye
2
, Hiroshi Oneda
2
,
Young-Wan Kim
1
, Kyung-Ah Cheong
1
, Hyunju Cha
1
, Eui-Jeon Woo
3
, Joong Hyuck Auh
1
,
Sung-Joon Lee
4
, Jung-Wan Kim
5
and Kwan-Hwa Park
1
1 Center for Agricultural Biomaterials, and School of Agricultural Biotechnology, Seoul National University, Seoul, Korea
2 Division of Food Science and Biotechnology, Graduate School of Agriculture, Kyoto University, Sakyo-ku, Kyoto, Japan
3 Systemic Proteomics Research Center, Korea Research Institute of Bioscience and Biotechnology, Taejon, Korea
4 Division of Food Science, College of Life and Environmental Sciences, Korea University, Seoul, Korea
5 Department of Biology, University of Incheon, Incheon, Korea
Enzymes in biological systems act not only as mono-
mers but also associate to form dimers or higher order
oligomers. Dimerization and oligomerization can pro-
vide enzymes with a number of functional advantages
such as high stability and control over accessibility and
specificity of active sites [1,2]. An example of this is
the 3D domain-swapped maltogenic amylase from a
Thermus strain (ThMA) that exhibits different binding
preferences for various substrates by showing increased
specificity via dimerization [3]. Recently, oligomeric
states have been reported for the members of glyco-
side hydrolase family 13, especially cyclodextrin-/
Keywords
cyclomaltodextrinase, dissociation/
association, dodecamer, oligomerization,
quaternary structure, maltogenic amylase
Correspondence
K H. Park, Center for Agricultural
Biomaterials, and School of Agricultural
Biotechnology, Seoul National University,
Seoul 151–921, Korea
Fax: +82 28735095
Tel: +82 28804852
E-mail:
Enzymes
cyclomaltodextrinase (EC 3.2.1.54).
(Received 29 August 2005, revised 28
October 2005, accepted 2 November 2005)
doi:10.1111/j.1742-4658.2005.05047.x
As an effort to elucidate the quaternary structure of cyclomaltodextrinase
I-5 (CDase I-5) as a function of pH and salt concentration, the dissoci-
ation/association processes of the enzyme were investigated under various
pH and salt conditions. Previous crystallographic analysis of CDase I-5
indicated that it existed exclusively as a dodecamer at pH 7.0, forming an
assembly of six 3D domain-swapped dimeric subunits. In the present study,
analytical ultracentrifugation analysis suggested that CDase I-5 was present
as a dimer in the pH range of 5.0–6.0, while the dodecameric form was pre-
dominant at pH values above 6.5. No dissociation of the dodecamer was
observed at pH 7.0 and the above. Gel filtration chromatography showed
that CDase I-5 dissociated into dimers at a rate of 8.58 · 10
)2
h
)1
at
pH 6.0. A mutant enzyme with three histidine residues (H49, H89, and
H539) substituted with valines dissociated into dimers faster than the wild-
type enzyme at both pH 6.0 and 7.0. The tertiary structure indicated that
the effect of pH on dissociation of the oligomer was mainly due to the pro-
tonation of H539. Unlike the pH-dependent process, the dissociation of
wild-type CDase I-5 proceeded very fast at pH 7.0 in the presence of
0.2–1.0 m of KCl. Stopped-flow spectrophotometric analysis at various
concentrations of KCl showed that the rate constants of dissociation (k
d
)
from dodecamers into dimers were 5.96 s
)1
and 7.99 s
)1
in the presence of
0.2 m and 1.0 m of KCl, respectively.
Abbreviations
CD, circular dichroism; CDase, cyclomaltodextrinase; FRET, fluorescence resonance energy transfer; ITC, isothermal titration calorimetry;
ThMA, maltogenic amylase from a Thermus strain.
FEBS Journal 273 (2006) 109–121 ª 2005 The Authors Journal compilation ª 2005 FEBS 109
pullulan-degrading enzymes such as cyclomaltodextri-
nase (CDase; EC 3.2.1.54), maltogenic amylase (MA-
ase; EC 3.2.1.133), and neopullulanase (NPase, EC,
3.2.1.135) [4,5].
We demonstrated previously that CDase I-5 origin-
ated from an alkalophilic Bacillus sp. I-5 existed as a
dodecamer, which was consisted of a hexamer of
dimeric units, and that the formation of the supramo-
lecular assembly resulted in an increase in the catalytic
efficiency compared with that of the dimeric unit of
the enzyme [6]. The monomeric structure of CDase I-5
contained a distinct N-domain in addition to a central
(b/a)
8
-barrel domain and a C-domain. The N- (resi-
dues 1–123) and C- (residues 505–583) domains are
composed exclusively of b-strands. Two CDase mole-
cules form a domain-swapped dimer in which the
N-domain of one molecule is involved in extensive
interactions with the (b/a)
8
-barrel domain of the other
molecule, as observed in the crystal structure of
ThMA, which exists as a dimer in both the solution
and crystal states [3]. The C-domain was, however,
shown to be distinctly separated from the active site
groove and was not involved in main-chain to main-
chain hydrogen bonding with either the N- or the
(b/a)
8
-barrel domain. Interestingly, the C-terminal
domain was found to be critically involved in the
supramolecular assembly of CDase [6].
In this study, we investigated the exogenous and
endogenous factors affecting the supramolecular
assembly of CDase I-5. Dissociation/association of the
CDase I-5 dodecamer was found to be dependent on
pH and salt concentration. At pH 6.0, the enzyme
preferentially dissociated into its dimeric units, which
were enzymatically active; at pH 7.0, the enzyme exis-
ted predominantly in the dodecameric form, which had
higher catalytic activity than the dimeric form. Con-
versely, CDase I-5 rapidly dissociated into dimeric
units in the presence of KCl at pH 7.0. The associ-
ation/dissociation process of CDase I-5 was examined
in various oligomeric states in order to identify the
mechanism and forces that contribute to the supramo-
lecular assembly and function of the enzyme. In addi-
tion, the role of histidine residues at the interfaces in
the formation of the dodecamer was investigated by
site-directed mutagenesis.
Results
pH-dependent dissociation/association
of CDase I-5
To investigate the effect of pH on the dissociation of
dodecameric CDase I-5, sedimentation equilibrium
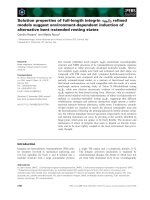
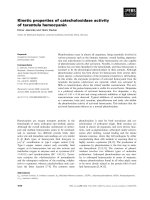
analysis was performed at pH 5.0–8.5. The apparent
molecular mass of CDase I-5 determined using analyt-
ical ultracentrifugation was plotted as a function of
pH (Fig. 1). The results indicated that CDase I-5 exis-
ted as a monomer/dimer in the pH range of 5.0–6.0,
while dodecameric CDase I-5 was predominant at
pH 6.5–8.5. Dimeric CDase I-5 began to associate with
a transition midpoint of pH 6.2, forming dodecameric
CDase I-5 as a major form at pH values higher than
6.5.
Based on these results, the reversibility of the asso-
ciation and dissociation processes of CDase I-5 was
examined at pH 6.0 and 7.0. CDase I-5 was incubated
in universal buffer (pH 6.0 or 7.0), and aliquots were
taken at appropriate time intervals to determine the
oligomeric state of the enzyme. Gel filtration chroma-
tography was used to monitor the change of CDase
I-5 from a dodecamer to a dimer. The corresponding
relative molecular mass was estimated from the relative
elution time of the standard proteins. At pH 6.0, the
dodecameric enzyme dissociated into dimers, as deter-
mined by the relative elution times of dodecamers and
dimers (Fig. 2A). The peak corresponding to the
dodecameric form decreased, while that corresponding
to the dimer increased as the incubation time pro-
ceeded. In 72 h of incubation at 4 °C, dodecameric
CDase I-5 was fully converted into the dimeric form.
On the other hand, if the pH of the enzyme solution
was elevated to 7.0 after dissociation at pH 6.0, the
reverse was observed. The peak corresponding to the
dimeric form of the enzyme shifted towards that
corresponding to the dodecamer (Fig. 2B). The
association process by which dimeric enzymes fully
recovered their dodecameric form was completed in
106 h at 4 °C (data not shown). These results indicated
that separate dimers could form a dodecamer and that
Fig. 1. Apparent molecular mass of CDase I-5 at various pH values
determined by analytical ultracentrifugation analysis.
Dynamics of a CDase in the oligomeric state H S. Lee et al.
110 FEBS Journal 273 (2006) 109–121 ª 2005 The Authors Journal compilation ª 2005 FEBS
the dimer–dodecamer transition was a true association/
dissociation equilibrium process.
The progress curve of the interconversion between
dodecamer and dimer at pH 6.0 fitted a single expo-
nential time course. Based on this observation, the kin-
etics of the dissociation process was analyzed in detail
by calculating the peak area during the dissociation
process. The rate of change in the peak area shown
in Fig. 3A was estimated according to an equation of
single exponential decay [7],
ðpeak areaÞ
t
¼ Ae
Àkt
þ B:
From the equation above, the slope of the exponen-
tial line in Fig. 3 was considered to be the rate con-
stant, giving a rate constant of 8.58 · 10
)2
h
)1
for
the dissociation of dodecamers to dimers (Table 1).
The progress curve of the conversion of dimers to
dodecamers at pH 7.0 also fitted a single exponential
time course (Fig. 3B). From the above equation, the
rate constant for the association of dimers to form
dodecamers was determined as 1.09 · 10
)1
h
)1
(Table 1).
The kinetic parameters of CDase I-5 for b-cyclo-
dextrin in either the dimeric or dodecameric state were
compared by isothermal titration calorimetry at
pH 6.0 and 7.0. The dodecameric form at pH 7.0
exhibited a k
cat
/K
m
value $15 times larger than that of
the dimeric form at pH 6.0 (Table 1).
Structural factors affecting dissociation/
association of CDase I-5
Based on the information obtained about the 3D struc-
ture of CDase I-5, the quaternary state of CDase I-5
was likely to be maintained by the intrinsic capability
of the N- and C-terminal regions of the enzyme to
form a dodecamer at pH 7.0 and a dimer at pH 6.0.
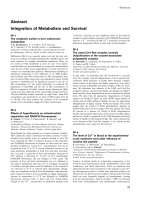
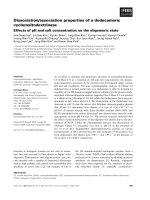
Crystallography of CDase I-5 has shown that a histi-
dine residue in the C-terminal region (H539) and two
of the four histidine residues in the N-terminal region
(H49 and H89) are localized at the interfaces between
dimeric units and are likely to be involved in the inter-
action between CDase I-5 molecules (Fig. 4A). The
b-strand from K536 to L541 of a molecule is the major
part contacting the adjacent b-strand from T50 to V54
of the other molecule in oligomerization. H539 is in
the center of that contact region. The nitrogen (NE2)
of the histidine residue forms a hydrogen bond to oxy-
gen (OE1) in the side chain of Q516, of which the
nitrogen (NE2) also forms hydrogen bond to side
chain of D535. There are a total of six hydrogen bonds
to support a sharp turn comprising from N533 to
A537. Protonation of H539 may prevent the hydrogen
bond to Q516 at a lower pH, thereby destabilizing the
region hold tightly by the hydrogen bond network
from K536-T540 and leading to conformational
change at the interface of a dimer (Fig. 4B). There are
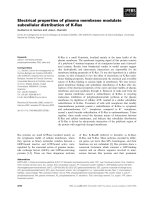
Fig. 2. Chromatographic separation of dimeric and dodecameric forms of CDase I-5. (A) Conversion of dodecamer to dimer. Dodecameric
CDase I-5 at pH 7.0 was transferred to a buffer with pH 6.0 and incubated at 4 °C. (B) Conversion of dimer to dodecamer. Dimeric CDase
I-5 at pH 6.0 was transferred to a buffer with pH 7.0 and incubated at 4 °C.
H S. Lee et al. Dynamics of a CDase in the oligomeric state
FEBS Journal 273 (2006) 109–121 ª 2005 The Authors Journal compilation ª 2005 FEBS 111
two hydrogen bonds at G538 and T540 to the adjacent
monomer, of which G538 forms a hydrogen bond to
the carbonyl oxygen of M51. Two residues at the
N-terminus (H49 and H89) of a subunit were located
close to the C-domain of the other CDase I-5 subunit.
The isoelectric point of CDase I-5 (pI 7.8) suggested
that a decrease in pH from 7.0 to 6.0 would increase
the number of positively charged residues at the C-ter-
minal region, particularly those arising from protona-
tion of the histidinyl groups. These might destabilize
the dodecameric structure of CDase I-5 by electrostatic
repulsion of positively charged residues at low pH,
resulting in the dissociation of dodecamers to dimers.
Double and triple mutations at three histidine resi-
dues (H49, H89, and H539) were constructed in var-
ious combinations. All mutant CDases purified from
Escherichia coli transformants carrying the mutant
clones had specific activity toward b-cyclodextrin and
optimal temperature and pH similar to those of wild-
type CDase I-5 (data not shown). However, the disso-
ciation rate constant was increased in all the mutants.
Dissociation of the CDase I-5 mutants
at pH 6.0 and 7.0
To elucidate the role of histidine residues in the super-
assembly of CDase I-5, the dissociation rate constants
of two mutants (H49V/H539V and H49V/H89/
H539V) were determined. The dissociation process was
analyzed in universal buffer (pH 6.0) by chromatogra-
phy using a Superdex 200 HR 10/30 column. The peak
area corresponding to the dodecamer diminished with
incubation time. The progress curves representing the
dissociation of dodecamers to dimers fitted the equa-
tion of a single exponential decay. The dissociation rate
constants of all mutants were increased compared with
that of wild-type CDase I-5. The dissociation rate
constants for H49V/H539V and H49V/H89V/H539V
were 6.80 · 10
)1
h
)1
and 1.36 h
)1
, respectively (Table 2);
the same constant for H49V/H89V/H539V was about
16 times larger than that of wild-type CDase I-5. The
mutation of histidine to valine showed the same effect,
even at pH 7 and above. These data indicated that the
effect of pH on dissociation of the oligomer was mainly
due to the protonation of a single residue rather than a
global effect of pH on the protein. In agreement with
the site-directed mutagenesis studies, H539 was most
likely to be the target of this pH effect.
Wild-type and mutant CDases were stored in 50 mm
sodium phosphate buffer (pH 7.0) at 4 °C, applied to
a Superdex 200 HR 10/30 column on a Pharmacia
Akta FPLC system, and eluted with 50 mm
sodium phosphate butter (pH 7.0) at a flow rate of
0.4 mLÆmin
)1
. The enzyme (100 lL) was applied to the
column, and the absorbance of each eluent was meas-
ured at 280 nm. The proportion of dodecamers
decreased as less protein was used. The dissociation
constant (K
d
) for the dodecamer was estimated as
Fig. 3. The progress curves of the interconversion between dimer
and dodecamer at pH 6.0 (A) and pH 7.0 (B). d, dodecamer; s,
dimer.
Table 1. Physicochemical properties of wild-type CDase I-5 at pH 6
and 7.
Property
Wild-type CDase I-5
pH 6.0 pH 7.0
Transition to Dissociation Association
k (h
)1
) (8.58 ± 0.23) · 10
)2
(1.09 ± 0.17) · 10
)1
Oligomeric state Dimer Dodecamer
k
cat
(s
)1
)
a
8.5 ± 0.2 78.2 ± 0.4
K
m
(mM)
a
0.889 ± 0.045 0.454 ± 0.007
k
cat
/K
m
(s
)1
ÆmM
)1
)
a
9.5 ± 0.5 172 ± 3
a
Determined using b-cyclodextrin as a substrate.
Dynamics of a CDase in the oligomeric state H S. Lee et al.
112 FEBS Journal 273 (2006) 109–121 ª 2005 The Authors Journal compilation ª 2005 FEBS
described in the Experimental procedures section. A
very good fit to a line with a slope of 5.04 was
obtained, and the K
d
values for H49V/H89V/H539V
and H49V/H539V were calculated as 1.79 · 10
)30
and
4.63 · 10
)32
m
5
, respectively (Table 2). For wild-type
CDase I-5, the enzyme was applied to a Superdex col-
umn at concentrations of up to 100 nm at pH 7.0, but
no dissociation of the dodecameric enzyme was detec-
ted. The results indicated that the K
d
value of wild-
type CDase I-5 was much lower than those of the
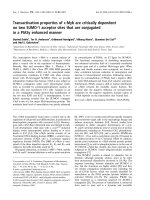
mutants. This result was confirmed by the sedimenta-
tion equilibrium and sedimentation velocity analytical
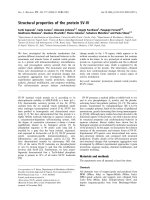
ultracentrifugation analyses carried out at pH 7.0. In
the sedimentation equilibrium analysis, the apparent
molar masses of wild-type and mutant CDase were
736 and 491 kDa, respectively (Fig. 5A). The data
from a series of scans (Fig. 5B) showed the common
meniscus and the logical progression of the boundary
and plateau regions. The sedimentation coefficient was
calculated as described in the Experimental procedures
A
B
Fig. 4. The three histidine residues at the
interface of two CDase I-5 subunits consti-
tuting a dodecamer (A). Close view of the
interface shows that H539 is involved in
various hydrogen bondages (B). Blue balls
represent nitrogen, red balls oxygen, and
yellow balls carbon of amino acids. Amino
acid residues in one subunit are primed and
those in the other subunit are not.
H S. Lee et al. Dynamics of a CDase in the oligomeric state
FEBS Journal 273 (2006) 109–121 ª 2005 The Authors Journal compilation ª 2005 FEBS 113
section. The apparent weight average sedimentation
coefficients were 20 for wild-type and 20 and 5
for H49V/H89V/H539V, respectively. These results
implied that the CDase mutant existed in a dimer/
dodecamer equilibrium at pH 7.0.
Effect of KCl on the quaternary structure
of CDase I-5
To investigate the oligomeric state of CDase I-5 at
pH 7.0, CDase I-5 was applied to a Superdex 200 HR
10/30 column. The apparent molecular mass of the
enzyme, calculated by comparing the elution time with
those of standard proteins [6], was 638 kDa, which
was much larger than the molecular mass of the mono-
meric subunit (67.7 kDa). The result indicated that the
major oligomeric state of CDase I-5 at pH 7.0 was
dodecameric. However, the peak corresponding to
dimer increased in the presence of 1 m KCl, while
the area of the peak corresponding to dodecamer
decreased, suggesting that the enzyme dissociated from
dodecamers into dimers in the presence of salt [8].
In order to investigate the relationship between
the oligomeric state of the enzyme and the salt
Table 2. Kinetic and equilibrium parameters of wild-type and mutant CDase I-5.
Parameter
pH Wild-type
Mutants
H49V/H539V H49V/H89V/H539V
Dissociation rate constant k
d
(h
)1
) 6.0 (8.58 ± 0.23) · 10
)2
(6.80 ± 1.35) · 10
)1
1.36 ± 0.31
Equilibrium constant K
d
( · 10
)30
) 7.0 0.0 0.046 ± 0.001 1.79 ± 0.10
Sedimentation coefficient (s)
a
7.0 20 –
b
20, 5
a
Apparent weight average sedimentation coefficient in Svedbergs.
b
Not determined.
Fig. 5. (A) Sedimentation equilibrium analysis of wild-type CDase I-5 (open circles) and the CDase I-5 H49V/H89V/H539V mutant (closed cir-
cles). (B) Sedimentation velocity analytical ultracentrifugation of wild-type CDase I-5 and the CDase I-5 H49V/H89V/H539V mutant. Overlay
plots represent the boundary sedimentation data of wild-type CDase I-5 (upper panel) and mutant CDase I-5 (lower panel).
Dynamics of a CDase in the oligomeric state H S. Lee et al.
114 FEBS Journal 273 (2006) 109–121 ª 2005 The Authors Journal compilation ª 2005 FEBS
concentration, the effect of the dimer/dodecamer equi-
librium on the enzymatic properties of CDase I-5 was
examined at various concentrations of KCl. First, the
role of KCl in dissociation of CDase I-5 was investi-
gated by analytical ultracentrifugation. As the KCl
concentration was increased from 0 to 1.0 m, the
apparent molecular weight of the enzyme decreased
and the amount of dimeric CDase I-5 increased
(Fig. 6). In the presence of 1.0 m KCl, the dodecameri-
zation degree of CDase I-5 decreased to 69% [8].
In order to determine whether any change occurred
in the secondary structure of CDase I-5, far-UV circu-
lar dichroism (CD) analysis was carried out. When the
enzyme was treated with 1.0 m KCl, there was no sig-
nificant change in the CD spectrum, while treatment
with 1.0 m or 6.0 m urea produced significant changes
(Fig. 7). The results indicated that the secondary struc-
ture of CDase I-5 was not altered by KCl at concen-
trations of up to 1.0 m. Likewise, the ellipticity also
showed that 1.0 m KCl did not affect the secondary
structure of the enzyme, while urea and guanidine
hydrochloride exerted a great influence. We concluded
that the secondary structure and peptide backbone of
native CDase I-5 were stable and rigid at pH 7.0 in
the absence or presence of KCl at concentrations up to
1.0 m.
Kinetic study of rapid dissociation of CDase I-5
To characterize the changes in the quaternary structure
of CDase I-5, the intrinsic fluorescence of CDase I-5
was measured at various concentrations of KCl and
denaturants. In general, the intrinsic fluorescence
results mainly from tryptophan residues, which show
an emission maximum at around 340 nm when dis-
solved in water (Fig. 8). Tryptophan covered by the
protein matrix in the aqueous phase causes a blue
shift. When excited at 295 nm, dodecameric CDase I-5
had an emission maximum at 335 nm. Upon the addi-
tion of KCl to a final concentration of 1.0 m, the
dodecamer should be dissociated into dimeric units,
and the aromatic amino acid residues buried by dodec-
amerization would become exposed. The aromatic
amino acid residue, tryptophan, would then contribute
to an increase in the intrinsic fluorescence.
Based on the crystal structure analysis of CDase I-5,
the tryptophan residues of CDase I-5 at the 68, 68¢,
93, and 93¢ positions were possible candidates contri-
buting to increased fluorescence intensity through dis-
sociation upon exposure to solvent. The fluorescence
intensity of CDase I-5 increased as the dodecameric
enzyme dissociated into dimers upon the addition of
1.0 m KCl (Fig. 8A). Conversely, upon denaturation
and unfolding of the protein by chemical modification,
nonpolar interior groups became exposed to the polar
exterior phase, and the quenching of fluorescence was
accompanied by a red shift and a decrease in intensity
[9]. The intensity of fluorescence of CDase I-5 treated
with 1.0 or 6.0 m urea at 25 °C was weak, and the
wavelength of the spectral maximum was shifted to
355 nm (Fig. 8B).
To investigate the dissociation process of CDase I-5,
changes in fluorescence intensity of the reaction mix-
ture were monitored using an SFM-4 stopped-flow
apparatus at different KCl concentrations (0–1.0 m
KCl). The fluorescence intensity of CDase I-5
increased as the concentration of KCl increased
(Fig. 9A). For a pseudo-first-order reaction, the rate
Fig. 6. Sedimentation equilibrium analytical ultracentrifugation analy-
sis of CDase I-5 in the presence or absence of KCl. d, CDase I-5
with no KCl added; s, enzyme in 1.0
M KCl.
Fig. 7. Far UV-CD spectra of CDase I-5 at various concentrations of
KCl and urea. The spectrum shown in closed circles represents the
spectrum of CDase with no KCl; n, with 1.0
M KCl; h, with 1.0 M
urea; ¤, with 6.0 M urea.
H S. Lee et al. Dynamics of a CDase in the oligomeric state
FEBS Journal 273 (2006) 109–121 ª 2005 The Authors Journal compilation ª 2005 FEBS 115
constant of dissociation (k
d
) from dodecamer into
dimer was estimated at various concentrations of KCl
using the Guggenheim method [10]. The k
d
values in
the presence of 0.25 m and 1.0 m KCl were 5.96 and
7.99 s
)1
, respectively (Fig. 9B and Table 3). The rate
constants increased as the pH was lowered or the con-
centration of KCl was increased. The results suggested
that the effect of salts on the oligomeric state of
CDase I-5 correlated with the dissociation of the
dodecameric form of the enzyme.
Discussion
An earlier study on the CDase I-5 crystal structure
demonstrated that this enzyme adopts a dodecameric
form in solutions with a pH above 7 [6]. To the
authors’ knowledge, the dodecamerization of CDase
I-5 is by far the highest order oligomerization observed
for an amylolytic enzyme. To understand the role
of the oligomerization of CDase I-5, its dissociation/
association properties were investigated at low and
high pHs and in the presence of KCl.
Considering also the 3D structure of CDase I-5, the
analysis of the quaternary state of CDase I-5 revealed
Fig. 8. Fluorescence spectra of CDase I-5. (A) - - - -, the intensity of
fluorescence of CDase I-5 treated with 1
M KCl; ——, native CDase
I-5. (B) The curve shown by —— represents the fluorescence inten-
sity of native CDase I-5; ,CDaseI-5denatured with 1.0
M
urea; –Æ–Æ–, CDase I-5 denatured with 6.0 M urea at 25 °C.
Fig. 9. (A) Time course fluorescence spectra of CDase I-5 dissoci-
ation at various concentrations of KCl at pH 7 and 25 °C. (B) Plot of
log DF versus time by the Guggenheim method. d, dissociation of
CDase I-5 in the presence of 0.2
M KCl; h, 0.5 M KCl; m, 0.8 M
KCl; ), 1.0 M KCl.
Table 3. Salt-induced dissociation rate constants (k
d
)
a
of CDase I-5
determined by fast kinetic measurements.
pH
Dissociation rate constant (s
)1
)
0.2
M KCl 0.5 M KCl 0.8 M KCl 1.0 M KCl
7.0 5.96 ± 0.0 6.36 ± 0.16 7.53 ± 0.12 7.99 ± 0.13
6.9 6.30 ± 0.11 7.03 ± 0.10 7.64 ± 0.06 8.79 ± 0.07
6.7 9.15 ± 0.17 10.46 ± 0.11 –
b
11.81 ± 0.21
6.5 15.18 ± 0.13 18.38 ± 0.16 20.92 ± 0.15 21.92 ± 0.29
6.0 –
b
–
b
–
b
0.99 ± 0.01
a
Values for k
d
were determined according to the Guggenheim
method. Final concentrations after mixing were [CDase I-5] ¼ 10
ø’
M and [KCl] ¼ 0.2–1.0 M.
b
Not determined.
Dynamics of a CDase in the oligomeric state H S. Lee et al.
116 FEBS Journal 273 (2006) 109–121 ª 2005 The Authors Journal compilation ª 2005 FEBS
the intrinsic capability of the N- and C-terminal
regions of the enzyme to form dodecamers at pH 7.0
and dimers at pH 6.0. The observed isoelectric point
of CDase I-5 (pI 7.8) in the C-terminal domain (amino
acid residues 505–583) was much higher than those of
other maltogenic amylases that exist in a monomer–
dimer equilibrium [8]. CDase I-5 has four histidine res-
idues (H539, H547, H552, and H563) in the C-terminal
region that were thought to have pK
a
values within the
range of 5.0–7.0; thus, modifying the structure of
CDase I-5 by protonation and deprotonation might
allow these residues to interact with the charged
groups of other residues. The isoelectric point of
CDase I-5 (pI 7.8) suggests that a decrease in pH from
7.0 to 6.0 would increase the number of positively
charged residues in the C-terminal region, particularly
those arising from protonation of histidinyl groups.
The results indicated that the electrical charge of the
amino acid residues was involved in a self-association
process leading to the formation of dodecamers. The
force driving the dissociation process was very likely to
be the destabilizing effect of electrostatic repulsion
between positively charged residues in the C-terminal
domain at low pHs. Thus, H539 that is in the center
of the C-terminal region plays an important role
in determining the quaternary structure of the dode-
camer. Four histidine residues are present in the C-ter-
minal region of CDase I-5, while only one histidine
residue is found in the corresponding region of ThMA,
which is mostly present in the dimeric form. Oligome-
rization states of certain proteins have been reported
to be pH dependent [7,11,12]. For example, bovine
F
1
-ATPase inhibitor protein, IF
1
, forms tetramers at
pH 8.0, while the protein is predominantly in the
dimeric form below pH 6.5 [11,12]. The protonation of
histidine residues appears to modify the structure of
IF
1
and play an important role in the interconversion
between dimers and tetramers, given that the mutation
of this residue to lysine abolishes the pH-dependent
oligomerization without an alteration of enzyme
activity [11]. A 10-kDa light chain subunit of the cyto-
plasmic dynein complex LC8 shows a reversible mono-
mer–dimer equilibrium at pH 7.0, but the dimers
dissociate into monomers at lower pHs, with a trans-
ition midpoint at pH 4.8 [13]. This was explained by
the titration of a histidine pair at the interface of the
dimer. d-amino acid transaminase undergoes a reversi-
ble process of dissociation/association that is pH-
dependent [7], but this occurs at rates much slower
than those of CDase I-5.
In 1.0 m KCl solution, the dodecamerization degree
of CDase I-5 decreased to 29% and the activity on
b-cyclodextrin decreased to 66% in parallel with the
concentration of the dodecamer [8]. We have previ-
ously shown that the dodecameric form of the enzyme
exhibited a catalytic efficiency for b-cyclodextrin that
was $10 times higher than that of the dimeric form
[3]. These results correlated with the data shown in
Table 1. Furthermore, the far-UV CD spectra of
CDase I-5 were similar in the absence or presence of
1.0 m KCl (Fig. 7), indicating that the conformational
changes were negligible in terms of secondary struc-
ture.
Unlike the pH-dependent process that was slow
enough to enable monitoring by gel filtration chro-
matography of the interconversion of CDase I-5
between dodecamers and dimers, the dissociation
process of the enzyme was very fast in the presence
of KCl at pH 7.0. Therefore, the salt-induced disso-
ciation of CDase was investigated using a stopped-
flow apparatus. The rate constant of dissociation
(k
d
) from dodecamers into dimers was 7.99 s
)1
, and
the dissociation process was completed within sec-
onds. Stevens et al. [14] reported that class Sigma
glutathione S-transferase lost 60% of its catalytic
activity and a single tryptophan residue per subunit
became partly exposed when NaCl was added at
concentrations up to 2 m. They reported that no sig-
nificant change was detected either in the secondary
structure of the protein according to far-UV CD
data or in the size of the protein determined by size-
exclusion HPLC. They suggested that the change
might occur either at or near the active site. How-
ever, in the case of CDase I-5, when the protein dis-
sociated from dodecamers to dimers as shown by gel
filtration chromatography, the activity on b-cyclo-
dextrin decreased to 66%, but the activity on soluble
starch increased by 160% (data not shown). Large
substrates such as soluble starch seemed to be able
to access dimeric CDase more easily than the
dodecameric form owing to less steric hindrance.
These results suggested that the effect of salts on the
oligomeric state of CDase I-5 correlated with the
dissociation of the dodecameric form of the enzyme.
In conclusion, dimerization or oligomerization is a
physical property common to proteins. The assembly
of supramolecules is an alternative mechanism for the
formation of a large and stable dynamic structure
without increasing genome size in biological systems
[1]. CDase I-5 existed as dodecamer formed from two
hexamers of 3D domain-swapped dimeric units. The
results obtained in this study show that the associ-
ation/dissociation process of dodecameric CDase I-5
was modulated by pH and salt concentration. Dissoci-
ation of wild-type CDase I-5 into dimers rarely hap-
pened at pH 7, but it could be promoted by KCl. The
H S. Lee et al. Dynamics of a CDase in the oligomeric state
FEBS Journal 273 (2006) 109–121 ª 2005 The Authors Journal compilation ª 2005 FEBS 117
mutagenesis studies of the enzyme revealed that the
dodecamerization of dimeric CDase I-5 was mediated
by the protonation of H539 at the C-terminus. Dodec-
amerization would expand the opportunities for the
regulation of an enzyme by providing a number of
functional advantages, such as high stability and con-
trol over the accessibility and specificity of active sites.
The evolutionary role of supramolecular assembly is
likely to be associated with the adaptation of proteins
to a harsh alkaline environment by the formation of
stable and dynamic structures.
Experimental procedures
Protein purification
Gene cloning and overproduction of CDase I-5 were car-
ried out as described previously [15]. E. coli MC1061 car-
rying the CDase I-5 gene on pUC18 was cultured in a
5-L fermentor jar (KF-5 L, Korea Fermentor Co. Ltd) at
37 °C in Luria-Bertani broth containing ampicillin and
was harvested in the late log phase. The enzyme was
purified by ammonium sulfate precipitation followed by
chromatography using a Q-Sepharose column (Amersham
Pharmacia Biotechnology, Uppsala, Sweden) and a
DEAE-Toyopearl 650 m column (Tosoh Corporation,
Tokyo, Japan).
Enzyme assay
Hydrolytic activity of CDase I-5 was measured as described
before [16] with some modifications. A solution of sub-
strate was prepared in 50 mm sodium phosphate buffer
(pH 7.5). Enzyme digest was composed of 250 lLof1%
(w/v) b-cyclodextrin (Sigma Chemical Co., St. Louis, MO,
USA) or soluble starch (Showa Chemical Inc., Tokyo,
Japan) solution as substrates, 200 lL of reaction buffer,
and 50 lL of properly diluted enzyme solution. Reaction
mixture was prewarmed at 50 °C for 5 min, then diluted
enzyme solution was added and the mixture incubated for
10 min. The reaction was stopped by adding 0.5 lLof
100 mm NaOH solution. Aliquots (200 lL) of the enzyme
digest were taken and added to 200 mL of copper-bicin-
choninate working reagent [17]. One unit (U) of enzyme
activity was defined as the amount of enzyme that pro-
duced one micromole of maltose equivalent.
Site-directed mutagenesis
Site-directed mutagenesis was carried out to replace a histi-
dine residue with valine using a QuikChange site-directed
mutagenesis kit (Stratagene, La Jolla, CA, USA) and a
PE9600 thermal cycler (Perkin-Elmer, Norwalk, CT, USA).
Mutants were made by altering His49 to Val49, His89 to
Val89, and His539 to Val539 using the following primers:
for the H49V mutant, 5¢-AGTACATGTGGGACGTCAC
CATGGAGTATGTCCC-3¢ (forward) and 5¢-GGGACAT
ACTC CATGGTGACGTCCCACATGTACT-3¢ (reverse);
for the H89V mutant, 5¢-TCTGCTGCAGCA GGGTGTT
GAGAAGCGCTGGATG-3¢ (forward) and 5¢-CATCCAG
CGCTTCTCAACACCCT GCTGCAGCAGA-3¢ (reverse);
for the H539V mutant, 5¢-CGACAAGGCGGGCGTC
ACGTTA ACGCTGCCTGTCC-3¢ (forward) and 5¢-GG
ACAGGCAGCGTTAACGTGACGCCCGCCTTGTCG-3¢
(reverse). PCR was performed under the following condi-
tions: denaturation at 95 °C for 30 s followed by 18 cycles
of denaturation at 95 °C for 30 s, annealing at 55 °C for
1 min, and extension at 68 °C for 2 min. After digestion
with DpnI, the amplified DNA fragments were phosphoryl-
ated and ligated with T4 DNA ligase. Transformation and
the screening of the resulting transformants were carried
out by the calcium chloride [18] and iodine methods [19],
respectively. All mutations were confirmed by sequence
analysis using the dideoxy chain termination method and
an ABI377 PRISM DNA sequencer (Perkin-Elmer, Nor-
walk, CT, USA).
Gel filtration chromatography
Chromatography using a Superdex 200 H 10/30 column
(Amersham Pharmacia Biotech., Uppsala, Sweden) was car-
ried out to separate the dodecameric and dimeric forms of
CDase I-5 at different pH values or in 1 m KCl. Sample (100
lL) was applied to the column equilibrated with an appropri-
ate buffer and eluted at a flow rate of 0.4 mLÆmin
)1
. For
determination of dissociation rate constant at pH 6, 3–6 lm
(0.2–0.4 mgÆmL
)1
) of CDase I-5 were used. For determin-
ation of equilibrium constant at pH 7, various amounts of
wild-type and mutant CDase I-5 were used in the range of
0.72–11.9 lm. Thyroglobulin (669 kDa), apoferritin
(443 kDa), b-amylase (200 kDa), alcohol dehydrogenase
(ADH; 150 kDa), bovine serum albumin (BSA; 66 kDa),
and carbonic anhydrase (29 kDa) were used to estimate the
apparent molecular weight of the enzyme.
Sedimentation equilibrium and velocity analytical
ultracentrifugation
Sedimentation equilibrium analytical ultracentrifugation
was performed using a Beckman Optima XL-A analytical
ultracentrifuge (Beckman Coulter Inc., Fullerton, CA,
USA) equipped with a four-hole rotor with standard six-
channel cells at a rotor speed of 5000 r.p.m. The absorb-
ance-versus-radius distributions, A(r), were recorded at
280 nm. These were evaluated using the nonlinear regres-
sion method provided by the sigmaplot software (SPSS
Science, Chicago, IL, USA). The general equation used for
fitting the A(r) data was
Dynamics of a CDase in the oligomeric state H S. Lee et al.
118 FEBS Journal 273 (2006) 109–121 ª 2005 The Authors Journal compilation ª 2005 FEBS
AðrÞ¼
X
i
A
i
ðrÞ¼
X
i
A
i
ðr
0
Þexp iM
1
1 À
v Á q
0
ðÞx
2
r
2
Àr
2
0
ÀÁ
=2RT
ÂÃ
where i denotes the number of protomers per oligomer; A
i
,
the absorbance of the corresponding species;
v, the partial
specific volume of the protein (calculated as described by
Zamyatnin [20] and assumed to be independent of the state
of oligomerization); q
o
, the solvent density; x, the angular
velocity of the rotor; r
o
, the fixed radial position; R the gas
constant; and T the temperature.
Sedimentation velocity analytical ultracentrifugation was
performed using a Beckman Optima XL-A analytical ultra-
centrifuge (Beckman Coulter Inc., Fullerton, CA, USA)
equipped with a four-hole rotor with standard two-channel
cells at a rotor speed of 25000 r.p.m. Radial scans at
280 nm were taken every 5 min, and the sedimentation
coefficient was calculated from the movement of the sedi-
mentation boundary using the slavel program (Beckman
Coulter Inc.).
Evaluation of K
d
values
The dodecamer dissociation constant, k
d
, was estimated as
follows [21]. If the maximal amount of CDase I-5 dode-
camer is [Max] and the concentrations of dodecameric and
dimeric species are [Dod] and [Di], respectively, so that per-
centageDod ¼ 100[Dod]/[max], it follows that:
K
d
¼½Di
6
=½Dod¼6
6
ð½maxÀ½DodÞ
6
=½Dod
¼ 6
6
ð100Þ
À5
½max
5
ð100 À %DodÞ
6
=%Dod
¼ 4:6656 Â 10
À6
½max
5
ð100 À %DodÞ
6
=%Dod:
Hence,
LogðK
d
Þ¼5 Â Log½max
½À logð%Dod=4:6656  10
À6
ð100 À %DodÞ
6
Þ
Thus, a plot of log(%Dod/4.6656 · 10
)6
(100 – %Dod)
6
)
with respect to log[Max] will yield a straight line with a
slope of 5. When log(%Dod/4.6656 · 10
)6
(100 – %Dod)
6
) ¼
0, k
d
¼ [max]
5
.
Isothermal titration calorimetric analysis
Calorimetric assays were carried out using VP-ITC instru-
ments (MicroCal Inc., USA) as described by Todd et al.
[22]. Reaction cells (1.4428 mL) were filled with degassed
solutions and equilibrated at 37 °C. Stirring speed and ref-
erence power was 310 r.p.m. and 15 lCalÆs
)1
, respectively.
Once thermal equilibrium was reached, CDase I-5 (2.5 nm)
incubated with increasing amount of b-CD was injected
every 3 min and a decrease in instrumental thermal power
was observed following each injection. The change in
instrumental thermal power after an injection was comple-
ted in several minutes. Data collection at each substrate
concentration was truncated in 3 min and another injection
was made. The thermal power obtained was averaged for
30 s prior to the subsequent injection to obtain the most
accurate power measurements. These rates were corrected
for DH
app
and the data were fitted to the Michaelis-Menten
equation using nonlinear least-square regression to give the
kinetic constants.
Fluorescence emission spectrophotometry
The protein fluorescence emission spectrum was monitored
at 25 °C in an F-4500 fluorescence spectrophotometer
(Hitachi Ltd, Tokyo, Japan) using a 1-cm path length
quartz cuvette. The enzyme solutions were prepared in
50 mm sodium phosphate buffer (pH 7.0). When the final
protein concentration was 15 lm, intrinsic fluorescence
measurement of the protein solution was carried out with
excitation at 295 nm and emission scanning in the range of
290–450 nm according to the KCl concentration [9]. The
excitation and emission bandwidths were 5 nm, and the
scan speed was 1200 nmÆmin
)1
.
CD measurements
CD spectra of CDase I-5 in different concentrations of KCl
were obtained using a Jasco J-715 spectropolarimeter (Jasco
Inc., Tokyo, Japan). The secondary structure of the enzyme
at a concentration of 200 lgÆmL
)1
in 300 lLof50mm
sodium phosphate buffer (pH 7.0) was determined by CD
spectroscopy in the far-UV spectral region (190–250 nm)
using a cell with a 0.1 cm path length, at 25 °C [23]. The
width of the spectral band was 2 nm, and the time constant
was 2 s at 25 °C. The data were expressed as molar elliptic-
ity, h (mdeg). The ellipticity at 222 nm was examined to
calculate the a-helix content by the method of Chen [24].
Stopped-flow spectrophotometry
Exposed tryptophan residues were detected by measuring
the amount of FRET using an SFM-4 stopped-flow
apparatus (Bio-Logic, Claix, France) [25,26]. Stopped-flow
experiments were carried out mixing two or more solutions
rapidly and making the mixture reach an optical observa-
tion point as quickly as possible. A photomultiplier tube
cut-off filter (324 nm) and an FC-20 cuvette were used. The
voltage limit in ADC was ± 10. All experiments were car-
ried out in 50 mm sodium phosphate buffer (pH 7.0) at
25 °C. The enzyme concentration and the volume after
mixing were 50 lm and 320 lL, respectively.
Guggenheim plot method
The Guggenheim method was used to compare the shape
of the exponential curve at one time (t) with that at another
time (t + Dt). ‘A’ is the amount of reactant at time t;
H S. Lee et al. Dynamics of a CDase in the oligomeric state
FEBS Journal 273 (2006) 109–121 ª 2005 The Authors Journal compilation ª 2005 FEBS 119
DA is the amount of A at time (t + Dt); and Dt is a con-
stant and arbitrary time interval that was approximately 1/
3–1/2 of the period over which the reaction was studied.
Given that A – DA ¼ (constant) exp(– kt) and taking
logarithms to base e on each side produces the following:
lnðA À DAÞ¼ðconstantÞÀkt; or lnðA À DAÞ¼Àkt þ constant:
Therefore, the graph of ln(A – DA) versus time (t) yields a
straight line with a slope equal to – k.
For a pseudo-first-order reaction, a plot of logA vs. time
should be linear with a slope of – kt/2.303 based on the fol-
lowing equation:
log DA ¼ðÀk=2:303Þt þ constant;
where k is the pseudo-first-order rate constant. Thus, rate
constants can be calculated from the gradient of the plot [10].
Acknowledgements
This study was supported by the Korea Science and
Engineering Foundation through the KOSEF-Japan
Basic Scientific Promotion Program (grant F01-2002-
000-20016-0) and in part by the Biogreen 21 project of
the Rural Development Administration. We acknow-
ledge the financial support of the Brain Korea 21 Pro-
ject in the form of scholarships to J S. Kim.
References
1 Marianayagam NJ, Sunde M & Matthews JM (2004)
The power of two: protein dimerization in biology.
Trends Biochem Sci 29, 618–625.
2 Bennett MJ & Eisenberg D (2004) The evolving role of 3D
domain swapping in proteins. Structure 12, 1339–1341.
3 Kim JS, Cha SS, Kim HJ, Kim TJ, Ha NC, Oh ST,
Cho HS, Cho MJ, Kim MJ, Lee HS et al. (1999) Crys-
tal structure of a maltogenic amylase: provides insights
into a catalytic versatility. J Biol Chem 274, 26279–
26286.
4 Park KH (2001) The multisubstrate specificity and the
quaternary structure of cyclodextrin-/pullulan-degrading
enzymes. J Appl Glycosci 48, 293–299.
5 Park KH, Kim TJ, Cheong TK, Kim JW, Oh BH &
Svensson B (2000) Structure, specificity and function of
cyclomaltodextrinase: a multispecific enzyme of the
a-amylase family. Biochim Biophys Acta 1478, 165–185.
6 Lee HS, Kim MS, Cho HS, Kim JI, Kim TJ, Choi JH,
Park C, Lee HS, Oh BH & Park KH (2002) Cyclomal-
todextrinase, neopullulanase, and maltogenic amylase
are nearly indistinguishable from each other. J Biol
Chem 277, 21891–21897.
7 Kishimoto K, Yasuda C & Manning JM (2000) Reversi-
ble dissociation/association of d-amino acid transami-
nase subunits: properties of isolated active dimers and
inactive monomers. Biochemistry 39, 381–387.
8 Park KH, Lee HS, Kim TJ, Cheong KA, Nguyen VD,
Min MJ, Cho HY, Kim YW, Park CS, Oh BH et al.
(2002) N- and C-terminal region mediated oligomeriza-
tion of the cyclodextrin-/pullulan degrading enzymes.
Biologia 57 Suppl. 11, 87–92.
9 Inouye K, Hiromi T & Hiroshi O (2000) States of tryp-
tophanyl residues and stability of recombinant human
matrix metalloproteinase 7 (matrilysin) as examined by
fluorescence. J Biochem 128, 363–369.
10 Jonnalngadda SB & Gollapalli NR (2000) Kinetics of
reduction of toluidine blue with sulfite-kinetic salt effect
in elucidation of mechamism. J Chem Edu 77, 506–509.
11 Cabezon E, Jonathan P, Butler G, Runswick MJ &
Walker JE (2000) Modulation of the oligomerization
state of the bovine F1-ATPase inhibitor protein, IF1,
by pH. J Biol Chem 275, 25460–25464.
12 Gordon-Smith DJ, Carbajo RJ, Yang JC, Videler H,
Runswick MJ, Walker JE & Neuhaus D (2001) Solution
structure of a C-terminal coiled-coil domain from
bovine IF1: the inhibitor protein of F1-ATPase. J Mol
Biol 308, 325–339.
13 Barbar E, Kleinman B, Imhoff D, Li M, Hays TS &
Hare M (2001) Dimerization and folding of LC8, a
highly conserved light chain of cytoplasmic dynein.
Biochemistry 40, 1596–1605.
14 Stevens JM, Armstrong RN & Dirr HW (2000) Elec-
trostatic interactions affecting the active site of class
Sigma glutathione S-transferase. Biochem J 347,
193–197.
15 Kim TJ, Shin JH, Oh JH, Kim MJ, Lee SB, Ryu S,
Kwon K, Kim JW, Choi EH, Robyt JF et al. (1998)
Analysis of the gene encoding cyclomaltodextrinase
from alkalophilic Bacillus sp. I-5 and characterization
of enzymatic properties. Arch Biochem Biophys 353,
221–227.
16 Kim MJ, Park WS, Lee HS, Kim TJ, Shin JH, Yoo
SH, Cheong TK, Ruy SR, Kim JC, Kim JW et al.
(2000) Kinetics and inhibition of cyclomaltodextrinase
from alkalophilic Bacillus sp. I-5. Arch Biochem Biophys
373, 110–115.
17 Fox JD & Robyt JF (1991) Miniaturization of three
carbohydrate analyses using a microsample plate reader.
Anal Biochem 195, 93–96.
18 Sambrook J, Fritsch EF & Maniatis T (1989) Molecular
Cloning: a Laboratory Manual, 2nd edn. Cold Spring
Harbor Laboratory, Cold Spring Harbor, NY.
19 Kim IC, Cha JH, Kim JR, Jang SY, Seo BC, Cheong
TK, Lee DS, Choi YD & Park KH (1992) Catalytic
properties of the cloned amylase from Bacillus licheni-
formis. J Biol Chem 267, 22108–22114.
20 Zamyatnin AA (1984) Amino acid, peptide, and protein
volume in solution. Annu Rev Biophys Bioeng 13, 145–
165.
21 Manning LR, Jenkins WT, Hess JR, Vandegriff K,
Winslow RM & Manning JM (1996) Subunit dissociations
Dynamics of a CDase in the oligomeric state H S. Lee et al.
120 FEBS Journal 273 (2006) 109–121 ª 2005 The Authors Journal compilation ª 2005 FEBS
in natural and recombinat hemoglobins. Protein Sci 5,
775–781.
22 Todd MJ & Gomez J (2001) Enzyme kinetics deter-
mined using calorimetry: a general assay for enzyme
activity? Anal Biochem 296, 179–187.
23 Lakkis J & Villota R (1992) Effect of acylation on sub-
structural properties of proteins: a study using fluores-
cence and circular dichroism. J Agric Food Chem 40,
553–560.
24 Chen YH (1972) Determination of the secondary struc-
ture of proteins by circular dichroism and optical rota-
tory dispersion. Biochemistry 11, 4120–4133.
25 Erland JF (2002) Stopped-flow kinetic analysis of long-
chain fatty acid dissociation from bovine serum albu-
min. J Biochem 363, 809–815.
26 Shin JS & MH (2002) Kinetic dissection of alpha 1-anti-
trypsin inhibition mechanism. J Biol Chem 277 , 11629–
11635.
H S. Lee et al. Dynamics of a CDase in the oligomeric state
FEBS Journal 273 (2006) 109–121 ª 2005 The Authors Journal compilation ª 2005 FEBS 121