The Global Technology Revolution 2020 doc
Bạn đang xem bản rút gọn của tài liệu. Xem và tải ngay bản đầy đủ của tài liệu tại đây (1.19 MB, 42 trang )
Bio/Nano/Materials/Information Trends, Drivers, Barriers,
and Social Implications
Richard Silberglitt • Philip S. Antón • David R. Howell • Anny Wong
with S. R. Bohandy, Natalie Gassman, Brian A. Jackson, Eric Landree,
Shari Lawrence Pfleeger, Elaine M. Newton, and Felicia Wu
Prepared for the
National Intelligence Council
EXECUTIVE SUMMARY
Approved for public release; distribution unlimited
The RAND Corporation is a nonprofit research organization providing objective analysis
and effective solutions that address the challenges facing the public and private sectors
around the world. RAND’s publications do not necessarily reflect the opinions of its
research clients and sponsors.
R
®
is a registered trademark.
© Copyright 2006 RAND Corporation
All rights reserved. No part of this book may be reproduced in any form by any electronic or
mechanical means (including photocopying, recording, or information storage and retrieval)
without permission in writing from RAND.
Published 2006 by the RAND Corporation
1776 Main Street, P.O. Box 2138, Santa Monica, CA 90407-2138
1200 South Hayes Street, Arlington, VA 22202-5050
4570 Fifth Avenue, Suite 600, Pittsburgh, PA 15213
RAND URL: />To order RAND documents or to obtain additional information, contact
Distribution Services: Telephone: (310) 451-7002;
Fax: (310) 451-6915; Email:
Library of Congress Cataloging-in-Publication Data
The Global technology revolution 2020, executive summary : bio/nano/materials/information trends, drivers,
barriers, and social implications / Richard Silberglitt [et al.].
p. cm.
“MG-475.”
Includes bibliographical references.
ISBN 0-8330-3910-5 (pbk. : alk. paper)
1. Nanotechnology. I. Silberglitt, R. S. (Richard S.).
T174.7.G584 2006
338.9'260905—dc22
2006009729
The research described in this report was prepared for the National Intelligence Council.
iii
Foreword
e National Intelligence Council (NIC) sponsored this study by the RAND Corporation to
inform the NIC’s 2020 project
1
and help provide US policymakers with a view of how world
developments could evolve, identifying opportunities and potentially negative developments
that might warrant policy action. From June 2004 through August 2005, RAND undertook
the challenging task of identifying technologies and applications that have the potential for
significant and dominant global impacts by 2020.
As RAND found in its prior study for the NIC, e Global Technology Revolution
(Antón, Silberglitt, and Schneider, 2001), technology will continue to accelerate and integrate
developments from multiple scientific disciplines in a “convergence” that will have profound
effects on society. RAND’s new study, however, has delved further into social impacts and
concluded that
Regional and country-specific differences in social need and science and technology
(S&T) capabilities are resulting in differences in how technology is revolutionizing
human affairs around the world,
Regional differences in public opinion and issues may strongly influence technology
implementation,
Maintaining S&T capacity requires consideration and action across a large number of
social capabilities and stability dimensions,
Capacity building is an essential component of development, and
Public policy issues relating to some technology applications will engender strong public
debate.
e implications of these findings are important to US policymakers. For example, while
the United States remains a leader in S&T capability and innovation, it is not the sole leader
and thus will not always dominate every technical area. Also, many technologies will evolve
globally in ways that differ from their evolution in the United States, so we cannot merely
apply a US view as a cookie cutter to understanding how technology will change the world. In
addition, US understanding of potential technological threats from foreign powers requires a
broad understanding not just of S&T skills and capabilities but also the institutional, human,
1
See for further information on the NIC 2020 Project and its final
report, Mapping the Global Future.
•
•
•
•
•
iv The Global Technology Revolution 2020
and physical capacity to exploit technological opportunities. Finally, innovative combinations
of new and existing technologies can help to meet region-specific needs despite their lack of
use in the US sector.
I commend this report to you as a resource for understanding how S&T and social issues
interact and depend not only on technological advances but also on the broader capabilities of
countries that seek development and economic rewards through S&T exploitation. As impor-
tant as S&T is today to the United States and the world, it will become even more important
in the future.
Dr. Lawrence K. Gershwin
National Intelligence Officer for Science and Technology
Office of the Director of National Intelligence
v
Preface
Various technologies (including biotechnology, nanotechnology [broadly defined], materi-
als technology, and information technology) have the potential for significant and dominant
global impacts by 2020. is report is based on a set of foresights (not predictions or forecasts)
1
into global technology trends in biotechnology, nanotechnology, materials technology, and
information technology and their implications for the world in the year 2020. ese foresights
were complemented by analysis of data on current and projected science and technology capa-
bilities, drivers, and barriers in countries across the globe. For a more detailed discussion of the
material described in this report, including further documentation and references, the reader
is strongly recommended to review the in-depth analyses from this study.
2
is work was sponsored by the National Intelligence Council (NIC) to inform its pub-
lication Mapping the Global Future: Report of the National Intelligence Council’s 2020 Project
Based on Consultations with Nongovernmental Experts Around the World, December 2004. In
addition, funding was provided by the Intelligence Technology Innovation Center (ITIC) and
the U.S. Department of Energy. It is a follow-on report to a RAND Corporation report, e
Global Technology Revolution (Antón, Silberglitt, and Schneider, MR-1307-NIC, 2001), which
was sponsored by the NIC to inform its 2000 document, Global Trends 2015. Global Trends
2015 and the 1996 NIC document Global Trends 2010 identified key factors that appeared
poised to shape the world by 2015 and 2010, respectively.
is report should be of interest to policymakers, Intelligence Community analysts, tech-
nology developers, the public at large, and regional experts interested in potential global tech-
nology trends and their broader social effects.
is project was conducted jointly in the Intelligence Policy Center and the Acquisition
and Technology Policy Center of the RAND National Security Research Division (NSRD).
NSRD conducts research and analysis for the Office of the Secretary of Defense, the Joint
Staff, the Unified Combatant Commands, the Department of the Navy, the Marine Corps,
the defense agencies, and the Defense Intelligence Community, allied foreign governments,
and foundations.
1
A foresight activity examines trends and indicators of possible future developments without predicting or describing a
single state or timeline and is thus distinct from a forecast or scenario development activity (Salo and Cuhls, 2003).
2
See Silberglitt, Antón, Howell, and Wong (2006), available on the CD-ROM included with the hard copies of this report,
or from the RAND Web site at />vi The Global Technology Revolution 2020
For further information regarding this report, contact its authors or the Intelligence Policy
Center Director, John Parachini, at RAND Corporation, 1200 South Hayes Street, Arlington,
VA 22202-5050; by telephone at 703.413.1100 x5579, or by email at john_parachini@rand.
org. For more information on RAND’s Acquisition and Technology Policy Center, contact the
Director, Philip Antón. He can be reached by email at ; by telephone
at 310.393.0411, x7798; or by mail at RAND Corporation, 1776 Main Street, P.O. Box 2138,
Santa Monica, CA 90407-2138. More information about RAND is available at www.rand.org.
Contents
vii
Foreword iii
Preface
v
Figures and Tables
ix
Summary
xi
Acknowledgments
xiii
Executive Summary
1
Introduction
1
Some Top Technology Applications for 2020
2
Nations Will Continue to Vary in eir Capacity to Reap the Benefits of Technology
Applications
4
What Countries Will Be Able to Acquire Which Technology Applications by 2020?
5
What Drivers and Barriers Affect ese Countries’ Ability to Implement the Technology
Applications ey Could Acquire?
7
Different Countries, Different Issues: e Capacity of Various Nations to Use Technology
Applications to Address National Problems
12
Why Countries Prioritize Economic Growth
13
Countries at Various Levels of Development Prioritize Strengthening the Military
14
Individual Health as a National Priority Generally Follows Public Health
14
Countries’ Capacity to Achieve Science and Technology Goals
14
Scientifically Lagging Countries
15
Scientifically Developing Countries
16
Scientifically Proficient Countries
18
Scientifically Advanced Countries
20
e Science and Technology Path to 2020
22
Accelerated Technology Development Will Continue
22
Countries Will Benefit in Considerably Different Ways
23
Action Will Be Required to Maintain a High Level of S&T Capacity
23
Countries at Lack Capacity Will Need to Build It
23
Certain Technology Applications Will Spark Heated Public Debate
24
Consideration Could Head Off Problems and Maximize Benefits
24
viii The Global Technology Revolution 2020
A Few Words in Conclusion 24
Selected Bibliography
27
Figures and Tables
ix
Figures
1. Selected Countries’ Capacity to Acquire the Top 16 Technology Applications 6
2. Mapping of Country Scientific Capability Rating to Top 16 Technology Applications
7
3. Drivers and Barriers in Selected Countries
9
4. Selected Countries’ Capacity to Implement the Top 16 Technology Applications
11
Tables
1. Technical and Implementation Feasibility of Illustrative 2020 Technology
Applications
4
2. Representative Countries Across Regions of the World Selected for Analysis
5
xi
Summary
is report presents the results from a set of foresights into global technology trends and their
implications for the world in the year 2020. Areas of particular importance include biotech-
nology, nanotechnology, materials technology, and information technology. A sample of 29
countries across the spectrum of scientific advancement (low to high) was assessed with respect
to the countries’ ability to acquire and implement 16 key technology applications (e.g., cheap
solar energy, rural wireless communications, genetically modified crops). e study’s major
conclusions include the following:
Scientifically advanced countries, such as the United States, Germany, and Japan, will be
able to implement all key technologies assessed.
Countries that are not scientifically advanced will have to develop significant capacity
and motivation before barriers to technology implementation can be overcome.
Public policy issues in certain areas will engender public debate and strongly influence
technology implementation.
Many technology trends and applications have substantial momentum behind them and
will be the focus of continued research and development, consideration, market forces, and
debate. ese technologies will be applied in some guise or other, and the effects could be dra-
matic, including significant improvements in human lifespan, reshuffling of wealth, cultural
amalgamation or innovation, and reduced privacy.
•
•
•
xiii
Acknowledgments
We would like to thank Lawrence K. Gershwin, Maj Gen Richard L. Engel (Ret.), William A.
Anderson, Brian Shaw, and Julianne Chesky of the National Intelligence Council for their
wonderful support and encouragement throughout this study.
e authors thank the following RAND regional experts for very helpful discussions of
social and public policy issues, development needs, technological status, and the environment
for implementation of technology applications: Keith Crane, Heather Gregg, Nina Hachigian,
Rollie Lal, Kevin O’Brien, William Overholt, D.J. Peterson, Angel Rabasa, and Somi Seong.
We also acknowledge the helpful discussions of quantum computing and cryptography we had
with Calvin Shipbaugh and the several useful inputs on the status of science and technology
in India from Ramesh Bapat, and are extremely grateful to Michael Tseng for quantifying the
country data on capacity to acquire, drivers, and barriers.
e authors owe a special debt of gratitude to Robert Anderson, Steve Berner, Jennifer
Brower, Ted Gordon, and Stephen Larrabee for their insightful reviews of this study and for
several important suggestions that contributed greatly to improving the report. We also thank
Linda Barron for her help in compiling, formatting, and producing the manuscript. Finally,
we acknowledge the outstanding efforts of Stephen Bloodsworth in designing and producing
the maps and quadrant charts.
1
Executive Summary
Introduction
e world is in the midst of a global technology revolution. For the past 30 years, advances in
biotechnology, nanotechnology, materials technology, and information technology have been
occurring at an accelerating pace, with the potential to bring about radical changes in all
dimensions of life. e pace of these developments shows no sign of abating over the next 15
years, and it appears that their effects will be ever more remarkable. e technology of 2020
will integrate developments from multiple scientific disciplines in ways that could transform
the quality of human life, extend the human lifespan, change the face of work and industry,
and establish new economic and political powers on the global scene.
While people often do not understand a technology itself, they can often understand
what that technology, when applied, might do for them and the societies in which they live
when an application concept is presented to them. Actual adoption, however, is not necessarily
automatic because of the confluence of economic, social, political, and other mitigating fac-
tors. Such technology applications, designed to accomplish specific functions, and their miti-
gating factors are the focus of our study.
Increasingly, such applications entail the integration of multiple technologies. New
approaches to harnessing solar energy, for instance, are using plastics, biological materials, and
nanoparticles. e latest water purification systems use nanoscale membranes together with
biologically activated and catalytic materials. Technology applications such as these may help
to address some of the most significant problems that different nations face—those involving
water, food, health, economic development, the environment, and many other critical sectors.
While extensive, this technology revolution will play out differently around the globe.
Although a technology application may be technically possible by 2020, not all countries will
necessarily be able to acquire it—much less put it widely to use—within that time frame. An
adequate level of science and technology (S&T) capacity is the first requirement for many
sophisticated applications. A country might obtain a technology application through its domes-
tic research and development (R&D) efforts, a technology transfer, or an international R&D
collaboration—all various indicators of a country’s S&T capacity. Or it could simply purchase
a commercial off-the-shelf system from abroad. But many countries will not have achieved the
necessary infrastructure or resources in 15 years to do such things across the breadth of the
technology revolution.
2 The Global Technology Revolution 2020
What is more, the ability to acquire a technology application does not equal the ability to
implement it. Doing research or importing know-how is a necessary initial step. But success-
ful implementation also depends on the drivers within a country that encourage technological
innovation and the barriers that stand in its way. Such drivers and barriers reflect a country’s
institutional, human, and physical capacity;
1
its financial resources; and its social, political,
and cultural environment. Each of these factors plays a part in determining a nation’s ability to
put a new technology application into the hands of users, cause them to embrace it, and sup-
port its widespread use over time.
For these reasons, different countries will vary considerably in their ability to utilize tech-
nology applications to solve the problems they confront. To be sure, not all technology applica-
tions will require the same level of capacity to acquire and use. But even so, some countries will
not be prepared in 15 years to exploit even the least demanding of these applications—even
if they can acquire them—whereas other nations will be fully equipped to both obtain and
implement the most demanding.
Some Top Technology Applications for 2020
Of 56 illustrative applications that we identified as possible by 2020, 16 appear to have the
greatest combined likelihood of being widely available commercially, enjoying a significant
market demand, and affecting multiple sectors (e.g., water, food, land, population, governance,
social structure, energy, health, economic development, education, defense and conflict, and
environment and pollution).
Cheap solar energy: Solar energy systems inexpensive enough to be widely available to devel-
oping and undeveloped countries, as well as economically disadvantaged populations.
Rural wireless communications: Widely available telephone and Internet connectivity with-
out a wired network infrastructure.
Communication devices for ubiquitous information access: Communication and storage
devices—both wired and wireless—that provide agile access to information sources any-
where, anytime. Operating seamlessly across communication and data storage protocols,
these devices will have growing capabilities to store not only text but also meta-text with
layered contextual information, images, voice, music, video, and movies.
Genetically modified (GM) crops: Genetically engineered foods with improved nutritional
value (e.g., through added vitamins and micronutrients), increased production (e.g., by
tailoring crops to local conditions), and reduced pesticide use (e.g., by increasing resis-
tance to pests).
Rapid bioassays: Tests that can be performed quickly, and sometimes simultaneously, to
verify the presence or absence of specific biological substances.
1
Institutional capacity includes honest and effective systems of governance, banking and finance, law, education, and
health. Human capacity entails the quality and quantity of a country’s educated and skilled personnel, as well as the level of
education and scientific literacy of its people. Physical capacity involves the quality and quantity of critical infrastructures—
e.g., transport and freight networks, schools, hospitals, research facilities, and utilities.
•
•
•
•
•
Executive Summary 3
Filters and catalysts: Techniques and devices to effectively and reliably filter, purify, and
decontaminate water locally using unskilled labor.
Targeted drug delivery: Drug therapies that preferentially attack specific tumors or patho-
gens without harming healthy tissues and cells.
Cheap autonomous housing: Self-sufficient and affordable housing that provides shelter
adaptable to local conditions, as well as energy for heating, cooling, and cooking.
Green manufacturing: Redesigned manufacturing processes that either eliminate or greatly
reduce waste streams and the need to use toxic materials.
Ubiquitous radio frequency identification (RFID) tagging of commercial products and indi-
viduals: Widespread use of RFID tags to track retail products from manufacture through
sale and beyond, as well as individuals and their movements.
Hybrid vehicles: Automobiles available to the mass market with power systems that
combine internal combustion and other power sources while recovering energy during
braking.
Pervasive sensors: Presence of sensors in most public areas and networks of sensor data to
accomplish real-time surveillance.
Tissue engineering: e design and engineering of living tissue for implantation and
replacement.
Improved diagnostic and surgical methods: Technologies that improve the precision of diag-
noses and greatly increase the accuracy and efficacy of surgical procedures while reducing
invasiveness and recovery time.
Wearable computers: Computational devices embedded in clothing or in other wearable
items, such as handbags, purses, or jewelry.
Quantum cryptography: Quantum mechanical methods that encode information for
secure transfer.
e technology applications we identified vary significantly in assessed technical feasi-
bility and implementation feasibility by 2020. Table 1 shows the range of this variation on a
matrix of 2020 technical feasibility versus 2020 implementation feasibility for all 56 technol-
ogy applications. Technical feasibility is defined as the likelihood that the application will be
possible on a commercial basis by 2020. Implementation feasibility is the net of all nontechnical
barriers and enablers, such as market demand, cost, infrastructure, policies, and regulations.
We based its assessment on rough qualitative estimates of the size of the market for the appli-
cation in 2020 and whether or not it raises significant public policy issues. e numbers in
parentheses are the number of sectors that the technology can affect, and the designation global
(G) or moderated (M) indicates our estimate, based on both the technical foresights and our
discussions with RAND regional experts, of whether the application will be diffused globally
in 2020 or will be moderated in its diffusion (i.e., restricted by market, business sector, coun-
try, or region).
•
•
•
•
•
•
•
•
•
•
•
4 The Global Technology Revolution 2020
Table 1
Technical and Implementation Feasibility of Illustrative 2020 Technology Applications
Niche market only
(– –)
May satisfy a need for a medium
or large market, but raises
significant public
policy issues
(–)
Satisfies a well-documented
need for a medium market and
raises no significant public
policy issues
(+)
Satisfies a well-documented
need for a large market and
raises no significant public
policy issues
(++)
Highly
feasible
(++)
• Chemical, biological, radiological,
or nuclear (CBRN) sensors on
emergency response teams (2,G)
• Genetic screening (2,G)
• GM crops (8,M)
• Pervasive sensors (4,G)
• Targeted drug delivery (5,M)
• Ubiquitous information access
(6,M)
• Ubiquitous RFID tagging (4,G)
• Hybrid vehicles (2,G)
• Internet (for purposes of
comparison) (7,G)
• Rapid bioassays (4,G)
• Rural wireless communications
(7,G)
Feasible
(+)
• GM animals for R&D (2,M)
• Unconventional transport (5,M)
• Implants for tracking and
identification (3,M)
• Xenotransplantation (1,M)
• Cheap solar energy (10,M)
• Drug development from
screening (2,M)
• Filters and catalysts (7,M)
• Green manufacturing (6,M)
• Monitoring and control for
disease management (2,M)
• Smart systems (1,M)
• Tissue engineering (4,M)
• Improved diagnostic and surgical
methods (2,G)
• Quantum cryptography (2,G)
Uncertain
(U)
• Commercial unmanned aerial
vehicles (6,M)
• High-tech terrorism (3,M)
• Military nanotechnologies (2,G)
• Military robotics (2,G)
• Biometrics as sole identification
(3,M)
• CBRN sensor network in cities
(4,M)
• Gene therapy (2,G)
• GM insects (5,M)
• Hospital robotics (2,M)
• Secure video monitoring (3,M)
• Therapies based on stem cell
R&D (5,M)
• Enhanced medical recovery (3,M)
• Immunotherapy (2,M)
• Improved treatments from data
analysis (2,M)
• Smart textiles (4,M)
• Wearable computers (5,M)
• Electronic transactions (2,G)
• Hands-free computer interface
(2,G)
• “In-silico” drug R&D (2,G)
• Resistant textiles (2,G)
• Secure data transfer (2,M)
Unlikely
(–)
• Memory enhancing drugs (3,M)
• Robotic scientist (1,M)
• “Super soldiers” (2,M)
• Chip implants for brain (4,M) • Drugs tailored to genetics (2,M)
• Cheap autonomous housing (6,G)
• Print-to-order books (2,G)
Highly
unlikely
(– –)
• Proxy-bot (3,M)
• Quantum computers (3,M)
• Genetic selection of offspring
(2,M)
• Artificial muscles and tissue (2,M) • Hydrogen vehicles (2,G)
Implementation Feasibility
Technical Feasibility
Nations Will Continue to Vary in Their Capacity to Reap the Benefits of
Technology Applications
Global diffusion of a technology application does not mean universal diffusion: Not every
nation in the world will be able to implement, or even acquire, all technology applications
by 2020. e level of direct S&T capacity may be markedly different from one country to
another. Within different geographical regions, countries also have considerable differences
that play into their ability. ese differences may include variations in physical size, natural
conditions (e.g., climate), and location (e.g., proximity to oceans and water). e size of the
population and demographics (e.g., birthrate) may vary dramatically between countries in a
single region. Countries may have very different types of government, economic systems, and
levels of economic development.
Executive Summary 5
e 29 countries we compared (Table 2) represent not only the world’s major geographi-
cal regions but also the range of national differences within them. We selected many of these
countries specifically as representative of groups of similar nations, trying not to include in a
single geographical area more than one country with similar characteristics. If several countries
in a given region were very large, for example, we brought in one that would grossly represent
all the large countries. If a number of other nations in the same region were small, we included
a representative small country.
What Countries Will Be Able to Acquire Which Technology Applications
by 2020?
Seven of the 29 countries we compared will be scientifically advanced through 2020. ey will
almost certainly have the S&T capacity to acquire all 16 of the top technology applications by
2020. e United States and Canada in North America, Germany in Western Europe, and
South Korea and Japan in Asia fall into this category. In Oceania, Australia takes its place on
this list, as does Israel in the Middle East. ese countries are in blue boxes in Figure 1.
Four of the 29 countries will be scientifically proficient through 2020. ey will very likely
have the necessary S&T capacity through 2020 to acquire 12 of the top 16 technology applica-
tions (see Figure 2). China and India in Asia, Poland in Eastern Europe and Russia represent
this group. ey are shown in green boxes in Figure 1.
Seven of the 29 countries will be scientifically developing through 2020. ey will have
sufficient S&T capacity through 2020 to acquire nine of the top 16 applications (see Figure 2).
2
From South America, Chile, Brazil, and Colombia fall into this group. Mexico in North
Table 2
Representative Countries Across Regions of the World Selected for Analysis
Asia Oceania
North Africa
and the
Middle East Europe Africa
North
America
Central and
South America
and the
Caribbean
China
India
Indonesia
Japan
South Korea
Nepal
Pakistan
Australia
Fiji
Egypt
Iran
Israel
Jordan
Georgia
Germany
Poland
Russia
Turkey
Cameroon
Chad
Kenya
South Africa
Canada
Mexico
United States
Brazil
Chile
Colombia
Dominican
Republic
NOTE: We recognize that there are many ways to assign countries to regional groupings. In this instance, we placed
Turkey in the European group because of the country’s long and sustained commitment to join the European
Union.
2
Colombia will not be able to acquire ubiquitous RFID tagging because its economy is much less involved in international
trade than the other countries in this group are, and its domestic and regional markets are unlikely to generate sufficient
demand for this technology application
6 The Global Technology Revolution 2020
America, Turkey in Europe, Indonesia in Asia, and South Africa in Africa are also included.
ese seven countries are shown in yellow boxes in Figure 1.
Eleven of the 29 countries will be scientifically lagging through 2020. ey will have only
enough S&T capacity to acquire five of the applications through 2020 (see Figure 2). Fiji in
Oceania; the Dominican Republic in the Caribbean; Georgia in Europe; Nepal and Pakistan
in Asia; Egypt, Iran, and Jordan in North Africa and the Middle East; and Kenya, Cameroon,
and Chad in Africa are in this group. ese countries are shown in red boxes in Figure 1.
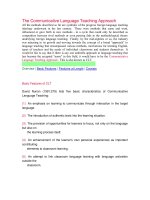
Figure 1
Selected Countries’ Capacity to Acquire the Top 16 Technology Applications
Blue countries
Green countries
Yellow countries
Red countries
Country category icons
China, PRC
TA:
1, 2, 4–11, 14,
16
Korea, Rep. of
TA:
1–16
Russia
TA:
1, 2, 4–11, 14,
16
Georgia
TA:
1, 2, 4, 6, 8
Turkey
TA:
1, 2, 4–6, 8–11
Poland
TA:
1, 2, 4–11, 14,
16
Germany
TA:
1–16
Canada
TA:
1–16
Japan
TA:
1–16
India
TA:
1, 2, 4–11, 14,
16
Nepal
TA:
1, 2, 4, 6, 8
Pakistan
TA:
1, 2, 4, 6, 8
Iran
TA:
1, 2, 4, 6, 8
Jordan
TA:
1, 2, 4, 6, 8
Israel
TA:
1–16
Egypt
TA:
1, 2, 4, 6, 8
South Africa
TA:
1, 2, 4–6, 8–11
Cameroon
TA:
1, 2, 4, 6, 8
Kenya
TA:
1, 2, 4, 6, 8
Chad
TA:
1, 2, 4, 6, 8
Chile
TA:
1, 2, 4–6, 8–11
Brazil
TA:
1, 2, 4–6, 8–11
Fiji
TA:
1, 2, 4, 6, 8
Colombia
TA:
1, 2, 4–6, 8, 9,
11
Dominican
Republic
TA:
1, 2, 4, 6, 8
Mexico
TA:
1, 2, 4–6, 8–11
United States
TA:
1–16
Indonesia
TA:
1, 2, 4–6, 8–11
Australia
TA:
1–16
NOTE: Countries were selected as representative of groups of similar nations in a single geographical area. Countries are color
coded by their S&T capacity: scientifically advanced (blue), scientifically proficient (green), scientifically developing (yellow),
and scientifically lagging (red). Technology application (TA) numbers are as follows: (1) cheap solar energy, (2) rural wireless
communications, (3) ubiquitous information access, (4) GM crops, (5) rapid bioassays, (6) filters and catalysts, (7) targeted drug
delivery, (8) cheap autonomous housing, (9) green manufacturing, (10) ubiquitous RFID tagging, (11) hybrid vehicles, (12)
pervasive sensors, (13) tissue engineering, (14) improved diagnostic and surgical methods, (15) wearable computers, (16)
quantum cryptography.
RAND MG475-1
Executive Summary 7
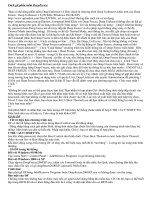
Figure 2
Mapping of Country Scientific Capability Rating to Top 16 Technology Applications
Advanced
Proficient
Developing
Lagging
Needed Capability Technology Applications
Cheap solar energy
Rural wireless communications
GM crops
Filters and catalysts
Cheap autonomous housing
Low
Rapid bioassays
Green manufacturing
Ubiquitous RFID tagging
Hybrid vehicles
Medium
Targeted drug delivery
Improved diagnostic and surgical methods
Quantum cryptography
High
Ubiquitous information access
Tissue engineering
Pervasive sensors
Wearable computers
Very High
RAND MG475-2
By 2020, one should be able to see several trends in the capacity of countries to acquire
technology applications (see Figure 1). Most of North America and Western Europe, along with
Australia and the developed economies of East Asia, will be scientifically advanced. Most of
Asia and Eastern Europe will be scientifically proficient. Latin America and much of Southeast
Asia are likely to be scientifically developing. e majority of Africa and the Middle East, as
well as the Caribbean and the Pacific Islands, will be scientifically lagging.
What Drivers and Barriers Affect These Countries’ Ability to I mplement the
Technology Applications They Could Acquire?
e S&T capacity that enables a country to acquire a technology application is only one of
several factors determining whether that country will be able to implement it. e drivers
facilitating innovation and the barriers hindering it also have a decisive influence on the abil-
ity to implement technology applications (i.e., to put the applications in place and get signifi-
cant gains from them across the country). ese assessments involve such things as whom an
application will benefit and whether a country can sustain its use over time. Drivers and bar-
riers involve the same dimensions: A dimension that is a driver in one context may be a barrier
in another. For example, financing, when available, would be a driver, but financing, when
8 The Global Technology Revolution 2020
lacking, is a barrier. A high level of literacy among a nation’s citizens would be a driver, but if
literacy were low, it would form a barrier. And in certain cases, a dimension that is a barrier
can simultaneously be a driver when only partial progress in that dimension has been made
or when conflicting issues in the dimension are present. For example, education in the United
States is a driver, but there are also concerns about problems in math and science education
in the United States. Also, environmental concerns may dampen some S&T applications in
China while promoting environmentally friendly applications, such as green manufacturing
and hybrid vehicles.
ese are the major drivers and barriers that countries may face through 2020 (see
Figure 3):
3
Cost and financing: e cost of acquiring the technology application and of building the
physical infrastructure and human capital to introduce and sustain its use, the mecha-
nisms and resources available to access the needed funds, and the costs of those funds.
Laws and policies: Legislation and policies that either promote, discourage, or prohibit the
use of a particular technology application.
Social values, public opinion, and politics: Religious beliefs, cultural customs, and social
mores that affect how a technology application is perceived within a society; compatibil-
ity of a new application with dominant public opinions; and the politics and economics
underlying debates about an application.
Infrastructure: Physical infrastructure at a consistent threshold of quality that can be
maintained, upgraded, and expanded over time.
Privacy concerns: Social values toward privacy in a country and personal preferences about
the availability and use of personal data that arise from an individual’s ideological inclina-
tions and experience with the privacy issue.
Use of resources and environmental health: Availability and accessibility of natural resources,
concerns about pollution and its impact on humans, and social attitudes and politics
about conservation and preserving land and wildlife.
R&D investment: Funding to educate and train scientists, engineers, and technicians;
build research laboratories, computer networks, and other facilities; conduct scientific
research and develop new technologies; transfer technologies to commercial applications;
and enter technology applications into the marketplace.
Education and literacy: Levels of general education and literacy adequate to make a
population comfortable with technology and able to interface with it, and the avail-
ability of sufficiently high-quality postsecondary education and training in the sciences
to stock a workforce comfortable with developing, using, and maintaining technology
applications.
Population and demographics: Overall size, average age, and growth rate of the population
and the relative size of different age groups within a population.
3
For a detailed discussion of the country driver and barrier assignments in Figure 3, see Silberglitt, Antón, Howell, and
Wong (2006).
•
•
•
•
•
•
•
•
•
Executive Summary 9
Figure 3
Drivers (D) and Barriers (B) in Selected Countries
Blue countries
Green countries
Yellow countries
Red countries
Country category icons
China, PRC
TA:
1, 2, 4–11, 14,
16
D: b, c, f–j
B: a–d, g, h, j
Korea, Rep. of
TA:
1–16
D: a–d, f–j
B: b, c, j
Russia
TA:
1, 2, 4–11, 14,
16
D: b–d, i
B: a–d, g, h, j
Georgia
TA:
1, 2, 4, 6, 8
D: f, i
B: a–d, g, h, j
Turkey
TA:
1, 2, 4–6, 8–11
D: b, c, f, i
B: a–d, g, h, j
Poland
TA:
1, 2, 4–11, 14,
16
D: b, c, f, i, j
B: a–d, g, h
Germany
TA:
1–16
D: a–j
B: b, c, e
Canada
TA:
1–16
D: a–j
B: b, c, e
Japan
TA:
1–16
D: a–d, f–j
B: b, c, j
India
TA:
1, 2, 4–11, 14,
16
D: b, c, f, g, i, j
B: a–d, g, h, j
Nepal
TA:
1, 2, 4, 6, 8
D: f, i
B: a–d, g, h, j
Pakistan
TA:
1, 2, 4, 6, 8
D: f, i
B: a–d, g, h, j
Iran
TA:
1, 2, 4, 6, 8
D: f, i
B: a–d, g, h, j
Jordan
TA:
1, 2, 4, 6, 8
D: f, i
B: a–d, g, h, j
Israel
TA:
1–16
D: a–d, f–j
B: a–c, j
Egypt
TA:
1, 2, 4, 6, 8
D: f, i
B: a–d, g, h, j
South Africa
TA:
1, 2, 4–6, 8–11
D: b, f, i
B: a–d, g, h, j
Cameroon
TA:
1, 2, 4, 6, 8
D: f, i
B: a–d, g, h, j
Kenya
TA:
1, 2, 4, 6, 8
D: f, i
B: a–d, g, h, j
Chad
TA:
1, 2, 4, 6, 8
D: f, i
B: a–d, g, h, j
Chile
TA:
1, 2, 4–6, 8–11
D: b, c, f, i
B: a–d, g, h, j
Brazil
TA:
1, 2, 4–6, 8–11
D: b, c, f, i
B: a–d, g, h, j
Fiji
TA:
1, 2, 4, 6, 8
D: f, i
B: a–d, g, h, j
Colombia
TA:
1, 2, 4–6, 8, 9,
11
D: f, i
B: a–d, g, h, j
Dominican
Republic
TA:
1, 2, 4, 6, 8
D: f, i
B: a–d, g, h, j
Mexico
TA:
1, 2, 4–6, 8–11
D: b, c, f, i
B: a–d, g, h, j
United States
TA:
1–16
D: a–j
B: b, c, e, h
Indonesia
TA:
1, 2, 4–6, 8–11
D: f, i
B: a–d, g, h, j
Australia
TA:
1–16
D: a–h, j
B: b, c, e
NOTE: Countries were selected as representative of groups of similar nations in a single geographical area. Countries are color
coded by their S&T capacity: scientifically advanced (blue), scientifically proficient (green), scientifically developing (yellow),
and scientifically lagging (red). Drivers (D) and barriers (B) are as follows: (a) cost and financing, (b) laws and policies, (c) social
values, public opinion, and politics, (d) infrastructure, (e) privacy concerns, (f) use of resources and environmental health, (g)
R&D investment, (h) education and literacy, (i) population and demographics, (j) governance and political stability. Technology
application (TA) numbers are the same as in Figure 1: (1) cheap solar energy, (2) rural wireless communications, (3) ubiquitous
information access, (4) GM crops, (5) rapid bioassays, (6) filters and catalysts, (7) targeted drug delivery, (8) cheap autonomous
housing, (9) green manufacturing, (10) ubiquitous RFID tagging, (11) hybrid vehicles, (12) pervasive sensors, (13) tissue
engineering, (14) improved diagnostic and surgical methods, (15) wearable computers, (16) quantum cryptography.
RAND MG475-3
Governance and political stability: Degree of effectiveness or corruption within all levels of
government; the influence of governance and stability on the business environment and
economic performance; and the level of internal strife and violence, as well as external
aggression; number and type of security threats.
•
10 The Global Technology Revolution 2020
Figure 4 illustrates the overall capacity of the 29 nations in our sample to implement all
the technology applications they will be able to acquire.
4
Of the seven scientifically advanced
countries able to obtain all 16 applications, the United States and Canada in North America
and Germany in Western Europe will also be fully capable of implementing them through
2020. Japan and South Korea in Asia, Australia in Oceania, and Israel in the Middle East will
be highly capable of implementing all 16 as well. All these countries will have excellent S&T
capacity, along with the highest number of drivers and lowest number of barriers.
China will fall somewhat below these top seven countries; however, it will lead the group
of scientifically proficient nations able to obtain 12 applications, with a high level of S&T
capacity and many drivers. Still, because it will also possess numerous barriers, China will
have to deal with more challenges to implementation than the group of scientifically advanced
nations will. India, Poland, and Russia—the other three scientifically proficient countries—
will be somewhat less capable than China of implementing the applications they can acquire.
In these countries, although the S&T capacity will be high, the number of barriers will slightly
exceed the number of drivers, making it more difficult to introduce and sustain the full range
of possible technology applications.
All the countries in the scientifically developing group of nations—those able to acquire
nine of 16 top applications—will have even less capacity than the proficient group will to
implement them beyond laboratory research, demonstrations, or limited diffusion. Brazil and
Chile in South America, Mexico in North America, and Turkey in Europe will be the most
capable, followed by South Africa, then Indonesia, and finally Colombia. None of these seven
countries will have a high level of S&T capacity. And each will have significantly more barri-
ers than drivers.
e nations in the scientifically lagging group are able to obtain only five of the top
16 applications. Cameroon, Chad, and Kenya in Africa; the Dominican Republic in the
Caribbean; Georgia in Europe; Fiji in Oceania; Egypt, Iran, and Jordan in North Africa and
the Middle East; and Nepal and Pakistan in Asia will be the least capable of implementing
these applications through 2020. With low levels of S&T capacity, these countries will also
face numerous barriers and will benefit from very few drivers. It will therefore be very difficult
for these countries to implement any but the simplest technology applications (see Figure 2).
4
We analyzed country capacity to implement technology applications by taking into account three factors: (1) capacity to
acquire, defined as the fraction of the top 16 technology applications listed for that country in Figure 1; (2) the fraction
of the ten drivers for implementation applicable to that country; and (3) the fraction of the ten barriers to implementa-
tion applicable to that country. Figure 4 shows the position of each of the 29 representative countries on a plot for which
the y-axis is the product of factors (1) and (2)—i.e., capacity to acquire scaled by the fraction of drivers—and the x-axis is
factor (3). (Multiplying capacity to acquire by the fraction of drivers is consistent with the view that the absence of drivers
reduces the probability that the technology applications a country can acquire will be implemented.) Both axes are shown
as percentages: e y-axis starts at 0 percent (i.e., no capacity to acquire technology applications or drivers) and ends at
100 percent (i.e., capacity to acquire all 16 technology applications, with all 10 drivers applicable). e x-axis starts at 100
percent (i.e., all 10 barriers are applicable) and ends at 0 percent (i.e., no barriers are applicable). is figure provides a first-
order assessment of the capacity to implement technology applications, in that we applied equal weighting to all technology
applications, drivers, and barriers. We recognize that specific technology applications, drivers, and barriers might be more
or less significant in particular countries.
Executive Summary 11
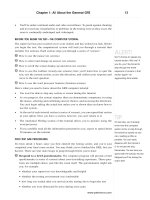
Figure 4
Selected Countries’ Capacity to Implement the Top 16 Technology Applications
Brazil
Chile
Mexico
Turkey
Cameroon
Chad
Dominican
Republic
Egypt
Fiji
Georgia
Iran
Jordan
Kenya
Nepal
Pakistan
South Africa
Colombia
Indonesia
Canada
Germany
Poland
India
China
Russia
U.S.
Australia
Japan
Korea
Israel
0
10
20
30
40
50
60
70
80
90
100
100 8090 60 5070 40 30 20 10 0
Barriers (%)
Capacity to acquire TA x driver (%)
NOTE: The blue quadrant indicates a high level of S&T capacity plus many drivers and few barriers; the green
quadrant indicates a high level of S&T capacity with many drivers and many barriers; the yellow quadrant
indicates the lack of a high level of S&T capacity plus few drivers and few barriers; the red quadrant indicates
the lack of a high level of S&T capacity with more barriers than drivers.
RAND MG475-4
None of the countries in our sample, regardless of their level of S&T capacity, will have
low numbers of both drivers and barriers through 2020. is reflects the fact that nations
cannot reduce barriers without simultaneously developing drivers and S&T resources.
e overall capacity of these representative nations to implement the technology applica-
tions they can acquire suggests the following trends: