Báo cáo khóa học: FRET evidence for a conformational change in TFIIB upon TBP-DNA binding pptx
Bạn đang xem bản rút gọn của tài liệu. Xem và tải ngay bản đầy đủ của tài liệu tại đây (283.39 KB, 9 trang )
FRET evidence for a conformational change in TFIIB upon TBP-DNA
binding
Le Zheng
1
, Klaus P. Hoeflich
1
, Laura M. Elsby
2
, Mahua Ghosh
1
, Stefan G. E. Roberts
2
and Mitsuhiko Ikura
1
1
Division of Molecular and Structural Biology, Ontario Cancer Institute and Department of Medical Biophysics,
University of Toronto, Ontario, Canada;
2
Division of Gene Regulation and Bioinformatics, School of Biological Sciences,
University of Manchester, UK
As a critical step of the preinitiation complex assembly in
transcription, the general transcription factor TFIIB forms
a complex with the TATA-box binding protein (TBP)
bound to a promoter element. Transcriptional activators
such as the herpes simplex virus VP16 facilitate this com-
plex formation through conformational activation of
TFIIB, a focal molecule of transcriptional initiation and
activation. Here, we used fluorescence resonance energy
transfer to investigate conformational states of human
TFIIB fused to enhanced cyan fluorescent protein and
enhanced yellow fluorescent protein at its N- and C-terminus,
respectively. A significant reduction in fluorescence reson-
ance energy transfer ratio was observed when this fusion
protein, hereafter named CYIIB, was mixed with promoter-
loaded TBP. The rate for the TFIIB–TBP–DNA complex
formation is accelerated drastically by GAL4-VP16 and is
also dependent on the type of promoter sequences. These
results provide compelling evidence for a Ôclosed-to-openÕ
conformational change of TFIIB upon binding to the TBP–
DNA complex, which probably involves alternation of the
spatial orientation between the N-terminal zinc ribbon
domain and the C-terminal conserved core domain
responsible for direct interactions with TBP and a DNA
element.
Keywords: TFIIB; TATA-box binding protein; VP16;
fluorescence resonance energy transfer; adenovirus major
late promoter.
The general transcription factor TFIIB plays a crucial role
in the assembly of the transcriptional preinitiation complex
(PIC) by recognizing the TATA binding protein (TBP)
bound to the TATA element and by recruiting RNA
polymerase II (Pol II) and TFIIF into the PIC [1–3].
Consistent with the central function of TFIIB in the initial
step of the PIC formation, TFIIB has been proposed to be
a target of transcriptional activators [4–6]. Human TFIIB,
consisting of 316 amino acid residues, is comprised of a
N-terminal domain (NTD) that contains the Zn
2+
ribbon
motif, and a C-terminal core domain (CTD) possessing two
repeats of the cyclin fold [7] (Fig. 1A). The two functionally
distinct domains are connected via a highly conserved linker
containing several charged residues, hereafter termed a
charged cluster domain (CCD), critical for maintaining
TFIIB conformation [5,8,9].
In 1994, Roberts and Green [4] proposed a mechanism
for the activator-dependent transcriptional activation that
involves a closed-to-open conformational change in TFIIB.
In isolation, or presumably in the holoenzyme-bound state,
TFIIB bears a strong interaction between the NTD and
CTD, thus forming a compact structure as a whole. Upon
binding to a TBP-promoter complex, this intramolecular
interaction may be weakened by an ill-defined mechanism
such that the TFIIB CTD can then interact with the core
domain of TBP (TBPc) and the core promoter element and
the TFIIB NTD can recruit Pol II and TFIIF into the
initiation site. Transcriptional activators such as VP16 are
believed to facilitate this conformational change in TFIIB,
thereby promoting accelerated formation of the PIC and an
increase in mRNA synthesis. More recently, biochemical
studies [9,10] have shown that TFIIB can make sequence-
specific DNA contact with an element immediately
upstream of the TATA box, called the TFIIB recognition
element (BRE). Proposed functions of this TFIIB–BRE
interaction include modulation of the strength of the core
promoter and the proper positioning of the TFIIB–TBP–
TATA complex with respect to the initiation site influencing
the start site selection. These studies suggest essential roles
of the orientation of NTD–CTD in TFIIB conformational
activation in expression of its biological functions.
In order to probe the TFIIB conformational change and
to investigate the static and kinetic properties of the TFIIB–
TBP-promoter complex formation, we used fluorescence
Correspondence to M. Ikura, Division of Molecular and Structural
Biology, Ontario Cancer Institute and Department of Medical
Biophysics, University of Toronto, 610 University Avenue,
Ontario, M5G 2M9, Canada. Fax: + 01 416 946 2055,
E-mail:
Abbreviations: AdE4, adenovirus E4 promoter; AdML, adenovirus
major late promoter; BRE, TFIIB recognition element; CCD, charged
cluster domain; CTD, C-terminal domain; CYIIB, TFIIB fused with
ECFP and EYFP at the N- and C-terminus; ECFP, enhanced cyan
fluorescent protein; EYFP, enhanced yellow fluorescent protein;
FRET, fluorescence resonance energy transfer; TBP, TATA-box
binding protein; NTD, N-terminal domain; PIC, preinitiation
complex; pol II, RNA polymerase II; TBPc, the core domain of TBP;
TFIIBc, the core domain of TFIIB.
(Received 16 October 2003, revised 5 December 2003,
accepted 7 January 2004)
Eur. J. Biochem. 271, 792–800 (2004) Ó FEBS 2004 doi:10.1111/j.1432-1033.2004.03983.x
resonance energy transfer (FRET) [11–13]. We have gener-
ated various TFIIB constructs fused to enhanced cyan and
yellow fluorescent protein (ECFP and EYFP) [14], which
enable us to probe, in a time-dependent manner, the
conformational change of TFIIB upon complexation with
TBP bound with the AdML or AdE4 promoters [9]. The
results indicate that the rate of TFIIB conformational
change coupled with the TBP-promoter binding is signifi-
cantly increased by GAL4–VP16 and depends on the
sequence of the promoter.
Experimental procedures
Construction, overexpression, and purification of CYIIB
and its derivatives
The gene encoding full-length human TFIIB [15] was
amplified by PCR and inserted into pRSETb-YC2.1 [11] via
SacIandSphI sites. This construct generated a fusion
protein with ECFP preceding the N-terminus of TFIIB and
EYFP following the C-terminus (CYIIB). ECFP-TFIIB
was made by inserting the TFIIB gene into pRSETb-YC2.1
via SphIandEcoRI sites. PCR-mediated site-directed
mutagenesis was performed on CYIIB to generate C34A/
C37A and E51R mutants. All clones were sequenced to
ensure only the intended mutations were present.
Recombinant CYIIB proteins were expressed in E. coli
strain BL21(DE3) (Novagen). Cultures were grown at
37 °C in LB medium containing 100 lgÆmL
)1
ampicillin
and induced with 0.5 m
M
isopropyl thio-b-
D
-galactoside at
15 °C, overnight. Cells were harvested by centrifugation
at 7000 g for 30 min at 4 °C. Cell pellets were suspended
in lysis buffer (20 m
M
Tris/HCl, pH 7.5; 25 m
M
NaCl;
10 m
M
2-mercaptoethanol; 1 m
M
phenlymethanesulfonyl
fluoride; 20% glycerol; 3 m
M
MgCl
2
;0.5%NP40;
10 lgÆmL
)1
DNase I), sonicated, and centrifuged at
27 000 g for 30 min to remove debris. The supernatant
was incubated with nickel chelate agarose and washed first
with 1
M
KCl, 2 m
M
imidazole in buffer A (20 m
M
Tris/
HCl, pH 7.5; 20% glycerol; 10 m
M
2-mercaptoethanol;
1m
M
phenlymethanesulfonyl fluoride) and then with
300 m
M
KCl, 10 m
M
imidazole in the same buffer. CYIIB
was eluted with 150 m
M
KCl, 300 m
M
imidazole in buffer
A. The eluant was then further purified on a Superdex 200
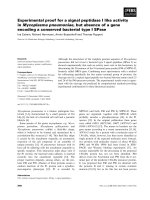
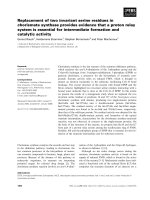
Fig. 1. Schematic depiction of (A) full-length human TFIIB (B) wild-type and mutant CYIIB, and (C) the nucleotide sequences of AdML and AdE4
promoter elements. Zn, zinc-ribbon domain; CCD, charged cluster domain; WT, wild-type; ECFP, enhanced cyan fluorescent protein; EYFP,
enhanced yellow fluorescent protein; BRE, TFIIB recognition element; TATA, TATA box; INR, initiator sequence.
Ó FEBS 2004 FRET studies on TFIIB–TBP–DNA interactions (Eur. J. Biochem. 271) 793
HR 10/30 FPLC column using 20 m
M
Hepes pH 7.5,
150 m
M
KCl, 5% (v/v) glycerol, 5 m
M
dithiothreitol,
1m
M
phenlymethanesulfonyl fluoride. CYIIB was eluted
in a single peak and the fraction with the highest
fluorescence intensity at 526 nm was used for FRET
experiments. Glycerol was added to the sample at a final
concentration of 20%, and the CYIIB was aliquoted and
stored at )70 °C.
Overexpression and purification of TBP and Gal4-VP16
pET11d-TBP(yeast TBP residues 1–240) [16] was trans-
formed into BL21(DE3) pLysS E. coli and protein
synthesis was induced with 0.25 m
M
isopropyl thio-
b-
D
-galactoside for 3 h at 27 °C. TBP was purified by
nickel chelate affinity chromatography as described for
CYIIB and then dialysis against SP buffer [20 m
M
Tris/
HCl, pH 7.5; 20% (v/v) glycerol; 180 m
M
KCl; 5 m
M
CaCl
2
;5m
M
dithiothreitol] overnight. Then the His
6
-
tagged TBP was digested by trypsin at 200 lgÆmg
)1
recombinant protein for 6 min on a rocker at 4 °C,
yielding a truncated construct containing the conserved
TBP core domain (49–240). The reaction was stopped by
aminoethyl-benzene sulfonyl fluoride HCl (AEBSF) and
protein solution was loaded onto a pre-equilibrated SP-
Sepharose column. After washing with SP equilibration
buffer, the TBP sample was eluted with 800 m
M
KCl in
SP buffer. By adding 20 m
M
Tris/HCl and 60% glycerol,
the protein solution was adjusted to 20 m
M
Tris/HCl,
pH 7.5; 40% glycerol; 400 m
M
KCl; 5 m
M
dithiothreitol
andstoredat)70 °C.
Gal4(1–93)-VP16(413–490) in pRJR vector [17] was
transformed into E. coli strain BL21(DE3) and expressed
and purified as described for CYIIB.
Purification of promoter DNA fragments
The promoter DNA templates AdML and AdE4 in pGEM
vector [18] were transformed into E. coli strain DH5a,
grown overnight at 37 °C, and extracted by using the
QIAfilter plasmid Giga kit (Qiagen). The plasmid DNA was
cut by BamHI and EcoRI, phenol/chloroform extracted and
precipitated. After washing with 70% ethanol, the DNA
pellet was dissolved in buffer A (10 m
M
Tris/HCl, pH 7.5;
1m
M
EDTA; 0.35
M
NaCl) and loaded onto a HiTrap Q
column. The DNA fragment eluted with a 0.35
M
to 2.0
M
NaCl gradient and was confirmed on a native polyacryl-
amide Tris/borate/EDTA gel. Peak fractions were pooled,
and the buffer for the pooled sample was exchanged with
10 m
M
Tris/HCl pH 7.5 and this sample was concentrated
andstoredat)20 °C.
Gel mobility shift assay
An adenovirus Major Late promoter fragment (nucleotides
)50 to +22) was radiolabeled with [
32
P]dATP[aP] using a
Klenow fragment and then gel-purified. Bandshifts were
performed as described previously using purified recombin-
ant TBP, TFIIB and CYIIB [19]. Complexes were resolved
by native gel electrophoresis (5% acrylamide) and visualized
by autoradiography. Anti-human TFIIB Ig was prepared
as described previously [18].
Fluorescence spectroscopy
All fluorescence spectra were recorded on a Shimadzu
spectrofluorometer RF5301 using a 10 mm path-length
quartz cuvette at room temperature. The fluorescence
emission was monitored between 450 and 600 nm with
excitation at 437 nm. The excitation and emission slit
widths were 5 nm. Unless otherwise indicated, all measure-
ments were performed in 20 m
M
Hepes, pH 7.5; 150 m
M
KCl; 5% (v/v) glycerol; 5 m
M
dithiothreitol and 1 m
M
phenylmethanesulfonyl fluoride. The fluorescence emission
ratio was determined by dividing the integration of fluor-
escence intensities between 520 and 535 nm by that between
470 and 485 nm. Note that the absorbance spectrum of
CYIIB in a range of 430 to 550 nm is essentially identical to
that of a 1 : 1 mixture of ECFP and EYFP, confirming that
an excitation at 437 nm is adequate for ECFP to transmit
FRET to EYFP within the CYIIB fusion system. Fusing
TFIIB to the C-terminus of ECFP does not change the
fluorescence spectrum of ECFP, so as with fusing TFIIB
to the N-terminus of EYFP.
For the kinetics measurements, a premixture of equi-
molar TBP and AdML or AdE4 promoter were added to
CYIIB solution with or without % 100 n
M
Gal4–VP16.
The concentrations of CYIIB and its mutants E51R and
C34A/C37A were determined by using EYFP’s extinction
coefficient of 84 000 cm
)1
Æ
M
)1
at 514 nm (http://www.
clontech.com; Protocol #PT2040-1) as well as the fluores-
cence intensity at 526 nm when excited at 514 nm. The
concentration of TBP was determined by Bradford assay
(Bio-Rad). The concentration of DNA was determined
by A
260
. The final concentrations of all components were
adjusted to approximately 60 n
M
. After rapid mixing for
% 20 s, the 3D fluorescence spectra recording was started
immediately for 20 min at 1 min intervals. For each sample,
three or four measurements were performed. The emission
ratio was calculated as described above and plotted against
time. To the pseudo-first order approximation, observed
changes in the emission intensity ratio at 476 and 526 nm
were fitted by using Microsoft’s
EXCEL SOLVER
to perform
least-squares curve fitting, with S (d
2
) of 0.001. The observed
rate constant k
obs
was calculated from each set of data by
nonlinear regression analysis using the following formula:
R
t
¼ R
1
þðR
0
À R
1
ÞÂe
Àk
obs
 t
where, R
0
is the initial emission ratio before adding TBP and
promoters, R
t
and R
1
are the observed emission ratio at
time t and at infinity, respectively. An error bar indicates the
SD of each data point from the average value.
Results
Design and biochemical integrity of CYIIB
To gain more insight into the conformational variability of
TFIIB, we employed GFP-based FRET methods [12,13]. A
single polypeptide FRET-based indicator for TFIIB con-
formational change (hereafter referred to as CYIIB) was
constructed by fusing ECFP (donor) and EYFP (acceptor)
to the N- and C-terminus of TFIIB, via RMH and GGS
peptide linker sequences, respectively (Fig. 1B). For all
CYIIB constructs described in this study, we used a
794 L. Zheng et al. (Eur. J. Biochem. 271) Ó FEBS 2004
truncated version of ECFP that lacks G229-K239 at the
C-terminus.
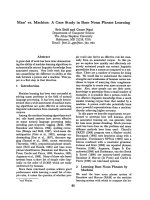
We first used gel mobility shift assays to assess the ability
of CYIIB to bind to the TBP–DNA complex. Recombinant
TBP and increasing amounts of either recombinant native
TFIIB or CYIIB were incubated with a radio labeled
AdML promoter fragment and the complexes were resolved
by native gel electrophoresis (Fig. 2). TBP alone did not
show a Ôsuper shiftÕ on the gel (known phenomenon when
full-length TBP is used) and required the addition of either
TFIIB or CYIIB. We also tested the ability of anti-TFIIB Ig
to disrupt the ternary complex formation with CYIIB and
indeed the antibody drastically abrogated the CYIIB–TBP–
AdML complex formation. These results demonstrate that
CYIIB is competent in forming a complex with TBP at the
promoter. As expected from the fusion of the fluorescent
tags, the CYIIB–TBP–DNA complex migrated at a slower
rate than that observed of the TFIIB–TBP–DNA complex.
Thus, the CYIIB fusion protein forms a defined complex
with TBP at the AdML promoter.
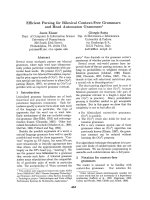
We then investigated the spectroscopic properties of
CYIIB. By exciting at 437 nm, the emission spectrum of
wild-type CYIIB showed a double peak appearance typical
for ECFP/EYFP-based FRET, one peak at 476 nm
corresponding to ECFP and a more intense peak at
526 nm, arising mainly from EYFP (Fig. 3A). This energy
transfer to the longer wavelength occurred only when ECFP
and EYFP were fused to TFIIB. The observed emission
ratio between 526 nm and 476 nm was 1.14 ± 0.01 for
wild-type CYIIB. When the same experiment was per-
formed on two separate constructs, ECFP–TFIIB and
EYFP mixed at 1 : 1 ratio, we completely abolished the
peak at 526 nm (Fig. 3B) and no FRET was observed. This
was also true for a 1 : 1 mixture of ECFP and EYFP
(Fig. 3C). These results demonstrate that the observed
FRET is specific to CYIIB and therefore owing to the
nature of TFIIB conformational state within the fusion
system of CYIIB.
To further confirm whether the relatively high intensity of
the 526 nm peak is due to FRET, we performed limited
trypsin proteolysis on CYIIB. Within % 10 min after
addition of trypsin, a drastic reduction of the 526 nm peak
was observed in parallel with an increase in intensity of the
476 nm peak (Fig. 3A). As ECFP and EYFP are both
highly resistant to trypsin digestion [11], the protease must
have cleaved TFIIB thus disenabling the NTD/CTD
interaction. These results assured us that the enhanced
fluorescence intensity at 526 nm in CYIIB was due to the
intramolecular FRET between ECFP and EYFP fused at
the two termini of CYIIB.
As GFP and its variants are known to be sensitive to pH
and salt concentrations [14,20], we first examined the
fluorescence characteristics of CYIIB against KCl and pH
concentrations (Fig. 4A,B). When the concentration of KCl
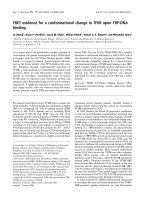
Fig. 2. Gel mobility shift assay showing that CYIIB forms a TBP-
CYIIB-promoter complex. Recombinant TBP (2 ng) was added where
indicated. Increasing amounts of TFIIB and CYIIB (5, 10, 20 ng) were
added.
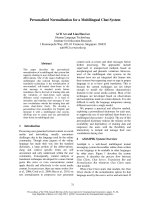
Fig. 3. Emission spectra of (A) wild-type CYIIB (B) a 1 : 1 mixture of ECFP-TFIIB and EYFP, and (C) a 1 : 1 mixture of ECFP and EYFP.
Emission spectra of each sample (excitation at 437 nm) are shown in blue, those after the addition of TBP–AdML in red. An emission spectrum of
trypsin-treated CYIIB is shown in green in panel A. The concentrations of CYIIB, ECFP–TFIIB, ECFP, EYFP, and AdML were all kept at
approximately 60 n
M
.
Ó FEBS 2004 FRET studies on TFIIB–TBP–DNA interactions (Eur. J. Biochem. 271) 795
was increased from 0 to 500 m
M
, the emission ratio of
apoCYIIB dropped drastically from 1.45 to 0.90. This is
probably attributed to a weakened electrostatic interaction
between the NTD and CTD at a high ionic strength, which
promotes accumulation of the open conformation. Inter-
estingly, the effect of ionic strength was abolished by the
complex formation with AdE4-bound TBP, consistent with
the extensive interaction of TFIIB with the promoter-bound
TBP [21]. In both TBP-promoter bound or unbound states,
the emission ratio was relatively constant between pH 6.6
and 8.0, while it started to drop below pH 6.6. This large
decrease in the emission ratio at low pH is due to the pH
sensitivity reported previously for EYFP [22]. Nevertheless,
all measurements described below were performed in a
20 m
M
Hepes buffer (pH 7.5) containing 150 m
M
KCl, in
which the pH and KCl concentration were kept constant
throughout the entire experiments.
CYIIB mutants
In addition to wild-type CYIIB, we generated two CYIIB
mutant constructs: E51R and C34A/C37A (Fig. 1B), the
former representing a CCD mutant and the latter a Zn
2+
ribbon mutant. The single mutant E51R in human TFIIB
(equivalent to E62R in yeast TFIIB [23]) caused a down-
stream shift in the transcription start site at the AdE4
promoter, but not the AdML promoter [9]. Zn
2+
binding
site mutant, similar to the double point mutant C34A/C37A
used in this study, has been shown to prevent recruitment
of Pol II to the PIC [24] or not to support transcription
in vitro [25].
Excitation of these two CYIIB mutants at 437 nm also
produced a two peak appearance with a maximum at 476
and 526 nm (Fig. 5). When comparing the 526/476 nm
emission ratio of E51R and C34A/C37A mutants to that of
wild-type CYIIB, we found noticeable differences among
those three constructs: the two mutants E51R and C34A/
C37A displayed higher ratio (1.19 ± 0.01 and 1.32 ± 0.01,
respectively) than wild-type CYIIB (1.14 ± 0.01).
TBP-promoter induced conformational change in CYIIB
We then examined the effect of TBP–AdML binding on the
FRET efficiency observed for CYIIB (Fig. 3A). The ratio
of the intensity between the peak of 526 nm and of 476 nm
changed from 1.14 (apo-CYIIB) to 0.95 (complexed
CYIIB). This change was not observed when CYIIB was
mixed with TBP alone or with DNA alone. Furthermore,
when TBP–AdML was added to a 1 : 1 mixture of ECFP–
TFIIB and EYFP (Fig. 3B), no ratio change was observed.
A 1 : 1 mixture of ECFP and EYFP (Fig. 3C) also showed
no change. Finally, our gel filtration experiments indicated
that CYIIB was predominantly monomeric below 10 l
M
,
consistent with the reported dissociation constant of GFP
monomer-dimer equilibrium (i.e. % 100 l
M
) [26]. These
results strongly support the decrease in EYFP fluorescence
and increase in ECFP emission seen in CYIIB as a result of
conformational change of TFIIB upon binding with TBP–
AdML. A similar degree of TBP-promoter dependent
change in emission ratio was also observed for CYIIB
mutants; from 1.19 to 1.03 for E51R and 1.32 to 1.04 for
C34A/C37A (Fig. 6A).
Fig. 4. Salt and pH effects on the FRET of CYIIB. (A) KCl concen-
tration dependence of the emission ratio (526/476 nm) of CYIIB.
(B) pH-dependence of the emission ratio (526/476 nm) of CYIIB. Data
are obtained for wild-type CYIIB alone (open circle) and for the
CYIIB–TBP–AdE4 complex (filled circle). For KCl titration experi-
ments, 20 m
M
Hepes (pH 7.5) containing 5% glycerol and 5 m
M
dithiothreitol was used. For pH titration experiments, 20 m
M
Hepes
was used for the range of 6.6–8.0 and 20 m
M
Mes for pH 6.3 (both
buffers contained 150 m
M
KCl, 5 m
M
dithiothreitol, and 5% glycerol).
Approximately 60 n
M
CYIIB was used.
Fig. 5. Emission spectra of the wild-type CYIIB (black), E51R (red),
and C34A/C37A (green). Thespectraofthemutantsarenormalizedto
the spectrum of wild-type CYIIB using the peak maximum at 476 nm.
796 L. Zheng et al. (Eur. J. Biochem. 271) Ó FEBS 2004
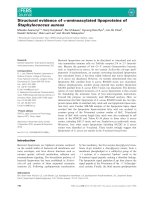
GAL4-VP16 accelerates the formation of a
TFIIB–TBP–DNA complex
To gain insight into the kinetics of the TFIIB–TBP–
promoter complex formation, we investigated the time
course of FRET intensity after adding the TBP-promoter
complex. When premixed TBP–AdML was added into the
CYIIB solution we observed an immediate drop in the
FRET ratio (the experimental dead-time is % 20 s)
(Fig. 6B). The k
obs
was estimated to be 0.15 min with
AdML promoter.
The presence of GAL4-VP16 in the initial solution of
CYIIB altered drastically the time-dependence profile of the
526/476 nm emission ratio change upon the addition of
premixed TBP-AdML (Fig. 6B). A much sharper drop of
the emission ratio was observed (k
obs
of 4.26 min), % 27·
larger relative to that seen without GAL4–VP16. These
results are in excellent agreement with the previously
reported value obtained by the gel-shift mobility assay of
native TFIIB [27], indicating that the functional influence of
fused ECFP/EYFP to TFIIB is relatively subtle or negli-
gible as far as the complexation with the promoter-bound
TBP is concerned.
Do the CYIIB mutations described above affect the rate
constant for the CYIIB–TBP–promoter assembly? In the
absence of GAL4–VP16, the k
obs
obtained for E51R
(0.14 ± 0.01 min
)1
) was essentially identical to the value
of wild-type CYIIB (Fig. 6C). When GAL4–VP16 was
added to the initial solution of CYIIB the rate constant
drastically increased almost 30· to 4.34 ± 0.36 min
)1
,in
a manner similar as that for wild-type CYIIB. In con-
trast, C34A/C37A produced a different pattern: without
GAL4–VP16, C34A/C37A showed a higher k
obs
(0.28 ± 0.01 min
)1
), almost two times the value for wild-
type CYIIB; while in the presence of GAL4–VP16 the k
obs
increased only 14·, roughly half of the enhancement
observed for wild-type CYIIB and E51R.
Promoter dependence of GAL4–VP16 activated
TFIIB–TBP–promoter complex formation
Fairley et al. [9] recently reported that the sequence of the
core promoter is critical for the selection of the transcrip-
tion start site. This observation leads to the speculation
that TFIIB can adopt different conformations depending
on which core promoter it binds to. Furthermore, the
TFIIB E51R mutant promotes aberrant transcription
start site assembles at the core promoter, presumably
due to its conformation differing from the wild-type
TFIIB [9].
Fig. 6. Effects of TFIIB mutations on FRET for CYIIB and kinetic characterization of CYIIB. (A, D) Comparison of fluorescence emission ratios
among wild-type CYIIB, E51R, and C34A/C37A. (B, E) Time-dependence of emission ratios upon addition of TBP-promoter in the absence (open
circle) and in the presence of GAL4-VP16 (filled circle). (C, F) Comparison of the rate constants obtained for wild-type CYIIB, E51R, and C34A/
C37A, using kinetic curves as shown in panel B and E. AdML and AdE4 (% 60 n
M
) were used as promoters for panel A–C and for panel D–F,
respectively. In panels A, C, D, and F, – and + represent in the absence and in the presence of GAL4–VP16 (100 n
M
), and c is the control,
representing CYIIB alone. Protein concentrations of CYIIB and the two mutants were all kept at % 60 n
M
.
Ó FEBS 2004 FRET studies on TFIIB–TBP–DNA interactions (Eur. J. Biochem. 271) 797
In order to investigate conformational and kinetic effects
of different promoter sequences on TFIIB–TBP–promoter
complex formation, we compared the two different promoter
elements, AdML and AdE4 (Fig. 6). The observed rate
constants for wild-type CYIIB and mutants E51R and
C34A/C37A on TBP–AdML and TBP–AdE4 are summar-
ized in Fig. 6C,F. Similar to what was seen for AdML,
GAL4–VP16 increased the k
obs
for all three constructs on
AdE4 by a factor of 20 for both wild-type CYIIB and E51R
(2.32 vs. 0.12 min
)1
for wild-type and 2.01 vs. 0.11 min
)1
for E51R) and by a factor of 5.6 for C34A/C37A (1.17
vs. 0.21 min
)1
). Interestingly, the GAL4–VP16-dependent
enhancement on the rate constant for AdE4 promoter was
significantly smaller (approximately half) as compared to
that observed for AdML promoter.
Discussion
It has been thought that a rearrangement of CTD and NTD
orientation is crucial for the activation of TFIIB [4]. The
lack of high-resolution structural data for full-length TFIIB,
however, makes it unclear to what degree the conformation
of TFIIB changes upon binding of the TBP-promoter
complex. A recent study using small-angle X-ray scattering
[28] suggests that NTD does make an intramolecular
interaction with the CTD in apo TFIIB, yet how this
changes upon binding to an TBP–DNA complex remained
largely undefined. FRET is an extremely sensitive method
for detecting a change in the proximity between donor and
acceptor chromophores, ECFP and EYFP in our case,
whicharefusedtothetwoterminiofatargetprotein.With
this structural constraint, it is fairly safe to assume that a
change in FRET with CYIIB monitors a conformational
change in TFIIB. Similar FRET-based conformational
indicators have been successfully used for various cellular
proteins such as calmodulin [11,29], caspases [30,31], and
Ras/Rap1 [32].
The 526/476 nm emission ratio of CYIIB decreases
upon binding to TBP complexed with two different
promoters (1.14–0.95 for AdML and 1.14–0.98 for
AdE4). As the conformational change of TFIIB probably
involves a hinge motion of the domain linker, both the
relative angle and distance between the NTD and CTD
will probably be affected. Nevertheless, the decrease in
the emission intensity ratio, observed for both AdML
and AdE4, strongly suggests that TFIIB undergoes a
change from a somewhat ÔclosedÕ conformational state in
the apo form to a rather ÔopenÕ conformational state of
the ternary complex form with promoter-bound TBP. By
using the Fo
¨
rster equation [33], the observed decrease in
emission intensity ratio could mean an increase in the
ECFP-EYFP distance (from 55 A
˚
to 58 A
˚
), assuming
that the Fo
¨
rster distance of ECFP and EYFP is 49 A
˚
[34]. This small distance change between the two termini
of TFIIB may suggest that the N-terminal Zn
2+
ribbon
domain still interacts with CTD, yet it can interact with
other initiation factor(s) such as Pol II subunit(s) in order
to properly position the initiation complex at the start site
[4]. Alternatively, the observed FRET change represents a
time-averaged value, and thus does not exclude a
possibility that TFIIB exists as an extended conformation
with certain lifetime. Nevertheless, such a dynamic
conformational change is probably promoted by the
CCD containing linker region (residues 43–105) which
connects NTD and CTD in TFIIB. Indeed, the CCD
mutation (E51R) affects the conformation of TFIIB, as
evidenced by a higher FRET ratio observed with apo
CYIIB.
Transcription is a time-dependent process which involves
multiple steps in the molecular assembly of general
transcription factors and Pol II [1,2]. A full understanding
of this complex process depends on our ability to visualize
and quantify individual molecular events with high spatial
and temporal resolution in the cellular context. Our TFIIB-
based FRET probes enabled us to characterize the
time-dependent process of the formation of a TFIIB–TBP–
TATA complex. One of the specific goals of this study is to
assess how a transcriptional activator influences the rate of
the TFIIB–TBP–TATA complex formation by employing
FRET-based kinetic measurements, instead of conventional
steady-state methods using gel electrophoresis assays. Our
FRET data clearly indicate that VP16 indeed accelerates the
TFIIB conformational change. In the presence of GAL4–
VP16, the observed rate constant obtained for CYIIB with
TBP bound to the AdML promoter (4.26 ± 0.23 min
)1
)
is significantly higher (> 20·) than that in the absence
of GAL4–VP16 (0.15 ± 0.01 min
)1
), indicating that this
transcriptional activator enhances mainly the speed of the
complex formation. On the other hand, when different
promoters are used to investigate the CYIIB–TBP–promoter
complex formation in the presence of GAL4-VP16, different
rate constants were obtained: 4.26 min
)1
for AdML and
2.32 min
)1
for AdE4, indicating that the acceleration of the
complex formation is dependent on the promoter. This
relatively large difference in k
obs
is somewhat diminished
when GAL4–VP16 is absent (basal transcription case), yet
the kinetics obtained for AdML promoter (0.15 min
)1
)
remains to be faster than that for AdE4 (0.12 min
)1
).Thus,
GAL4–VP16 enhances the effect of different promoters on
the rate of TFIIB–TBP–DNA complex formation. These
differences in the kinetic aspect of complex formation may be
accounted for by the previous notion that the BRE element
enhances the affinity of TFIIB towards the promoter-bound
TBP [9]. While the AdML and AdE4 promoters both contain
the TATA box, only the former sequence contains the BRE
element upstream of the TATA box (Fig. 1C).
An interesting finding with the CYIIB mutants is that
the 526/476 nm emission ratio is sensitive to mutations
introduced to the N-terminal Zn
2+
ribbon and CCD
regions of TFIIB. The mutant E51R displayed a 4.4%
larger ratio enhancement relative to wild-type CYIIB,
while the mutant C34A/C37A produces even larger
enhancement (16% relative to the wild-type). The results
on E51R may parallel the recent studies which suggested
that this mutation within the CCD region caused an
alternation of the spatial orientation between the N- and
C-terminal domain of TFIIB [9]. Even greater FRET
change observed for the mutant C34A/C37A may suggest
similar, but perhaps more drastic, conformational effects as
observed for E51R. Further structural studies are required
to define exact conformational changes accompanied by
those mutations.
798 L. Zheng et al. (Eur. J. Biochem. 271) Ó FEBS 2004
Acknowledgements
We thank Atsushi Miyawaki and Roger Tsien for providing us with
the expression vectors for ECFP and EYFP, and Danny Reinberg for
providing us with human TFIIB cDNA. This work was supported by
grants from the Canadian Institutes of Health Research (CIHR) and
the Cancer Research Society Inc. K. P. H. is supported by a National
Cancer Institute of Canada Fellowship, L. M. E. by a Wellcome Prize
Studentship, S. G. E. R. by a Wellcome Trust Senior Fellowship, M.
G. by a CIHR Fellowship, and M. I. is a CIHR Senior Investigator.
References
1. Roeder, R.G. (1996) The role of general initiation factors in
transcription by RNA polymerase II. Trends Biochem. Sci. 21,
327–335.
2. Orphanides, G., Lagrange, T. & Reinberg, D. (1996) The general
transcription factors of RNA polymerase II. Genes Dev. 10, 2657–
2683.
3. Hampsey, M. (1998) Molecular genetics of the RNA polymerase
II general transcriptional machinery. Microbiol. Mol. Biol. Rev. 62,
465–503.
4. Roberts, S.G. & Green, M.R. (1994) Activator-induced con-
formational change in general transcription factor TFIIB. Nature
371, 717–720.
5. Hawkes, N.A., Evans, R. & Roberts, S.G. (2000) The
conformation of the transcription factor TFIIB modulates the
response to transcriptional activators in vivo. Curr. Biol. 10,
273–276.
6. Reese, J.C. (2003) Basal transcription factors. Curr. Opin. Genet.
Dev. 13, 114–118.
7. Bagby, S., Kim, S., Maldonado, E., Tong, K.I., Reinberg, D. &
Ikura, M. (1995) Solution structure of the C-terminal core domain
of human TFIIB: similarity to cyclin A and interaction with
TATA-binding protein. Cell 82, 857–867.
8. Wu, W.H. & Hampsey, M. (1999) An activation-specific role for
transcription factor TFIIB in vivo. Proc. Natl Acad. Sci. USA 96,
2764–2769.
9. Fairley, J.A., Evans, R., Hawkes, N.A. & Roberts, S.G. (2002)
Core promoter-dependent TFIIB conformation and a role for
TFIIB conformation in transcription start site selection. Mol. Cell
Biol. 22, 6697–6705.
10. Evans, R., Fairley, J.A. & Roberts, S.G. (2001) Activator-medi-
ated disruption of sequence-specific DNA contacts by the general
transcription factor TFIIB. Genes Dev. 15, 2945–2949.
11. Miyawaki, A., Llopis, J., Heim, R., McCaffery, J.M., Adams,
J.A., Ikura, M. & Tsien, R.Y. (1997) Fluorescent indicators for
Ca2+ based on green fluorescent proteins and calmodulin. Nature
388, 882–887.
12. Truong, K. & Ikura, M. (2001) The use of FRET imaging
microscopy to detect protein–protein interactions and protein
conformational changes in vivo. Curr.Opin.Struct.Biol.11,573–
578.
13. Zhang, J., Campbell, R.E., Ting, A.Y. & Tsien, R.Y. (2002)
Creating new fluorescent probes for cell biology. Nat. Rev. Mol.
Cell Biol. 3, 906–918.
14. Tsien, R.Y. (1998) The green fluorescent protein. Annu. Rev.
Biochem. 67, 509–544.
15. Ha, I., Roberts, S., Maldonado, E., Sun, X., Kim, L.U., Green,
M. & Reinberg, D. (1993) Multiple functional domains of human
transcription factor IIB: distinct interactions with two general
transcription factors and RNA polymerase II. Genes Dev. 7, 1021–
1032.
16. Liu, D., Ishima, R., Tong, K.I., Bagby, S., Kokubo, T.,
Muhandiram, D.R., Kay, L.E., Nakatani, Y. & Ikura, M. (1998)
Solution structure of a TBP-TAF (II), 230 complex: protein
mimicry of the minor groove surface of the TATA box unwound
by TBP. Cell 94, 573–583.
17. Reece, R.J., Rickles, R.J. & Ptashne, M. (1993) Overproduction
and single-step purification of GAL4 fusion proteins from
Escherichia coli. Gene 126, 105–107.
18. Hawkes, N.A. & Roberts, S.G. (1999) The role of human TFIIB in
transcription start site selection in vitro and in vivo. J. Biol. Chem.
274, 14337–14343.
19. Maldonado, E., Ha, I., Cortes, P., Weis, L. & Reinberg, D. (1990)
Factors involved in specific transcription by mammalian RNA
polymerase II: role of transcription factors IIA, IID, and IIB
during formation of a transcription-competent complex. Mol. Cell
Biol. 10, 6335–6347.
20. Miyawaki, A. & Tsien, R.Y. (2000) Monitoring protein con-
formations and interactions by fluorescence resonance energy
transfer between mutants of green fluorescent protein. Methods
Enzymol. 327, 472–500.
21. Nikolov, D.B., Chen, H., Halay, E.D., Usheva, A.A., Hisatake,
K.,Lee,D.K.,Roeder,R.G.&Burley,S.K.(1995)Crystal
structure of a TFIIB-TBP-TATA-element ternary complex.
Nature 377, 119–128.
22. Miyawaki, A., Griesbeck, O., Heim, R. & Tsien, R.Y. (1999)
Dynamic and quantitative Ca2+ measurements using improved
cameleons. Proc. Natl Acad. Sci. USA 96, 2135–2140.
23. Pinto, I., Wu, W.H., Na, J.G. & Hampsey, M. (1994) Char-
acterization of sua7 mutations defines a domain of TFIIB involved
in transcription start site selection in yeast. J. Biol. Chem. 269,
30569–30573.
24. Buratowski, S. & Zhou, H. (1993) Functional domains of tran-
scription factor TFIIB. Proc. Natl Acad. Sci. USA 90, 5633–5637.
25. Bangur, C.S., Pardee, T.S. & Ponticelli, A.S. (1997) Mutational
analysis of the D1/E1 core helices and the conserved N- terminal
region of yeast transcription factor IIB (TFIIB): identification of
an N-terminal mutant that stabilizes TATA-binding protein-
TFIIB-DNA complexes. Mol. Cell Biol. 17, 6784–6793.
26. Phillips, G.N. Jr (1997) Structure and dynamics of green fluores-
cent protein. Curr. Opin. Struct. Biol. 7, 821–827.
27. Bangur, C.S., Faitar, S.L., Folster, J.P. & Ponticelli, A.S. (1999)
An interaction between the N-terminal region and the core
domain of yeast TFIIB promotes the formation of TATA-binding
protein-TFIIB-DNA complexes. J. Biol. Chem. 274, 23203–23209.
28. Grossmann, J.G., Sharff, A.J., O’Hare, P. & Luisi, B. (2001)
Molecular shapes of transcription factors TFIIB and VP16 in
solution: implications for recognition. Biochemistry 40, 6267–
6274.
29. Truong, K., Sawano, A., Mizuno, H., Hama, H., Tong, K.I., Mal,
T.K., Miyawaki, A. & Ikura, M. (2001) FRET-based in vivo
Ca2+ imaging by a new calmodulin-GFP fusion molecule. Nat.
Struct. Biol. 8, 1069–1073.
30. Harpur, A.G., Wouters, F.S. & Bastiaens, P.I. (2001) Imaging
FRET between spectrally similar GFP molecules in single cells.
Nat. Biotechnol. 19, 167–169.
31. Takemoto, K., Nagai, T., Miyawaki, A. & Miura, M. (2003)
Spatio-temporal activation of caspase revealed by indicator that is
insensitive to environmental effects. J. Cell Biol. 160, 235–243.
32. Mochizuki, N., Yamashita, S., Kurokawa, K., Ohba, Y., Nagai,
T., Miyawaki, A. & Matsuda, M. (2001) Spatio-temporal images
of growth-factor-induced activation of Ras and Rap1. Nature 411,
1065–1068.
33. Stryer, L. (1978) Fluorescence energy transfer as a spectroscopic
ruler. Annu. Rev. Biochem. 47, 819–846.
34. Patterson, G.H., Piston, D.W. & Barisas, B.G. (2000) Forster
distances between green fluorescent protein pairs. Anal. Biochem.
284, 438–440.
Ó FEBS 2004 FRET studies on TFIIB–TBP–DNA interactions (Eur. J. Biochem. 271) 799
Supplementary material
The following material is available from http://blackwell
publishing.com/products/journals/suppmat/EJB/EJB3983/
EJB3983sm.htm
Fig. S1. Optical properties of CYIIB and comparison with
those of ECFP and EYFP. (A) Absorbance spectra of
CYIIB (2.5 l
M
) shown in blue and of a 1 : 1 mixture of
ECFP and EYFP (2.5 l
M
each) in red. (B) Emission spectra
of ECFP–TFIIB shown in blue and ECFP in red (excitation
at 437 nm). (C) Emission spectra of CYIIB shown in blue
and EYFP in red (excitation at 514 nm). In B and C, the
protein concentrations of CYIIB, ECFP and EYFP were all
kept at % 60 n
M
.
Fig. S2. Gel mobility shift assay showing that TBP and
TFIIB or CYIIB can form a stable complex at the AdML
promoter. recombinant TBP (2 ng) and 5 ng of either
TFIIB or CYIIB were added as shown above the autora-
diogram. Anti-TFIIB Ig or preimmune serum were included
in the binding reaction where indicated. The anti-TFIIB Ig
was described previously [18].
800 L. Zheng et al. (Eur. J. Biochem. 271) Ó FEBS 2004