Báo cáo khoa học:The principle of flux minimization and its application to estimate stationary fluxes in metabolic networks docx
Bạn đang xem bản rút gọn của tài liệu. Xem và tải ngay bản đầy đủ của tài liệu tại đây (1.38 MB, 18 trang )
The principle of flux minimization and its application to estimate
stationary fluxes in metabolic networks
Hermann-Georg Holzhu¨ tter
Humboldt-University Berlin, Medical School (Charite
´
), Institute of Biochemistry, Berlin, Germany
Cellular functions are ultimately linked to metabolic fluxes
brought about by thousands of chemical reactions and
transport processes. The synthesis of the underlying enzymes
and membrane t ransporters causes the cell a certain ÔeffortÕ
of energy and external resources. Considering that those cells
should have had a selection advantage during natural evo-
lution that enabled them to fulfil vital functions (such as
growth, d efence against toxic compounds, r epair of DNA
alterations, etc.) with minimal effort, one may p ostulate the
principle of flux minimization, as follows: given the available
external substrates and given a set of functionally important
ÔtargetÕ fluxes required to accomplish a specific pattern
of cellular functions, the stationary metabolic fluxes have
to become a m inimum. T o convert this principle into a
mathematical method enabling the prediction of stationary
metabolic fluxes, the total flux in the n etwork is me asured
by a weighted linear combination of all individual fluxes
whereby the thermodynamic equilibrium constants are used
as weighting factors, i.e. the more the thermodynamic
equilibrium lies on t he right-hand side o f the reaction, the
larger the weighting factor for the backward reaction. A
linear programming technique is applied to m inimize the
total flux at fixed values of the target fluxes and under the
constraint of flux balan ce (¼ steady-state conditions) with
respect to all metabolites. The theoretical concept is applied
to two metabolic schemes: the energy and redox metabolism
of erythrocytes, and the central metabolism of Methylobac-
terium extorquens AM1. The flux rates predicted by the flux-
minimization method exhibit significant correlations with
flux rates obtained b y either k inetic modelling o r direct
experimental determination. Larger deviations occur for
segments of the network composed of redundant branches
where the flux-minimization method always attributes the
total flux to the thermodynamically most favourable branch.
Nevertheless, compared with existing methods of structural
modelling, the principle of flux minimization appears to be
a promising theoretical approach to assess stationary flux
rates in metabolic systems in cases where a detailed kinetic
model is not yet available.
Keywords: optimality principle; flux balance; kinetic model;
metabolic network; systems biology.
Correspondence to H G. Holzhu
¨
tter, Humboldt University Berlin, Medical Faculty (Charite
´
), Institute of Biochemistry, Monbijoustr. 2,
10117 Berlin, Germany. Fax: + 49 30 450 528 942, Tel.: + 49 30 450 528 166, E-mail:
Abbreviations: FBA, flux-balance analysis; OAA, oxaloacetate; PHB, poly b-hydroxy butyrate.
Enzymes: hexokinase (EC 2.7.1.1); phosphohexose isomerase (EC 5.3.1.9); phosphofructokinase (EC 2.7.1.11); aldolase (EC 4.1.2.13); triose-
phosphate isomerase (EC 5.3.1.1); glyceraldehyde-3-phosphate dehydrogenase (EC 1.2.1.12); phosphoglycerate kinase (EC 2.7.2.3); bisphospho-
glycerate mutase (EC 5.4.2.4); bisphosphoglycerate phosphatase (EC 3.1.3.13); phosphoglycerat e mutase (EC 5.4.2.1); enolase (EC 4.2.1.11);
pyruvate kinase (EC 2.7.1.40); lactate dehydrogenase (EC 1.1.1.28); adenylate kinase (EC 2.7.4.3); glucose-6-phosphate dehydrogenase (EC
1.1.1.49); phosphogluconate dehydrogenase (EC 1.1.1.44); glutathione reductase (EC 1.8.1.7); phosphoribulose epimerase (EC 5.1.3.1); ribose
phosphate isomerase (EC 5.3.1.6); transketolase (EC 2.2.1.1); transaldolase (EC 2.2.1.2); p hospho ribosylpyro phosph ate synthetase (EC 2.7.6.1);
transketolase (EC 2.2.1.1); ethanol dehydrogenase (EC 1.1.1.244); methylene H4F dehydrogenase (MtdA) (EC 1.5.1.5); m ethenyl H4F cyclo-
hydrolase (EC 3.5.4.9); formyl H4F synthetase (EC 6 .3.4.3); formate dehydrogenase (EC 1.2.1.2); formaldehyde-activating enzyme (EC
unknown1); methylene H4MPT dehydrogenase (MtdB) (EC unknown); methylene H4MPT dehydrogenase (MtdA) (EC unknown); methenyl
H4MPT cyclohydrolase (EC 3.5.4.27); formyl MFR:H4MPT formyltransferase (EC unknown); formyl MFR dehydrogenase (EC 1.2.99.5) serine
hydroxymethyltransferase (EC 2.1.2.1); serine-glyoxylate aminotransferase (EC 2.6.1.45); h ydroxypyruvate reductase (EC 1.1.1.81); glycerate
kinase (EC 2.7.1.31); PEP carboxylase (EC 4.1.1.31); malate dehydrogenase ( EC 1.1.1.37); malate thiokinase (EC 6.2.1.9); malyl-CoA lyase
(EC 4.1.3.24); pyruvate dehydrogenase (EC 1.2.4.1); citrate synthase (EC 2.3.3.1); aconitase (EC 4.2.1.3); isocitrate dehydrogenase (EC 1.1.1.42);
a-KG dehydrogenase (EC 1.2.1.52); succinyl-CoA synthetase (EC 6.2.1.4); succinyl-CoA hydrolase (EC 3.1.2.3); succinate d ehydrogenase (EC
1.3.5.1); fumarase (EC 4.2.1.2); malic enzyme (EC 1.1.1.38); pyruvate carboxylase (EC 6.4.1.1); PEP carboxykinase (EC 4.1.1.32); b-ketothiolase
(EC 2.3.1.16); acetoacetyl-CoA reductase (NADPH) (EC 1.1.1.36); PHB synthase (EC 2.3.1 ); PHB depolymerase (EC 3.1.1.75); b-hydroxy-
butyrate dehydrogenase (EC 1.1.1.30): acetoacetate-succinyl-CoA transferase (EC 2.8.3.5);
D
-crotonase (EC 4.2.1.17);
L
-crotonase (EC 4.2.1.17);
acetoacetyl-CoA reductase (NADH) (E C 1.1.1.35); croto nyl-CoA reductase (EC 1 .3.1.8); propionyl-CoA carboxylase (EC 6 .4.1.3); methylmalonyl-
CoA mutase (EC 5.4.99.2); NADH-quinone oxidor eductase (EC 1.6.99.5); cytochrome oxidase (EC 1.10.2.2); ubiquinone oxidoreductase (EC
1.5.5.1); NDP kinase (EC 2.7.4.6); transhydrogenase (EC 1.6.1.2); 3-phosphoglycerate dehydrogenase (EC 1.1.1.95); phosphoserine transaminase
(EC 2.6.1.52); phosphoserine phosphatase (EC 3.1.3.3); glutamate dehydrogenase (EC 1.4.1.4).
Note: The mathematical model described here has been submitted to the Online Cellular Systems Modelling Database and can be accessed at
tter/index.html free of charge.
(Received 16 March 2004, revised 3 May 2004, accepted 12 May 2004)
Eur. J. Biochem. 271, 2905–2922 (2004) Ó FEBS 2004 doi:10.1111/j.1432-1033.2004.04213.x
Complex cellular functions, such as motility, growth,
replication, defence against toxic compounds and repair o f
molecular d amage, are ultimately linked to metabolic
processes. Metabolic processes can be grossly subdivided
into chemical reactions and me mbrane transport processes,
most being catalysed by enzymes and facilitated by specific
membrane transporters. The activity o f these proteins can
be modulated by various modes of regulation, such as
allosteric effectors, reversible phosphorylation and temporal
gene expression. These regulatory mechanisms that are
operative at the molecular level have evolved during natural
evolution and enable the cell to adapt its metabolic activities
to specific functional requirements.
Mathematical modelling of metabolic networks has a
long tradition i n computational biochemistry ( reviewed in
[1]). Mathematical m odels of metabolic systems facilitate
the study of systems behaviour by means of computer-based
Ôin silicoÕ simulations. This type of mathematical analysis
may provide deeper insights into the regulation and control
of the metabolic system studied [2]. Moreover, kinetic
simulations of metabolic networks may partially replace
time-consuming and expensive experiments to explore
possible metabolic alterations of the cell induced by varying
external conditions (e.g. pH value, concentration of sub-
strates, concentration of toxic compounds, concentration of
signalling molecules) and thus may provide a valuable
heuristics for future experimental work.
It is the common v iew that realistic kinetic modelling of
metabolic networks needs detailed r ate equations for e ach
of the participating metabolic processes. Derivation of a
reliable rate equation requires detailed knowledge of all
physiological effectors influencing the activity of the cata-
lyzing enzyme and the determination of r ate-vs concentra-
tion relationships for all these effectors. Thus, realistic
mathematical modelling of a metabolic pathway turns out
to be a tedious, time-consuming enterprise, which, to date,
has been s uccessfully undertaken only for a f ew pathways,
e.g. the main metabolic pathways of erythrocytes [3–9] or
glycolysis in yeast cells [10]. For most metabolic pathways,
and most cell types, the available enzyme–kinetic knowledge
is currently still insufficient t o permit realistic mathematical
modelling.
To obtain at least a qualitative estimate of stationary
metabolic flux rates w ithout knowledge of t he detailed
kinetics of individual processes, t he so-called flux-balance
analysis (FBA) has been proposed [11]. FBA makes u se of
the fact that under steady-state conditions the sum of
fluxes producing o r degrading any ÔinternalÕ metabolite has
to be zero. Application of this m ethod is based on only t wo
prerequisites, namely that (a) the topology of the metabolic
network under consideration has to be known, and (b) an
evaluation cr iterion is needed to identify the most likely
flux distribution among all those flux distributions that are
compatible with the steady-state co nditions. Th e topology
of the m etabolic network i s given in terms of the so-called
stoichiometric matrix, relating the time-dependent vari-
ation of the metabolite concentrations to the fluxes through
all metabolic processes for which an enzyme or transport
protein is available in a given cell type. The topology of
central metab olic pathways is, meanwhile, available for
numerous cell t ypes (see, for example, ome.
ad.jp/kegg). In the first place, this is the result of i ntensive
enzymological work carried out during the last four
decades. More recently, the sequencing of complete
genomes and the development of biostatistical techniques
to map genes onto proteins, enable the prediction of
metabolic pathways, even i f the biochemical i dentification
and characterization of the underlying enzymes is not yet
available.
The Darwinian interpretation of natural evolution con-
siders existing biological systems as the outcome of an
optimization process where the permanent change of
phenotype properties, as a result of mutation and selection,
leads to the optimal adaptation of an organism to given
environmental conditions. Based on this hypothesis, several
optimization studies have been performed in the field of
metabolic regulation, aimed a t the predictio n of enzyme
kinetic properties and enzyme concentration profiles,
ensuring optimal performance of m etabolic pathways
[12–19]. T he theoretical p redictions obtained agree with
experimental observations, at least in a qualitative manner.
In previous applications of FBA, the optimal production of
biomass was used as an optimality criterion [19,20].
Whereas the maximization of biomass production as the
primary objective of the cellular metabolism makes sense for
primitive cells, such as bacteria, which are born to replicate,
the a pplication of FBA to cells with more sophisticated
ambitions needs a more general criterion. Here I propose to
settle this criterion on the following principle o f flux
minimization: given the value of f unctionally relevant
Ôta rgetÕ fluxes, i.e. those fluxes that are d irectly coupled with
cellular functions, the most likely distribution of stationary
fluxes within the metabolic network will be such that the
weighted sum of all fluxes becomes a minimum. This
principle is backed up by the fact that increasing the flux
through any reaction of a metab olic network requires s ome
ÔeffortÕ. This effort can be split into two different categorie s.
First, some metabolic ef fort, in terms of ener gy and other
valuable resources (e.g. essential amino acids), is required to
synthesize sufficiently high amounts o f enzymes and trans-
port proteins. Second, some evolutionary effort has been
required t o improve the specificity, catalytic efficiency and
regulatory control of an enzyme during the long-term
process of n atural evolution. Whereas the metabolic effort
can be measured in units of energy or mass flow, t he
evolutionary effort is a measure of the probability of
favourable mutational events t hat increase the fidelity of
an enzyme in the context of the metabolic network. The
principle of flux minimization is based on the plausible
assumption that during the ear ly phases o f natural evolu-
tion, the competition for limited external resources repre-
sented a permanent pressure on living cells to fulfil their
functions with minimal effort.
Employing the principle of flux minimization for the
calculation of s tationary metabolic fluxes results in the
solution of a constrained linear optimization problem:
consider the set of all flux distributions meeting the flux
balance relations dictated by the stoichiometry of the system
and pick out the distribution for which the total flux
becomes a minimum. The first part of this report briefly
outlines the mathematical basis of the method. The second
part presents two applications of the method to the
metabolism of erythrocytes and of the microorganism,
Metylobacterium extorquens AM1 .
2906 H G. Holzhu
¨
tter (Eur. J. Biochem. 271) Ó FEBS 2004
The mathematical m odel d escribed here has been
submitted to the Online Cellular Systems Modelling Data-
base and can be accessed at />database/holzhutter/index.html free of charge.
Theory/method
We define the complete metabolic network of a specific
cell by the fluxes v
j
(j ¼ 1,2,…,r), through all reactions
for which at least one enzyme (or t ransport protein) can
be expressed, and by the metabolites S
i
(i ¼ 1,2,…,n)
involved in these reactions. T he stoichiometric matrix
indicates how flux v
j
affects the concentration of meta-
bolite S
i
:N
i,j
>0,N
i,j
molecules of m etabolite (i) are
formed during a single reaction (j); N
ij
<0,N
i,j
molecules of m etabolite (i) are consumed during a single
reaction (j); and N
ij
¼ 0, metabolite (i) is not involved in
reaction (j). For example, for the flux v
8
through the
chemical reaction 2S
1
þ S
2
!
v
8
S
3
þ 3S
4
, the elements of
the s toichiometric m atrix read: N
18
¼ )2, N
28
¼ )1,
N
38
¼ 1, and N
48
¼ 3.
In general, the fluxes v
j
may b e positive o r negative, i.e.
the net rea ction may p roceed either in a forward or a
backward direction. To deal with non-negative variables,
the flux v
j
is decomposed into an irreversible forward flux,
v
ðþÞ
j
(the net reaction p roceeds from le ft to right), an d an
irreversible backward flux, v
ðÞ
j
(the net reaction proceeds
from right to left), a s follows:
v
j
¼ v
ðþÞ
j
v
ðÞ
j
v
ðþÞ
j
¼ v
j
Hðv
j
Þ; v
ðÞ
j
¼ v
j
½Hðv
j
Þ1ð1Þ
where Q (x) d enotes the unit-step function, i.e. by definition
only one of the two components v
ðþÞ
j
and v
ðÞ
j
can b e
different from zero. The forward direction is defined as that
which would ensure a positive Gibbs free energy change
under standard conditions (where all reagents are present
at unit concentrations); at these standard conditions the
backward flux is defined to be zero.
The steady-state fluxes have to obey the flux-balance
conditions:
X
r
j¼1
N
ij
v
j
¼
X
r
j¼1
N
ij
ðv
ðþÞ
j
v
ðÞ
j
Þ¼0 ði ¼ 1; :::; nÞð2Þ
representing the principle of conservation of mass for a
homogeneous reaction system. The flux balance c onditions
shown in equation system (2) constitute a homogeneous
system of linear equations with respect t o t he unknown
fluxes. For realistic metabolic systems, the number of fluxes
is larger than the number of metabolites, i.e. r > n. Thus,
equation system (2) is underdetermined, i.e. i t possesses an
infinite number o f solutions.
Setting target fluxes through functionally essential
reactions
To accomplish a particular functional state of the cell, the
fluxes through a certain number of ÔtargetÕ reactions have to
be maintained at nonzero values. This can be expressed by
equality constraints of the form:
v
j
¼ L
j
; L
j
> 0 ðj ¼ j
1
; j
2
; :::Þð3Þ
Some of the target reactions as, for example, the production
of en ergy (ATP) or the synthesis of membran e phospho-
lipids, are permanently required to e nsure cell integrity.
Other target reactions as, for example, the synthesis of a
hormone or the detoxification of a pharmaceutical, may be
only t emporarily required. The s election of target fluxes is
somewhat arbitrary. For example, the demand f or a
continuous synthesis o f phospholipids can be instantiated
by introducing the total amount of phospholipids as a
model v ariable a nd putting either the flux of phospholipids
degradation or t he flux of phospholipids s ynthesis to a
nonvanishing value.
Flux constraints arising from the availability
of external metabolites
The nonequilibrium state of biochemical reaction systems is
maintained by a steady uptake of energy-rich, low-entropy
substrates and the release of l ow-energy, high-entropy
products. The absence of a certain substrate associated with
the exchange flux, v
i
, can be expressed by forcing the uptake
component of the flux to zero, as follows:
v
ðuptakeÞ
i
¼ 0 ð4Þ
Thermodynamic evaluation of fluxes: irreversibility
of reactions
The direction of any flux v
j
is dictated by the change of
Gibbs free energy:
DG
j
¼ DG
ð0Þ
j
þ RT ln
Q
n
i¼1
½S
i
N
ðþÞ
j
Q
n
i¼1
½S
i
N
ðÞ
j
0
B
B
@
1
C
C
A
with N
ðþÞ
ij
¼ N
ij
if N
ij
0; N
ðÞ
ij
¼N
ij
if N
ij
0 ð5Þ
where DG
ð0Þ
j
denotes the change of Gibbs free energy under
the condition that all reactants are present at un it con-
centrations (¼ 1molÆL
)1
). DG
ð0Þ
j
can be expressed through
the thermodynamic equilibrium constant K
equ
i
, as follows:
DG
ð0Þ
j
¼RT lnðK
equ
j
Þð6Þ
where RT ¼ 2.4 8 kJÆmol
)1
at room temperature (25
C).
As stated above, all reactions of the network will be notated
such that under s tandard conditions DG
ð0Þ
j
£ 0, K
equ
i
1,
and thus v
j
>0v
ðÞ
j
¼ 0. The second term in the right-
hand side of Eqn (5) depends upon the actual concentra-
tions of the reactants which, und er cellular conditions, may
strongly deviate from unit concentrations. With accumula-
ting concentrations of the reaction p roducts ( appearing i n
the nominator) and/or vanishing concentrations of the
reaction substrates (appearing in the denominator), the
concentration-dependent term in Eqn ( 5) may assume
arbitrarily large negative values, i.e. in principle the direction
of a chemical reaction can always be reversed provided that
other reactions in the system are capable o f accomplishing
the required change in the concentra tion of the reac tants.
For example, the standard free energy change of the glyco-
Ó FEBS 2004 Flux minimization (Eur. J. Biochem. 271) 2907
lytic reaction ( glycerol aldehyde phosphate fi dihydroxy
acetone phosphate) catalyzed by the enzyme triose phos-
phate isomerase amounts to DG
(0)
¼ )7.94 kJ Æmol
)1
K
equ
TIM
¼ 24.6. Nevertheless, under cellular conditions this
reaction proceeds i nto a backward direction (dihydroxy
acetone phosphate fi glyceraldehyde phosphate) as the
reaction substrate g lycerol aldehyde phosphate is rapidly
converted into 1,3-bisphosphoglycerate along the glycolytic
pathway. This example shows that a sharp classification
into reversible and irreversible reactions on the sole basis of
DG
(0)
can be problematic. Instead, we will use the value of
the equilibrium constant as a weighting factor for the
measure F of the total flux:
U ¼
X
r
j¼1
ðv
ðþÞ
j
þ K
equ
j
v
ðÞ
j
Þð7Þ
Weighting the backward flux with the thermodynamic
equilibrium constant takes into account the thermodynamic
effort connected with reversing the ÔnaturalÕ direction o f the
flux. Below, we w ill discuss the flux-minimized steady-state
of the c omplete metabolic system if the flux distribution
satisfies the side c onstraints of E qns (2)–(4) a nd yield s
a minimum of the flux evaluation function F defined by
Eqn (7).
Results
Flux-minimized steady-states of the erythrocyte
metabolism
The method outlined above w as applied to the metabolic
scheme for erythrocytes depicted in Fig. 1. The meaning of
the abbreviations used in the scheme, and the numerical
values of the equilibrium constants of the reactions, a re
depicted in Table 1. The schem e takes into a ccount two
cardinal metabolic pathways of this ce ll: glycolysis, i nclu-
ding the so-called 2,3-bisphosph oglycerate shunt; and the
pentose phosphate cycle, comprising an oxidative a nd a
nonoxidative part. The model comprises 30 reactions and 29
metabolites, whereby only 25 metabolites are independent
because there are four conservation conditions:
AMP + ADP + ATP ¼ const. ¼ A; NAD + NADH ¼
const. ¼ ND; NADP + NADPH ¼ const. ¼ NDP; a nd
GSH + ½ GSSG ¼ const. ¼ G. Note that in the reaction
scheme the orientation of the arrows corresponds to the
ÔnaturalÕ direction of the reactions which, as declared above,
is defined as that direction which would ensure a positive
Gibbs free energy change under standard conditions.
For the calculation of stationary and time-dependent
states of th e reaction scheme i n Fig. 1 , a comprehe nsive
mathematical model w as used that takes into account the
detailed kinetics of the participating enzymes. This m athe-
matical model comprises the rate equations outlined previ-
ously [8] and, additionally, a rate equation for the transport
of glucose between the cytoplasm and the external space [21]:
v ¼
v
max
K
m ext
Glc
ext
Glc
K
equ
1 þ
Glc
ext
K
m ext
þ
Glc
K
m in
þ a
Glc
ext
K
m ext
Glc
K
m in
ð8Þ
{kinetic parameters: V
max
¼ 74 520 m
M
Æh
)1
[22]; K
m
_
ext
¼
1.7 m
M
, K
m
_
in
¼ 6.9 m
M
, a ¼ 0.54 (calculated as indicated
previously [23]); K
eq
¼ 1}.
The mathematical model has been shown to provide
reliable s imulations of tim e-dependent and s tationary
metabolic states of the erythrocyte under a variety of
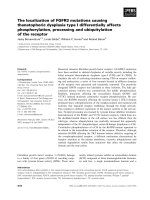
Fig. 1. Metabolic scheme depicting parts of the erythrocyte metabolism analysed by using the flux-minimization method. Note that the reaction arrows
point in the direction of the net reaction under standard conditions for which reactions 3, 5, 6, 7, 11 and 29 differ from the direction under in vivo
conditions. Reac tions, e nzymes, e quilibrium constants and metabolites are as explained in Tables 1 and 2. Target reactions with fixed flux values are
indicated by red arrows, exchange fluxes with the external medium are symbolized by blue arrows. Reaction numbers (Table 1) are given in green.
2908 H G. Holzhu
¨
tter (Eur. J. Biochem. 271) Ó FEBS 2004
Table 1. Reactions of the metabolic scheme shown in Fig. 1: enzymes, thermodynamical equilibrium constants, flux dependencies and calculated flux values.
Reaction Enzyme/transporter Abbr. K
equ
Dependency on independent fluxes
In vivo value
Flux minimization Kinetic model
v
1
a
Glc(out) fi Glc(in) Glucose transporter Glc
t
1.00E+00 1.506 1.514
v
2
Glc + ATP fi Glc6P + ADP Hexokinase HK 3.90E+03 ¼ v
1
1.506 1.514
v
3
Fru6P fi Glc6P Phosphohexose isomerase GPI 2.55E+00 ¼ 5v
1
) 3v
9
) 14 v
26
) 3v
16
)1.459 )1.417
v
4
Fru6P +ATPfi Fru1,6P + ADP Phosphofructokinase PFK 1.00E+05 ¼ ) v
1
+4v
26
+v
9
+v
16
1.473 1.465
v
5
DHAP + GraP fi Fru1,6P Aldolase ALD 8.77E+00 ¼ v
1
) 4v
26
) v
9
) v
16
)1.473 )1.465
v
6
GraP fi DHAP Triosephosphate isomerase TPI 2.46E+01 ¼ v
1
) 4v
26
) v
9
) v
16
)1.473 )1.465
v
7
1,3PG + NADH fi GraP + Pi + NAD Glyceraldehyde-3-phosphate
dehydrogenase
GAPDH 5.21E+03 ¼ )3v
26
) v
9
) v
16
)2.953 )2.953
v
8
1,3PG + ADP fi 3PG + ATP Phosphoglycerate kinase PGK 1.46E+03 ¼ 3v
26
+v
16
2.459 2.459
v
9
b
1,3PG fi 2,3PG Bisphosphoglycerate mutase DPGM 1.00E+05 0.494 0.494
v
10
2,3PG fi 3PG + Pi Bisphosphoglycerate
phosphatase
DPGase 1.00E+05 ¼ v
9
0.494 0.494
v
11
2PG fi 3PG Phosphoglycerate mutase PGM 6.90E+00 ¼ )3v
26
) v
9
) v
16
)2.953 )2.953
v
12
2PG fi PEP Enolase EN 1.70E+00 ¼ 3v
26
+v
9
+v
16
2.953 2.953
v
13
PEP + ADP fi Pyr + ATP Pyruvate kinase PK 1.38E+04 ¼ 3v
26
+v
9
+v
16
2.953 2.953
v
14
Pyr + NADH fi Lac + NAD Lactate dehydrogenase LDH 9.09E+03 ¼ 3v
26
+v
9
+v
16
2.953 2.953
v
15
Pyr + NADPH fi Lac + NADP Lactate dehydrogenase LDH(P) 1.42E+03 ¼ 12 v
1
) 6v
9
) 28 v
26
) 6v
16
) v
21
0.000 0.100
v
16
b
ATP fi ADP + Pi ATPase ATPase 1.00E+05 2.382 2.382
v
17
2ADP fi ATP + AMP Adenylate kinase AK 4.00E+00 ¼ ) v
26
)0.026 )0.026
v
18
Glc6P +NADPfi 6PG + NADPH Glucose-6-phosphate
dehydrogenase
Glc6PD 2.00E+03 ¼ 6v
1
) 3v
9
) 14 v
26
) 3v
16
0.047 0.097
v
19
6PG + NADP fi Ru5P +CO
2
+ NADPH Phosphogluconate
dehydrogenase
6-PGD 1.42E+02 ¼ 6v
1
) 3v
9
) 14 v
26
) 3v
16
0.047 0.097
v
20
GSSG + NADPH fi 2GSH + NADP Glutathione reductase GSSGR 1.04E+00 ¼ v
21
0.093 0.093
v
21
b
GSH fi GSSG Glutathione oxidation GSHox 1.00E+05 0.093 0.093
v
22
Ru5P fi X5P Phosphoribulose epimerase EP 2.70E+00 ¼ 4v
1
) 2v
9
) 10 v
26
) 2v
16
0.014 0.047
v
23
Ru5P fi R5P Ribose phosphate isomerase KI 3.00E+00 ¼ 2v
1
) 4v
26
) v
9
) v
16
0.033 0.049
v
24
X5P + R5P fi GraP + S7P Transketolase TK1 1.05E+00 ¼ 2v
1
) 5v
26
) v
9
) v
16
0.007 0.024
v
25
S7P + GraP fi E4P + Fru6P Transaldolase TA 1.05E+00 ¼ 2v
1
) 5v
26
) v
9
) v
16
0.007 0.024
v
26
b
R5P + ATP fi AMP + PrPP Phosphoribosylpyro-
phosphate synthetase
PRPPS 1.00E+05 0.026 0.026
v
27
X5P + E4P fi GraP + Fru6P Transketolase TK2 1.20E+00 ¼ 2v
1
) 5v
26
) v
9
) v
16
0.007 0.024
v
28
Pi(out) fi Pi(in) Phosphate transporter P
t
1.00E+00 ¼ 3v
26
0.077 0.077
v
29
Lac(out) fi Lac(in) Lactate exchange Lact 1.00E+00 ¼ 25 v
26
+5 v
9
+5 v
16
)12 v
1
+v
21
)2.953 )3.053
v
30
Pyr(out) fi Pyr(in) Pyruvate exchange Pyr
t
1.00E+00 ¼ 12 v
1
) 28 v
26
) 6v
9
) 6v
16
) v
21
0.000 0.100
a
Independent flux;
b
given target flux.
Ó FEBS 2004 Flux minimization (Eur. J. Biochem. 271) 2909
external conditions. Thus, metabolic steady states computed
by means of the kinetic model can be used to assess the
reliability of flux rates c omputed by means of the flux-
minimization method.
The target reactions consid ered in this example are (a)
ATP utilization (v
16
) which is mostly spent on the Na/K
ATPase to maintain Na/K gradients across the plasma
membrane, (b) glutathione (GSH) oxidation (v
21
)toprevent
oxidative damage of cellular proteins and lipids, (c)
formation of 2,3-bisphosphoglycerate ( v
9
) required to
modulate oxygen affinity of haemoglobin, and (d) synthesis
of phosphoribosylpyrophosphate (v
26
) required for the
salvage of adenine nucleotides. The magnitude of these
four target reactions depends on the specific ÔexternalÕ
conditions of the cell, such as osmolarity of the blood (or
preservation medium), oxidative stress caused by reactive
oxygen species or lowering of the oxygen tension during
hypoxia.
The equilibrium constants of the reactions are depicted in
Table 1. The flux-balance conditions for the metabolites are
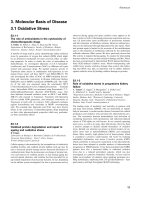
listed in Table 2. The stoichiometric matrix g overning the
relationship between the 25 independent metabolites and 30
reactions is given in F ig. 2. Owing to the linear flux
dependencies imposed by the 25 flux-balance conditions,
there exist only five independent fluxes through which the
remaining 25 fluxes can be expressed as linear combinations
(see column six of Table 1). Four of these five independent
fluxes are the target fluxes; the fifth independent (nontarget)
flux is chosen to be v
1
, t he rate of glucose uptake into the
cell. Thus, given the valu es of the four target fluxes v
9
,v
16
,
v
21
and v
26
, the values of all other stationary fluxes are fully
determined by the v alue of the glucose uptake flux.
Calculation of the stationary state by means of the flux-
minimization method is accomplished b y expressing all
fluxes through the linear combinations given in column six
of Table 1 and determining the minimum of the flux
evaluation function Eqn (7) with respect to the flux v
1
of
glucose uptake ( cf. Fig. 4F). T his yields the value v
1
¼
1.51 m
M
Æh
)1
. The las t two c olumns of Table 1 contain the
flux values obtained by the flux-minimization methods and
by kinetic m odelling. The correlation between these inde-
pendent sets of flux values is shown in Fig. 3 . For better
visualization, fluxes possessing low and high values are
shown in two different panels. The excellent overall
correlation (r
2
¼ 0.9997) cannot hide that larger relati ve
differences remain for the minor fluxes, mostly pertaining to
the hexose monophosphate shunt. This is plausible consid-
ering that under normal in vivo conditions the glycolytic flux
is well determined by the demand of ATP utilization be ing
by far the largest target flux of the s ystem. The fluxes
through the oxidative and nonoxidative pentose phosphate
pathway are less strictly determined by the t arget fluxes:
synthesis of phosphoribosylpyrophosphate can be brought
about along either branches, and the flux through t he
oxidative pentose phosphate pathway is not only deter-
mined by the NADPH consumption of the glutathione
reductase but also by the flux through the NADP-depend-
ent lactate dehydrogen ase. This accounts for the weaker
Table 2. Metabolites and related fl ux ba lance c onditions for the metabolic scheme of the erythrocyte. Conserved moieties: A, sum o f a denine
nucleotides (A ¼ AMP + ADP + ATP); ND, sum of pyridine nucleotides (ND ¼ NAD + N ADH
2
); NDP, sum of P – pyridine nucleotides
(NDP ¼ NADP + NADPH
2
); and G, s um of oxidized and reduced glutathione (G ¼ GSH + GSSG/2). Detailed r ate equations, b inding
equlibria and kinetic parameters of t he kinetic model have been published previously [8].
Metabolite Name Flux balance condition
Glc Glucose v
1
) v
2
¼ 0
Glc6P Glucose-6-phosphate v
2
+v
3
) v
18
¼ 0
Fru6P Fructose-6-phosphate – v
3
) v
4
+v
25
+v
27
¼ 0
Fru(1,6)P
2
Fructose-1,6-bisphosphate v
4
+v
5
¼ 0
GraP Glyceraldehyde-3-phosphate – v
5
) v
6
+v
7
+v
24
) v
25
+v
27
¼ 0
DHAP Dihydroxyacetone phosphate – v
5
+v
6
¼ 0
1,3(P
2
)G 1,3-Bisphospho-
D
-glycerate – v
7
) v
8
) v
9
¼ 0
2,3(P
2
)G 2,3-Bisphospho-
D
-glycerate v
9
) v
10
¼ 0
3PG 3-Phospho-
D
-glycerate v
8
+v
10
+v
11
¼ 0
2PG 2-Phospho-
D
-glycerate – v
11
) v
12
¼ 0
PEP Phosphoenolpyruvate v
12
) v
13
¼ 0
ATP Adenosine triphosphate – v
2
) v
4
+v
8
+v
13
) v
16
+v
17
) v
26
¼ 0
ADP Adenosine diphosphate v
2
+v
4
) v
8
) v
13
+v
16
)2v
17
¼ 0
6PG Phospho-
D
-glucono-1,5-lactone v
18
) v
19
¼ 0
NADP Nicotinamide adenine dinucleotide phosphate v
15
) v
18
) v
19
+v
20
¼ 0
GSH Glutathione 2 v
20
) 2v
21
¼ 0
Ru5P Ribulose-5-phosphate v
19
) v
22
) v
23
¼ 0
X5P Xylulose-5-phosphate v
22
) v
24
) v
27
¼ 0
R5P Ribose-5-phosphate v
23
) v
24
) v
26
¼ 0
S7P Sedoheptulose-7-phosphate v
24
) v
25
¼ 0
E4P Erythrose-4-phosphate v
25
) v
27
¼ 0
NAD Nicotinamide adenine dinucleotide v
7
+v
14
¼ 0
Pi Phosphate v
7
+v
10
+v
16
+v
28
¼ 0
Lac Lactate v
14
+v
15
+v
29
¼ 0
Pyr Pyruvate v
13
) v
14
) v
15
+v
30
¼ 0
2910 H G. Holzhu
¨
tter (Eur. J. Biochem. 271) Ó FEBS 2004
performance of the fl ux-minimization method with respect
to the m inor fluxes through the hexose monophosphate
shunt. N evertheless, the absolute differences are still
acceptable considering that the experimental uncertainty
of flux measurements (e.g. by tracer methods) i s at least
of the same order of magnitude. The most striking
discrepancies occur with respect to the flux rate through
the NADP-dependent lactate dehydrogenase reaction and,
as a consequence of that, the pyruvate uptake. The flux-
minimization method predicts a vanishing flux through the
lactate dehydrogenase [LDH(P)] reaction so that the release
of lactate equals exactly the glycolytic flux. In contrast, the
kinetic m odel yields a nonvanishing flux through the
LDH(P) reaction, having approximately the same magni-
tude as the fluxes in the oxidative pentose phosphate
pathway. The additional consumption of pyruvate by the
LDH(P) has to be c ompensated for by a nonvanis hing
pyruvate uptake. Moreover, the flux through the oxidative
pentose phosphate pathway is also higher than predicted by
the flux-minimization method because a nonzero fl ux
through t he LDH(P) reaction is associated with an
additional consumption of NADPH required for the
reduction of glutathione reductase (GSSG). This discrep-
ancy results from the fact that the flux-minimization method
will force some of the fluxes to zero if alternative reactions
or pathways exist in the network that are ÔcheaperÕ
according to the flux evaluation criterion Eqn (7). However,
strictly vanishing zero-fluxes can n ever be expected in any
branch of the network if the substrates of the reaction a re
present in finite concentrations because e nzyme activities
cannot be completely switched off b y any regulatory
mechanism. Therefo re, zero-fluxe s predicte d b y t he flux-
minimization method have to be interpreted as ÔsmallÕ fluxes
compared with other fluxes in the network. As the fluxes
through the NADP-dependent LDH reaction a nd the
pyruvate exchange calculated by means of the kinetic model
belong to the group of small fluxes, the prediction of a zero-
flux (¼ ÔsmallÕ flux) is i n qualitative agreement with
predictions of the kinetic model.
Remarkably, the optimal value of v
1
¼ 1.51 m
M
Æh
)1
,
obtained by using the flux-minimization approach, is not
simply dictated by intuition. Plotting the values o f repre-
sentative fluxes vs. values of v
1
(Fig. 4A–E), the only
obvious restriction for v
1
arises below the threshold value
v
1
¼ 1.50 m
M
Æh
)1
. Glucose up take below t his threshold
value w ould i mply a thermodynamically unfavourable
regime where the flux thro ugh the oxidative p entose
phosphate pathway had to be reversed to maintain the
target fluxes. Then, the NADPH needed to drive the
reactions of the o xidative pathway into a backwards
direction and to form hexose phosphates from ribose
phosphates by CO
2
fixation must be delivered by the
NADP-dependent LDH. However, there does not exist an
obvious upper threshold restricting v
1
to v alues close to
1.51 m
M
Æh
)1
.Uptothevalueofv
1
¼ 2.98 m
M
Æh
)1
,all
strongly exergonic reactions [hexokinase (HK), phospho-
fructokinase (PFK), pyruvate kinase (PK), glucose-6-phos-
phate dehydrogenase (Glc6PD)] proceed into a forward
direction and the uptake of g lucose exceeding t he ATP-
controlled demand of glycolysis can be c ompensated by a
Fig. 2. Stoichiometric matrix of the reactions constituting the metabolic scheme for the erythrocyte shown in Fig. 1.
Ó FEBS 2004 Flux minimization (Eur. J. Biochem. 271) 2911
correspondingly high flux through the hexose monophos-
phate shunt. In t hat c ase, the surplus of NADPH not
required for reductive processes can be utilized by the
LDH(P), converting pyruvate into lactate. There is no
thermodynamic or kinetic principle excluding the existence
of such a h ypothetical g lucose-wasting and p yruvate-
utilizing metabolic regime . However, the flux-minimization
principle does!
In order to check whether the flux-minimization method
is capable of providing reasonable estimates of stationary
fluxes within a physiologically reliable range of the target
fluxes, steady-state flux distributions of the s ystem were
calculated at different combinations of target fluxes where
the values of each of the target fluxes was normal, increased
by a factor of 2 or decreased by a factor of 0.5. For these 81
different c ombinations o f tar get fluxes, the values of three
representative flux rates obtained by flux minimization and
by kinetic modelling are plotted against each other in Fig. 5.
The correlation between these values is very h igh. Both
methods provide almost identical flux rates of glucose
uptake. However, the flux rates through the two branches of
the hexose monophosphate shunt exhibit a constant shift
against each other, w hich is mostly a result of the fact that
the flux-minimization method puts the flux through t he
NADP-dependent lactate dehydrogenase to zero, whereas
the value calculated by means of the kinetic model is
0.1 m
M
Æh
)1
for all 81 cases. To balance the NADPH
utilized by the LDH(P) reaction, the flux through the
oxidative pentose phosphate pathway is a ctually higher
than the flux through the NADPH-consuming g lutathione
reductase reaction. This causes an extra supply of ribose
phosphates for the synthesis of phosphoribosylpyrophos-
phate. Thus, the flux through the oxidative pentose
phosphate pathway i s still sufficiently high t o satisfy the
supply of t he phosphoribosylpyrophosphate synthetase
with ribose phosphates where the flux minimization method
already predicts negative fluxes through the nonoxidative
pentose phosphate pathway. By increasing the flux through
the phosphoribosylpyrophosphate synthetase by more than
twofold, negative flux rates through t he n onoxidative
pentose phosphate pathway will also be predicted b y the
kinetic model (data not shown).
Flux-minimized steady-states of the central metabolism
in
Methylobacterium extorquens
AM1
As a second example, the flux-minimization method was
applied t o t he central metabolism of M. extorquens AM1.
This bacterium is c apable of growth using C 1 compounds
such as methanol as the only carbon and energy source.
Flux rates through the major pathways of the central
metabolism of this bacterium have been determined by
13
C-
label t racing and mass spectroscopy [24], thus allowing
assessment of the reliability of the results obtained by t he
flux-minimization method. The underlying metabolic
scheme is shown in Fig. 6 . In b rief, formaldehyde i s
produced from methanol by the methanol dehydrogenase
complex. The formaldehyde may react with two pools of
folate compounds: tetrahydrofolate (H
4
F) and tetrahydro-
methanopterin (H
4
MPT). Each of the methylene ad ducts is
involved in further reactions. The scheme in Fig. 6 compri-
ses the following subsystems: formaldehyde metabolism,
glycolysis and gluconeogen esis, the tricarboxylic acid (TCA)
cycle, pentose phosphate shunt, serine cycle, poly b-hydroxy
butyrate synthesis, respiration and oxidative phosphoryla-
tion. The following metabolites can be e xchanged with the
external medium by free or facilitated diffusion: methanol,
CO
2
, formate, glycine, serine, succinate, inorganic
phosphate and formaldehyde. All reactions and corres-
ponding enzymes are given in Table 3. As in the first
example, the reactions are notated such that they proceed
from left to right under standard conditions, i.e. all
equilibrium constants are larger than or equal t o unity.
If available, the values of the equilibrium constants were
as published previously [34], otherwise they were fixed to
the standard values 1 ðDG
ð0Þ
j
¼ 0Þ and 100.0000
ðDG
ð0Þ
j
¼ 28:6kJmol
1
Þ for reactions known to proceed
near or very far from equilibrium, respectively. The
stoichiometric matrix relating the 77 m etabolites to the 78
reactions of the metabolic scheme in Fig. 6 is given in Fig. 7.
Several metabolites of the central metabolism serve as
precursors of the s o-called biomass of the bacterium, or are
formed during biomass synthesis. Utilization or prod uction
of a metabolite associated with biomass production is
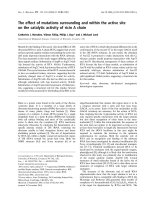
Fig. 3. Comparison of fluxes obtained by the flux-minimization method
and by kinetic modelling [8]. In vivo values of the target fluxes:
v
9
¼ 0.49 m
M
Æh
)1
,v
16
¼ 2.38 m
M
Æh
)1
,v
21
¼ 0.093 m
M
Æh
)1
,v
26
¼
0.026 m
M
Æh
)1
. Upper panel: reactions with flux values lower than
0.2 m
M
Æh
)1
. Lower pane l: re actions w ith fl ux values higher than
0.2 m
M
Æh
)1
. Significant differences between the two types of flux values
occur for the reaction of LDH(P) and the influx of pyruvate (indicated
by a red point).
2912 H G. Holzhu
¨
tter (Eur. J. Biochem. 271) Ó FEBS 2004
indicated b y the red arrows in Fig. 6 . T he biomass of this
bacterium consists mainly of proteins, poly b-hydroxy
butyrate and higher carbohydrates [33]. Reactions descri-
bing the incorporation o f precursor metabolites into the
biomass are considered as the target reactions of the system.
As the stoichiometric proportions with which the precursor
metabolites are consumed or produced during biomass
production have been determined experimentally [24], all
fluxes connecting the precursor metabolites with the
biomass can be expressed through a single flux, the flux of
biomass p roduction (v
78
), m ultiplied by the corresponding
stoichiometric coefficient (see reaction 78 in Table 3).
Using the flux-minimization method, the s teady state of
the central metabolism of M. extorquens was calculated for
a c hemostat-grown culture of bacteria where methanol is
the only carbon source, i.e. the uptake fluxes v
69
–v
76
of
exchangeable carbon compounds, except v
75
(exchange of
methanol), were constrained to zero. The obtained flux
values (given relative to a b asis of 10 mol of C 1 units
entering the system through reaction 1 ) are given in the last
column of Table 3. Intriguingly, 22 (!) fluxes are predicted to
be zero in the flux-minimized state, i.e. they a re dispensable
provided that biomass production is the only function to be
accomplished b y t he centr al metabolis m o f t he bacter ium.
The reduced reaction scheme referring to the flux-minimized
solution is shown in Fig. 8, w here all reactions with
predicted zero fluxes are indicated by using light-grey
arrows. O ne group of reactions with zero fluxes comprises
the exchange fluxes that are directly linked with compounds
that are not present in the external medium or not produced
in excess (reactions 70, 71, 73, 74 and 76). A second group
of reactions predicted to possess zero fluxes in the flux-
minimized state belong to metabolic subsystems that are not
linked with biomass production and w hich are not essential
for m aintaining n onzero fluxes in those branches of t he
complete network that are relevant for biomass production.
An example of such a dis pensable subsystem is the acetyl-
CoA conversion pathway c omprising reactions 49–52.
Although the reaction chain composed of reactions 49–51
allows production of the biomass precursor poly b-hydroxy
butyrate from acetoacetyl-CoA, the flux-minimization
method favours a shorter path comprising only two
reactions (46 and 48). I ntriguingly, the two oxidative
decarboxylation reactions catalyzed by pyruvate dehydro-
genase (reaction 22) and a-ketoglutarate dehydrogenase
(reaction 26), c ommonly regarded to play a c entral role in
the intermediary m etabolism, also belong to the predicted
group of dispensable reactions.
Figure 9 compares the flux rates calculated by means
of the flux-minimization method with experimental data
available for 16 reactions (out of 78). The overall correlation
is suffic iently good ( r
2
¼ 0.68). Striking discrepancies
Fig. 4. Hypothetical fluxes through represen-
tative reac tions of the erythrocyte metabolism
(A–E) and flux evaluation (F) at varying flux of
glucose uptake. Thegraphsshownin(A–E)
correspond to the linear dependencies dictated
by the steady-state conditions (Table 1, c ol-
umn six). The values of the four target fluxes
are the same as in Fig. 2. The value of v
1
¼
1.51 m
M
Æh
)1
, obtained by fl ux min imization, is
indicated by the dotted vertical line. Below
v
1
¼ 1.50 m
M
Æh
)1
, the reaction of the glucose-
6-phosphate dehydrogenase (Glc6PD) has to
proceed in a backwards direction. Up to v
1
¼
2.98 m
M
Æh
)1
, all strongly exergonic reactions
[hexokinase (HK), phosphofructokinase
(PFK), pyruvate kinase (PK), Glc6PD] pro-
ceed in a forward reaction.
Ó FEBS 2004 Flux minimization (Eur. J. Biochem. 271) 2913
remain with respect to the reactions connecting phos-
phoenolpyruvate with m alate. The flux-minimized solution
predicts the c onversion of phosphoenolpyruvate to malate
to proceed mainly along the branch catalyzed by p yruvate
kinase and the malic enzyme (reactions 43 and 42), whereas
the isotope experiment indicates the main flux to proceed
along an alternative branch, having oxalacetate as an
intermediate (Fig. 1 0). Although the relative flux contribu-
tion of the two alternative branches was not correctly
predicted by the flux-minimization method, the predicted
flux of the overall reaction phosphoenolpyruvate fi malate
is close to the experimental value. Interestingly, the overall
reaction along both a lternative routes consists of the
consumption o f CO
2
and N ADH a nd the formation of
ATP (GTP). H owever, the two reactions 42 and 43,
constituting the route favoured by flux-minimization, pro-
ceed both in the ÔnaturalÕ direction, whereas t he direction of
the GTP-d elivering p yruvate carboxykinase reaction (v
45
)
has to be reversed. The flux through reaction 45 will be
weighted (¼ punished), with weight K
45
¼ 12, by the flux-
minimization method. On the o ther hand, avoiding this
thermodynamically unfavourable reactio n and i nstead
achieving the flux to oxaloacetate (OAA) through reaction
18 (phosphoenolpyruvate carboxylase, reaction 18), no
GTP is formed, which, compared with the ATP-producing
pyruvate kinase reaction, is an disadvantage from the
energetic point of view. Hence, from the thermodynamic
and energetic viewpoint, the route phosphoenolpyru-
vate fi OA A fi malate, predicted by the flux-minimi-
zation method as a dominant flux route, seems indeed to be
the more r easonable one. The discrepancies between
predicted and observed fluxes thus may have kinetic or
genetic reasons. Apparently, t he activity of the enzymes
catalyzing the predicted reaction route phosphoenolpyru-
vate fi OAA fi malate is reduced in vivo owing to a low
expression level or to kinetic regulation. This example
highlights certain lim itations of th e flux-minimization
method, despite its obvious capacity to provide valuable
information about flux distributions in metabolic networks.
Discussion
Biology is now facing the era of systems biology. Different
types of biological information (DNA, RNA, protein,
protein interactions, enzymes, m etabolites) can be used to
build up m athematical models of the g ene-regulatory,
signal-transducing a nd metabolic networks of a cell and
to integrate them i nto whole-cell Ôin silicoÕ models. The
predictive capacity of such models w ill increase as more
details of the underlying elementary processes become
incorporated. With respect to metabolic networks, the
current situation is such that only for a few pathways and a
few cell types is sufficient enzyme-kinetic knowled ge avail-
able to build up realistic k inetic models. As the number of
enzymological studies has dramatically decreased since 1998
(according to statistics b ased on entries of enzymological
papers into the d atabase ),
there is little hope that this situation will improve in the near
future.
Structural modelling a pproaches have been proposed as
alternatives to mechanism-based kinetic modelling to better
understand the architecture and regulation of metabolic
networks. These approaches have in common that they
work without enzyme-kinetic information. Only the s toi-
chiometry of the system and, if available, some plausible
side conditions constraining the external fluxes, are used as
Fig. 5. Comparison of fluxes obtained by the flux-minimization method
and by kinetic modelling at various combinations of target fluxes. Atotal
of 3
4
¼ 81 combinations of the four target fluxes was generated by the
stationary solutions of the kinetic model, setting the maximal activities
to 100%, 50% and 200% of the original value.
2914 H G. Holzhu
¨
tter (Eur. J. Biochem. 271) Ó FEBS 2004
input. Schuster and co-workers [25] have developed a
theoretical method to decompose the stationary fluxes in a
metabolic network into e lementary flux modes d efined as
the smallest sets of enzymes that can operate at steady state,
with all enzymes weighted by the relative flux they need to
carry o ut for the mode to function. These elementary flux
modes have strong similarities with the so-called extreme
pathways, forming a basis in the space of flux distributions
restrained by inequality relations [26,28]. Both types of
decomposition allow t he definition of metabolic pathways
in a rigorous quantitative a nd systemic manner [26,27].
Moreover, they have been successfully applied to a ssess the
robustness of metabolic networks against insertions or
deletion of certain enzymes [23,29]. However, these decom-
position methods are not aimed a t estimating the flux rates
in metabolic systems. For this purpose, Palsson and co-
workers h ave developed a theoretical approach, commonly
referred to as flux balance analysis (FBA) [30]. This method
postulates that the most likely distribution of stationary
fluxes in the metabolic network has to be optimal with
respect to a feasible optimization criterion. The definition of
the optimization c riterion is the key point of the whole
Fig. 6. Metabolic scheme of the central metabolism of Methylobacterium extorquens AM1. Red arrows i ndicate u tilizat ion or generation of the
corresponding metabolite during biomass production. Blue arrows indicate exchange fluxes with the external environment. The scheme is based on
information outlined previously [24] and derived from the KEGG database ( Reactions, enzymes and equilibrium
constants are given in Table 3.
Ó FEBS 2004 Flux minimization (Eur. J. Biochem. 271) 2915
Table 3. Reactions and enzymes of the metabolic scheme for Methylobacterium extorquens. Values given are relative to a basis of 10 mol of C1 units entering th e system through reaction 1. PHB, poly
b-hyd roxy butyrate.
# Reaction Keq Enzyme EC no. Value – flux minimization
Formaldehyde metabolism
1 MeOH + NAD fi HCHO + NADH 100 000 Methanol dehydrogenase 1.1.1.244 34.49
2 HCHO + H4F fi methylene-H4F 100 000 Not catalyzed 12.62
3 Methenyl-H4F + NADPH fi methylene-H4F + NADP 7 Methylene H4F dehydrogenase (MtdA) 1.5.1.5 ) 0.24
4 Methenyl-H4F fi formyl-H4F 2 Methenyl H4F cyclohydrolase 3.5.4.9 0.24
5 Formate + ATP + H4F fi formyl-H4F + ADP + Pi 41 Formyl H4F synthetase 6.3.4.3 0.00
6 Formate + NAD fi NADH + CO
2
420 Formate dehydrogenase 1.2.1.2 0.00
7 HCHO + H4MPT fi methylene-H4MPT 100 000 Formaldehyde activating enzyme 13.73
8 Methylene-H4MPT + NAD fi methenyl-H4MPT + NADH 1 Methylene H4MPT dehydrogenase (MtdB) 0.00
9 Methylene-H4MPT + NADP fi methenyl-H4MPT + NADPH 1 Methylene H4MPT dehydrogenase (MtdA) n/a 13.73
10 Methenyl-H4MPT fi formyl-H4MPT 1 Methenyl H4MPT cyclohydrolase 3.5.4.27 13.73
11 Formyl-H4MPT fi CO
2
+ H4MPT 100 000 Formyl MFR:H4MPT formyltransferase 13.73
Serine cycle
12 Serine + H4F fi methylene-H4F + glycine 10 Serine hydroxymethyltransferase 2.1.2.1 ) 12.34
13 Serine + glyox fi h-pyruvate + glycine 1 Serine-glyoxylate aminotransferase 2.6.1.45 12.62
14 h-Pyruvate + NADH fi glycerate + NAD 1 Hydroxypyruvate reductase 1.1.1.81 12.62
15 h-Pyruvate + NADPH fi glycerate + NADP 1 Hydroxypyruvate reductase 1.1.1.81 0.00
16 Glycerate + ATP fi 2PG + ADP 100 000 Glycerate kinase 2.7.1.31 12.62
17 PEP fi 2PG 3 Enolase 4.2.1.11 ) 11.48
18 PEP + CO
2
fi OAA + Pi 1 PEP carboxylase 4.1.1.31 1.25
19 OAA + NADH fi malate + NAD 6260 Malate dehydrogenase 1.1.1.37 0.00
20 Malate + CoA + ATP fi malyl-CoA + ADP + Pi 100 000 Malate thiokinase 6.2.1.9 12.62
21 Glyox + acetyl-CoA fi malyl-CoA 345 Malyl-CoA lyase 4.1.3.24 ) 12.62
TCA cycle
22 Pyruvate + NAD + CoA fi acetyl-CoA + CO
2
+ NADH 100 000 Pyruvate dehydrogenase 1.2.4.1 0.00
23 Acetyl-CoA + OAA fi Cit + CoA 100 000 Citrate synthase 2.3.3.1 0.37
24 Iso-C fi Cit 14 Aconitase 4.2.1.3 ) 0.37
25 a-KG + CO
2
+ NADPH fi Iso-C + NADP 1 Isocitrate dehydrogenase 1.1.1.42 ) 0.37
26 a-KG + NAD + CoA fi Succ-CoA + NADH + CO
2
100 000 a-KG dehydrogenase 1.2.1.52 0.00
27 Succ + GTP + CoA fi Succ-CoA + GDP 2 Succinyl-CoA synthetase 6.2.1.4 ) 3.39
28 Succ-CoA fi Succ + CoA 100 000 Succinyl-CoA hydrolase 3.1.2.3 0.00
29 Succ + FAD-S fi Fum + FADH-S 1 Succinate dehydrogenase 1.3.5.1 3.55
30 Fum fi malate 5 Fumarase 4.2.1.2 3.55
Gluconeogenesis & pentose phosphate pathway
31 2-PG fi 3-PG 7 Phosphoglycerate mutase 5.4.2.1 1.15
32 1.3-DPG + ADP fi 3-PG + ATP 3226 Phosphoglycerate kinase 2.7.2.3 ) 0.71
33 1.3-DPG + NADH fi TP + NAD + Pi 3 Glyceraldehyde-3-P-dehydrogenase 1.2.1.12 0.71
34 2TP fi Fru(1,6)P
2
5555 Aldolase 4.1.2.13 0.00
35 Fru(1,6)P
2
fi Fru6P + Pi 174 Fructose-1,6-bisphosphatase 3.1.3.11 0.00
2916 H G. Holzhu
¨
tter (Eur. J. Biochem. 271) Ó FEBS 2004
Table 3 . (Con tinued).
# Reaction Keq Enzyme EC no. Value – flux minimization
36 Fru6P fi Glc6P 2 Phosphoglucose isomerase 5.3.1.9 ) 1.58
37 Glc6P +NADPfi 6-PG + NADPH 2 Glucose-6-phosphate dehydrogenase 1.1.1.49 ) 1.58
38 PentoP + CO
2
+ NADPH fi 6-PG + NADP 14 6-Phosphogluconate dehydrogenase 1.1.1.44 1.58
39 TP + S7P fi 2 PentoP 2 Transketolase 2.2.1.1 0.56
40 S7P + TP fi Ery-4P + Fru6P 1 Transaldolase 2.2.1.2 ) 0.56
41 Ery-4P + PentoP fi TP + Fru6P 10 Transketolase 2.2.1.1 ) 0.67
42 Malate + NAD fi pyruvate + CO
2
+ NADH 1 Malic enzyme 1.1.1.38 ) 9.08
43 PEP + ADP fi pyruvate + ATP 18 000 Pyruvate kinase 2.7.1.40 9.99
44 Pyruvate + CO
2
+ATPfi OAA + ADP 7 Pyruvate carboxylase 6.4.1.1 0.00
45 OAA + GTP fi PEP+GDP+CO
2
12 PEP carboxykinase 4.1.1.32 0.00
PHB synthesis and acetyl-CoA conversion pathway
46 2 acetyl-CoA fi acetoac-CoA + CoA 1 b-ketothiolase 2.3.1.16 5.56
47 Acetoac-CoA + NADPH fi 3HB-CoA + NADP 1 Acetoacetyl-CoA reductase (NADPH) 1.1.1.36 2.01
48 3HB-CoA fi PHB + CoA 100 000 PHB synthase 2.3.1 2.01
49 PHB fi 3HB 100 000 PHB depolymerase 3.1.1.75 0.00
50 Acetoac + NADH fi 3HB + NAD 526 b-hydroxybutyrate dehydrogenase 1.1.1.30 0.00
51 Acetoac-CoA + Succ fi acetoac + Succ-CoA 100 Acetoacetate-succinyl-CoA transferase 2.8.3.5 0.00
52 Crot-CoA fi 3HB-CoA 6
D
-crotonase 4.2.1.17 0.00
53 L3HB-CoA fi crot-CoA 6
L
-crotonase 4.2.1.17 3.55
54 Acetoac-CoA + NADH fi L3HB-CoA + NAD 1587 Acetoacetyl-CoA reductase (NADH) 1.1.1.35 3.55
55 Crot-CoA + NADPH fi but-CoA + NADP 1 Crotonyl-CoA reductase 1.3.1.8 3.55
56 But-CoA + NAD fi prop-CoA + NADH + CO
2
100 000 Unknown pathway 3.55
57 Mema-CoA + ADP + Pi fi prop-CoA + CO
2
+ ATP 123 Propionyl-CoA carboxylase 6.4.1.3 ) 3.55
58 Mema-CoA fi Succ-CoA 19 Methylmalonyl-CoA mutase 5.4.99.2 3.55
Respiration and energy metabolism
59 NADH + Q fi NAD + 2H + QH2 1 NADH-quinone oxidoreductase 1.6.99.5 12.61
60 QH2 fi Q + 2H 1 Cytochrome oxidase 1.10.2.2 16.16
61 FADH-S + Q fi FAD-S + QH2 1 Ubiquinone oxidoreductase 1.5.5.1 3.55
62 ADP + Pi +2H fi ATP 1 ATPase 28.77
63 GDP + ATP fi GTP + ADP 1 NDP Kinase 2.7.4.6 ) 3.39
64 NADH + NADP fi NADPH + NAD 1 Transhydrogenase 1.6.1.2 0.00
Serine biosynthesis
65 NADH + PHP fi 3-PG + NAD 10 000 3-Phosphoglycerate dehydrogenase 1.1.1.95 ) 0.43
66 a-KG + 3Pser fi PHP + Glu 7 Phosphoserine transaminase 2.6.1.52 ) 0.43
67 3-Pser fi serine 673 Phosphoserine phosphatase 3.1.3.3 0.43
68 a-KG + NADPH fi Glu + NADP 10 000 000 Glutamate dehydrogenase 1.4.1.4 0.43
Exchange
69 CO
2
(out) fi CO
2
1 Ex-CO2 ) 4.73
70 Formate(out) fi formate 1 Ex-formate 0.00
71 Glycine(out) fi glycine 1 Ex-glycine 0.00
Ó FEBS 2004 Flux minimization (Eur. J. Biochem. 271) 2917
approach. It is the common view that principles governing
the design of cells, tissues and organisms can only be
grasped in the context of natural evolution. In the Darwin-
ian sense, n atural evolution i s a p ermanent optimization
process leading to the survival of phenotypes that ar e best
adapted to their natural environment. With respect to
metabolism, the best adaptation to environmental condi-
tions may involve multiple properties such as robustness
against fluctuations in the s upply with external substrates,
or a relative insensitivity to alterations in the structure and
function of the underlying proteins (enzymes, transporters).
It thus has to be doubted that a single evolutionary principle
alone may account for the sophisticated regulation of
metabolic systems of currently existing cells. R esting the
computational prediction of system properties on a sin gle
optimization c riterion a priori holds a c onsiderable degree
of arbitrariness. This principal objection, of course, also
holds true for the approach proposed in this report.
In previous applications of FBA, the maximization of
biomass production was used as such an optimization
criterion. However, when studying the metabolism o f
multifunctional vertebrate cells, for example hepatocytes
or nerve cells, the maximal production of biomass c an
hardly be taken as an appropriate optimization criterion.
Therefore, this report proposes a new variant of flux-
balance analysis that relies on the principle of flux minimi-
zation. This principle captures the obvious fact that gaining
functional fitness with minimal expense o f external
resources and along the s hortest route in the evolutionary
landscape must have been a decisive selection factor during
the natural evolution of cellular systems. For the special case
that the f unctionality of a cell is reducible to rapid self-
reproduction, gaining a maximal biomass production at a
given total flux is obviously equivalent to maintaining a
given rate of biomass production at a minimum of the total
flux. Insofar, the principle of maximal biomass production
is a special case of the more general principle of flux
minimization. It has to be noted, furthermore, that mini-
mization of fluxes in a metabolic system is closely linked to
minimization of enzyme levels, because both properties are
directly related to each other. I t is a well-known feature of
gene regulation to switch off enzymes that belong to
temporarily ÔjoblessÕ metabolic pathways [31].
The mathematical formulation of the proposed optimi-
zation principle consists of the definition of a flux
evaluation function which is t o be minimized under the
side constraints that the steady-state con ditions (flux
balances) are met with respect to all internal metabolite s.
In the definition of the flux evaluation function (Eqn 7),
the backward direction of fluxes (with respect to the
ÔnaturalÕ direction o f the reaction under standard condi-
tions) is weighted by the thermodynamic equilibrium
constant of the reaction t o take into account that reversing
the d irection o f fluxes becomes more a nd more unfavour-
able from the thermodynamic viewpoint, a s the thermo-
dynamic equilibrium constant of the r eaction increase s.
Although this way of weighting the backward fluxes is
purely empirical and lacks straightforward physical or
chemical reasoning, it has the advantage of avoiding any a
priori assumptions on the irreversibility of r eactions.
By applying the flux-minimization method to c ellular
metabolic networks, one has to identify the so-called target
Table 3 . ( Cont inued).
# Reaction Keq Enzyme EC no. Value – flux minimization
72 HCHO(out) fi HCHO 1 Ex-HCHO ) 8.14
73 Pyruvate(out) fi pyruvate 1 Ex-pyruvate 0.00
74 Serine(out) fi serine 1 Ex-serine 0.00
75 MeOH(out) fi MeOH 1 Ex-MeOH 34.49
76 Succ(out) fi Succ 1 Ex-Succ 0.00
77 Pi(out) fi Pi 1 Ex-Pi 10.64
Biomass production
78 2 methylene-H4F + 11 formyl-H4F + 13 glycine + 7 serine
+ 7 Succ-CoA + 11 PEP + 41 OAA + 53 acetyl-CoA
+ 42 pyruvate + 17 a-KG + 2 TP + 16 Fr-6P + 10 PentoP
+ 5 Ery-4P + 93 PHB + 585 ATP + 240 NADPH + 5 NAD
fi 585 ADP + 240 NADP + 5 NADH + 7 Succ + 60 CoA
+ 13 H4F + 118 CO
2
0.02
2918 H G. Holzhu
¨
tter (Eur. J. Biochem. 271) Ó FEBS 2004
fluxes, i.e. those fluxes that are directly linked to the
physiological functions of the cell. Target fluxes can b e
subdivided into ÔbasicÕ fluxes that are permanently required
at an almost constant level to ensure stability and integrity
of the cell, and ÔvariableÕ target fluxes that may vary
according to the external conditions of the cell or its current
Fig. 7. Stoichiometric matrix of the reactions constituting the metabolic scheme for Methylobacterium extorquens showninFig. 6.Non-zero elements
are highlighted by shading.
Ó FEBS 2004 Flux minimization (Eur. J. Biochem. 271) 2919
functions in the context of the host organism. For the
metabolic network of the erythrocyte discussed in this
report, the production of ATP can be considered a basic
target flux amounting to 1–2 m
M
Æh
)1
, i rrespective of the
specific external conditions of the cell [32]. In contrast, the
other three target fluxes can be termed as variable because
they may significantly c hange under conditions of cellular
stress, as for example, oxidative damages caused by certain
pharmaceuticals or lowered oxygen saturation of haemo-
globin in various forms of hypoxia. In general, the target
fluxes of a metabolic network can be found within the set of
fluxes connecting the network with neighbouring networks
or with the environment (excretion of c ompounds). How-
ever, some basic knowledge about the functions of a given
cell type, and the metabolic prerequisites to enable these
functions to take place, will be necessary to arrive at a
reasonable selection o f target fluxes.
The reliability o f stationary fluxes predicted by the flux-
minimization method was assessed for two metabolic
schemes of different complexity: the energy and redox
metabolism of erythrocytes, an d the central carbon me ta-
bolism of M. extorquens. For the metabolic scheme of the
erythrocyte, a comprehensive and validated kinetic m odel
was available, as the scheme of the bacterium flux rates has
Fig. 8. A reduced metabolic scheme for Methylobacterium extorquens occurs at a flux-minimized steady state if methanol is the only available carbon
source. Reactions with predicted zero fluxes are indicated using light-grey arrows. Red arrows indicate fluxes connected with biomass production,
blue arrows indicate exchange fluxes with the environment.
2920 H G. Holzhu
¨
tter (Eur. J. Biochem. 271) Ó FEBS 2004
been measured by
13
C-labelling and mass spectroscopy. For
the e rythrocyte scheme, all stationary fluxes can be
expressed through the four target fluxes chosen, t he flux
of glucose uptake being the only r emaining variable.
Varying the values of the target fluxes between 50% and
200% of their normal values, the numerical values predicted
by the flux-minimization method are in good agreement
with those calcu lated on the basis of the kinetic model. The
remaining systematic discrepancies are caused by an incor-
rect prediction of the flux through the NADP-depend ent
lactate dehydrogenase reaction. This fact brings up a weak,
but inevitable, point of the theoretical concept in that it
allows the flux to be put through a reaction exactly to zero,
even if the enzyme catalyzing this reaction (which cannot
be down-regulated in the anucleated erythrocyte) and the
substrates fuelling the reaction are both p resent. On the
other hand, despite some s ystematic differences to
the r esults of kinetic modelling, the flux-minimization
method correctly describes the flux changes induced by
changes of the target fluxes. This p roperty could render the
flux-minimization method a valuable tool for predicting
metabolic changes to external perturbations.
Application of the flux-minimization method for the
calculation of stationary states in the central metabolism of
the bacterium M. extorquens enabled a dire ct comparison
with experimentally determined flux rates. A good concor-
dance was found for 12 out of the 16 r eactions for which
experimental data are available (cf. Figure 7). The remain-
ing four reactions, displaying differing flux rates, belong to a
segment of the reaction network co mprising redundant
routes. This discrepancy points to another problem inherent
in the theoretical concept: if there are redundant reactions or
pathways, the flux-minimization method will attribute
fluxes to those being most favourable from the t hermo-
dynamic viewpoint, whereas the others are disabled. This
may lead to a wrong evaluation of flux rates owing to the
presence of unknown regulatory mechanisms restraining
the accessible space of stationary metabolic states and thus
allowing only suboptimal flux distributions with respect to
any optimization criterion. As the flux of the overall
reaction phospho enolpyruvate fi malate was c orrectly
predicted by t he flux-minimization method, one possibility
for overcoming the problem of misevaluating fluxes through
alternative branches might be to further compress the
reaction scheme by lumping together redundant routes to
pseudo-reactions.
In view of all the results obtained, the flux-minimization
method s hould be considered as a s erious alter native to
currently existing structure-based c oncepts to assess sta-
tionary flux distributions in metabolic networks if detailed
kinetic information is lacking.
References
1. Heinrich, R. & Sc huster, S.T. (1996) The Regulation of Cellular
Systems. Chapman & Hall, New York.
2. Fell, D. (1997) Understanding the Control of Metabolism.Portland
Press, London.
3. Rapoport, T.A. & Heinrich, R. (1975) Mathematical analysis o f
multienzyme systems. I. Modelling of th e glycolysis of human
erythrocytes. Biosystems 7, 120–129.
4. Schauer, M., Heinrich, R. & Rapoport, S.M. (1981) [Mathemat-
ical modelling of glycolysis and adenine nucleotide metabolism of
human erythrocytes. I. Reaction-kinetic statements, analysis of
in vivo state and determination of starting conditions for in vitro
experiments]. ActaBiol.Med.Ger.40, 1659–1682.
5. Schauer, M., Heinrich, R. & Rapoport, S.M. (1981) [Mathemat-
ical modelling of glycolysis and of adenine nucleotide metabolism
of human erythrocytes. II. Simulation of adenine nucleotide
Fig. 9. Correlation between flux values determined by the flux-mini-
mization method and experimentally determined by
13
C-labeling [33].
Fig. 10. Flux values for the reactions involved in the conversion of
pyruvate to malate. Violet, experimental v alues [33]; or ange, valu es
predicted by flux minimizatio n; green , reaction numbers (Table 3).
Ó FEBS 2004 Flux minimization (Eur. J. Biochem. 271) 2921
breakdown following glucose depletion]. ActaBiol.Med.Ger.40,
1683–1697.
6. Heinrich, R. (1985) M athematical models of m etabolic systems:
general principles and control of glycolysis and membrane trans-
port in erythroc ytes. Biomed. Biochim. Acta 44, 913–927.
7. Schu ster, R., Holzhu
¨
tter, H.G. & Jacobasch, G. (1988) Interrela-
tions between glycolysis and the hexose monophosphate shunt in
erythrocytes as studied on the basis of a mathematical model.
Biosystems 22, 19–36.
8. Schuste r, R. & H olzhu
¨
tter, H.G. (1995) Use of mathematical
models for predicting the metabolic effect o f large-scale enzyme
activity alte rations. Application to enzyme deficiencies of red
blood cells. Eur. J. Biochem. 229, 403–418.
9. Jamshidi, N., Edwards, J.S., Fahland, T ., Church, G.M. &
Palsson, B.O. (2001) Dynamic simulation of the human red blood
cell metabolic network. Bioinformatics 17, 286–287.
10. Teusink, B., Passarge, J., Reijenga, C.A., Esgalhado, E., van d er
Weijden, C .C., Schepper, M., Walsh, M.C., Bakker, B.M., van
Dam, K ., W esterhoff, H.V. & Sn oep, J .L. (2000) Can yeast
glycolysis be understood in te rms of in vitro kinetics of the
constituent enzymes? Testing biochemistry. Eu r. J. Biochem. 267,
5313–5329.
11. Cornish-Bowden, A. & Cardenas, M.L. (2002) Metabolic balance
sheets. Nature 420, 129–130.
12. Heinrich, R., Holzhu
¨
tter, H.G. & Schuster, S. (1987) A theoretical
approach to th e evolution and structural design of e nzymatic
networks: linear enz ymatic chains, b ranc hed pathways a nd gly-
colysis of erythrocytes. Bull. Math. B iol. 49, 539–595.
13. Heinrich, R., Schuster,S.&Holzhu
¨
tter, H.G. (1991) Mathema-
tical analysis of e nzymic reaction systems using optimization
principles. Eur. J. Biochem. 201, 1–21.
14. Pettersson, G. (1993) Optimal kinetic design of enzymes in a linear
metabolic pathway. Biochim. Biophys. Acta 1164,1–7.
15. Melend ez-Hevia, E., Wad dell, T.G., Heinrich, R. & M ontero,
F. (1997) Theoretical approaches to the evolutionary optimi-
zation of glyc olysis – chemical analysis. Eur. J. Biochem. 244,
527–543.
16. Klipp, E. & Heinrich, R. (1999) Competition for enzymes in
metabolic pathways: implications for optimal distributions of
enzyme co ncentration s an d for the distrib ution o f flux control.
Biosystems 54, 1–14.
17. Varner, J. & Ramkrishna, D. (1998) Application of cybernetic
models to metabolic engineering: investigation of s torage path-
ways. Biotechnol. Bioeng. 58, 282–291.
18. Varner,J.&Ramkrishna,D.(1999)Metabolicengineeringfroma
cybernetic perspective. 1. Theoretical preliminaries. Biotechnol.
Prog. 15, 407–425.
19. Klipp, E., Heinrich, R. & Holzhu
¨
tter, H.G. (2002) Prediction of
temporal gen e expression: metabolic optimisation by re-distribu-
tion of enzyme activities. Eur. J. Biochem. 269, 5 406–5413.
20. Edwards, J.S., Ibarra, R.U. & Palsson, B.O. (2001) In silico pre-
dictions of Escherichia coli metaboli c c apabilities a re cons istent
with experimental data. Nat. Biotechnol. 19, 125–130.
21. Stein, W.D. (1986) Transport and Diffusion Across Cell Mem-
branes. Academic Press, London.
22. Lowe, A.G. & Walmsley, A.R. (1986) A quenched-flow technique
for the measurement of glucose influx into human red blood cells.
Anal. Biochem. 144, 385–389.
23. Baldwin, S.A. (1993) Mammalian p assive glucose transporters:
members of an ubiquitous family of active and passive transport
proteins. Biochim. Biophys. Acta 1154, 17–49.
24. Van Dien, J.S. & Lidstrom, M.E. (2002) Stoichiometric model for
evaluating the metabolic capabilities of the facultat ive methylo-
troph Methylobacterium extorquens AM1 , with applic ation to
reconstruction of C3 and C 4 metabolism. Biotechnol. Bioeng. 78,
296–312.
25. Schuster,S.,Dandekar,T.&Fell,D.A.(1999)Detectionofele-
mentary flux modes in biochemical networks: a promising tool for
pathway analysis and metabolic e ngineering. Trends Biotechnol.
17, 53–60.
26. Schilling, C.H., L etscher, D. & P alsson, B.O. (2000) Theory for the
systemic definition of metabolic pathways and their use in inter-
preting m etabolic function from a pathway-oriented p erspective.
J. Theor. Biol. 203, 229–248.
28. Wiback, S.J. & Palsson, B.O. (2002) Extreme pathway analysis of
human red blood cell metabolism. Biophys. J. 83, 808–818.
27. Dandek ar, T., Moldenhauer, F., Bulik, S., Bertram, H. &
Schuster, S. (2003) A method for classifying metabolites in topo-
logical pathway analyses based on minimization of pathway
number. Biosystems 70, 255–270.
29. Stelling, J., Klamt, S., Bettenbrock, K., Schuster, S. & Gilles, E.D.
(2002) Metabolic network structure determines key aspects of
functionality and regulation. Nature 420, 190–193.
30. Varma, A. & Palsson, B.O. (1994) Metabolic flux balancing –
basic co ncepts, scientific and practical use. Bio-Technology 12 ,
994–998.
31. Zaslaver, A., Mayo, A.E., Rosenberg, R., Bashkin, P., Sberro, H.,
Tsalyuk, M., Surette, M.G. & Alon, U. (2004) Just-in-time trans-
cription program in metabolic pathways. Nat. Genet. 36, 486–491.
32. Schobersbe rger, W., Tschann, M., Hasibeder, W., S teidl, M.,
Herold, M., Nachbauer, W. & Koller, A. (1990) Consequences of
6 weeks of st rength training on red c ell O
2
transport and iron
status. Eur. J. Appl. P hysiol. Occup. Physiol. 60, 163–168.
33. Van Dien, J.S., Strovas, T. & Lidstrom, M.E. (2003) Quantifica-
tion of central metabo lic fluxes i n the facultative m ethylotroph
Methylobacterium extorquens AM1 using
13
C-label tracing and
mass spectrometry. Biotechnol. Bioeng. 84, 45–55.
34. Goldberg,R.,Tewari,Y.&Tung,M.NIST Standard Reference
Database 74: Thermodynamics of Enzyme-Catalyzed Reactions.
Biotechnology Division, National I nstitute of Standards and
Technology, Gaithe rsburg [ />dynamics/].
Supplementary Material
The following material is available from http://www.
blackwellpublishing.com/products/journals/suppmat/EJB/
EJB4213/EJB4213sm.htm
Appendix 1. Full documentation of the model equations.
2922 H G. Holzhu
¨
tter (Eur. J. Biochem. 271) Ó FEBS 2004
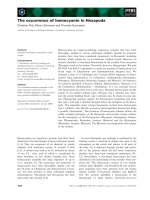
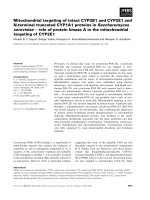

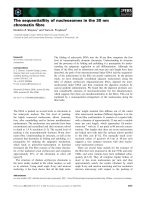
![Tài liệu Báo cáo khoa học: The stereochemistry of benzo[a]pyrene-2¢-deoxyguanosine adducts affects DNA methylation by SssI and HhaI DNA methyltransferases pptx](https://media.store123doc.com/images/document/14/br/gc/medium_Y97X8XlBli.jpg)