APPLICATION OF THE STIRLING MODEL TO ASSESS DIVERSITY USING UIS CINEMA DATA docx
Bạn đang xem bản rút gọn của tài liệu. Xem và tải ngay bản đầy đủ của tài liệu tại đây (461.46 KB, 73 trang )
APPLICATION OF THE STIRLING MODEL TO
ASSESS DIVERSITY USING UIS CINEMA DATA
By Françoise Benhamou* and Stéphanie Peltier**
(*Professor, Centre d’Economie de l’Université Paris Nord; **Associate Professor,
GRANEM, University of Angers and University of La Rochelle)
Published in 2010 by:
UNESCO Institute for Statistics
P.O. Box 6128, Succursale Centre-Ville
Montreal, Quebec H3C 3J7
Canada
Tel: (1 514) 343-6880
Fax: (1 514) 343-5740
Email:
Ref: UIS/TD/10-04
©UNESCO-UIS 2010
The authors are responsible for the choice and the presentation of the facts contained in this article and for the opinions
expressed therein which are not necessarily those of UNESCO and do not commit the Organization.
The designations employed and the presentation of material throughout this publication do not imply the expression of any
opinion whatsoever on the part of UNESCO concerning the legal status of any country, territory, city or area or of its
authorities or concerning the delimitation of its frontiers or boundaries.
- iii -
Table of contents
Page
Introduction 7
Section 1. Cultural diversity 8
1.1 Is the concept of diversity poorly defined? 8
1.2 Defining diversity – What is at stake? 8
i) Defining a policy for a sustainable level of culture and creation 8
ii) Accounting for national and local culture 9
Section 2. The Stirling model 10
2.1 The initial inspiration 10
2.2 The three dimensions of diversity 10
i) Variety 10
ii) Balance 10
iii) Disparity 11
iv) The Stirling Index 11
Section 3. Enriching Stirling’s approach 13
3.1 Limits to the analogy of environmental economics 13
3.2 Improvement to the initial model 13
i) Dealing with demand 13
ii) From the Stirling Index to the H
bfp
Index 14
Section 4. Availability of the variables and the adaptation of the initial
framework to the first form of categorization: The titles 15
4.1 The availability of variables 15
i) Variety: The supply side 16
ii) Variety: The distribution side 16
iii) Variety: The consumption side 16
iv) Balance: The supply side 16
v) Balance: The distribution side 17
4.2 Enriching the initial empirical framework 17
i) Balance: The consumption side 17
ii) Disparity: The consumption 17
Section 5. Language and countries – A new methodology 19
5.1 Diversity and language 19
i) Variety and balance produced 19
ii) Variety, balance and disparity consumed 19
iii) Disparity in languages 19
5.2 Diversity and country of origin 21
i) Variety supplied 21
ii) Balance supplied, distributed and consumed 21
5.3 A final view of the methodology 22
Section 6. Some issues and their interpretation 24
6.1 Variety by titles produced, distributed and consumed 24
i) Diversity supplied vs. diversity consumed for the variety
of national films produced 25
- iv -
ii) Variety and balance distributed by title 28
iii) Balance and disparity by titles consumed 29
6.2 Variety and balance by language 31
i) The number of languages in which films are shot 31
ii) Variety, balance and disparity consumed by language –
A comparison of indexes 32
6.3 Variety and balance produced and consumed by country of origin 34
i) The case of co-productions 34
ii) Variety and balance consumed by country of origin 35
6.4 Towards a more general appreciation of cultural diversity 38
Section 7. Conclusion 41
7.1 Proposals for improvements to the database 41
7.2 Partial and synthetic indexes 42
i) The risk associated with presenting contradictory interpretations 42
ii) The variation in hierarchies 43
7.3 Observing the evolution of cultural diversity with time 43
7.4 The correlation between the level of indexes and cultural policies 43
7.5 The limits of comparisons – Can the same indexes be used in
different cultural contexts? 43
7.6 Correlation between variables of diversity and variables of
democratization of consumption 45
i) Accessing cultural services (cinema theatres) 45
ii) Access to other media (video, VOD, TV, catch-up TV, internet,
cellular phones) 45
References 46
Appendix 49
List of tables
Table 1. Criteria measuring cultural diversity in the film industry, based directly
on the UIS Feature Film survey 15
Table 2. Global top ten films 18
Table 3. The Dyen Matrix of Linguistic Distances 20
Table 4. A summary of the improvements to the methodology 22
Table 5. Availability of data 23
Table 6. Number of national films produced per year 25
Table 7. Number of cinemas per capita 26
Table 8. Number of admissions per cinema 26
Table 9. Percentage of cinemas with eight screens or more (multiplexes) 27
Table 10. Admissions per capita 27
Table 11. Number of distribution companies 28
Table 12. Total market share of the three main distribution companies (in % of
admissions) 29
Table 13. Market share of the top ten films (in % of admissions) 30
Table 14. Rate of similarity between top ten films and the global top ten (%) 30
Table 15. Number of different languages in which films are shot 31
Table 16. Number of foreign languages in which films are shot 31
Table 17. Ranks obtained on average (2005-2006) with the HHI Index 32
- v -
Table 18. Ranks obtained on average (2005-2006) with the H
st
Index 33
Table 19. Ranks obtained on average (2005-2006) with the H
bfp
Index 33
Table 20. Number of films co-produced (variety produced by country of origin) 34
Table 21. Percentage of 100% national feature films produced (balance
produced by country of origin) 35
Table 22. Market share of national films 36
Table 23. Market share of US films 36
Table 24. Market share of other films 37
Table 25. Market share of national, US and other films, based on the average
between 2005 and 2006 (ranked with the HHI Index) 37
Table 26. Ranking of 27 countries based on the analysis of three criteria of cultural
diversity (2005-2006) 38
Table 27. A typology based on two criteria – Admissions and balance in consumption 38
List of figures
Figure 1. Cultural diversity in the movie industry among 27 countries 38
Figure 2. Diversity in production languages for Nigerian films, 2005
(number of films produced: 872) 44
Figure 3. Diversity in production languages for Indian films, 2005
(number of films produced: 1041) 44
- 7 -
Introduction
Cinema is among one of the best-documented cultural industries. The significantly lower
number of new films released each year compared to the number of new books or songs
released makes it possible to collect data on the level of film production in many countries.
Many countries support their cinema industry and, as such, provide diverse statistics on
this activity. Also, the UNESCO Institute for Statistics (UIS) database is rich and allows for
a series of data processing. This report tests and discusses the methodology presented by
Andrew Stirling in a series of papers (Stirling, 2007 among others) and makes suggestions
to improve on Stirling’s methodology as it applies to measuring cultural diversity using
cinema statistics collected by the UIS.
The cinema data used to test the Stirling model were collected for the years 2005 and
2006 using the UIS film questionnaire. The data collection covered 208 countries – but
data may be lacking for certain countries or certain years. Among the criteria selected in
this report, only one criterion had responses from as many as 75 countries while the
response rate was even lower for the other criteria. The response rate was highest for
countries in Europe and North America than for those in Africa, Latin America and the
Pacific (see Appendix, Tables A1-A3) (UNESCO, 2008). The complete list of countries that
responded to the film questionnaire is provided in this report (see Section 5.3).
A strong analysis requires a proper definition of diversity and a reliable methodology in
order to correctly interpret the series of data provided in the database. Section 1 reviews
the definition, features and stakes of cultural diversity. Section 2 presents the initial Stirling
Model. Section 3 discusses the relevance of the model as it applies to the understanding
and assessment of cultural diversity, and then introduces new elements to improve the
ability of the model to correctly estimate the different dimensions of cultural diversity.
Section 4 presents the UIS cinema data and the empirical aspects of the methodology.
Section 5 emphasizes the empirical issues on cultural diversity in the film industry by
utilizing the panel data model. Section 6 discusses the results and introduces suggestions
for further investigations on using the Stirling model to assess cultural diversity. Finally,
concluding remarks are provided in Section 7.
- 8 -
Section 1. Cultural Diversity
1.1 Is the concept of diversity poorly defined?
Diversity is at the core of cultural policies even though the concept remains rather unclear.
According to many academics, diversity is poorly defined, “analytically neglected” and in
need of “systematic or robust understandings” (Stirling, 2007). Thus far, official texts and
academic analysis have put forth some very broad meanings, including “the ethnically-
marked cultural differences associated with the international movement of peoples and,
within national territories, the claims to difference associated with the protracted struggles
of in situ minorities to maintain their identity and specificity in the face of the homogenizing
force of national cultures” (Benett, 2001).
As the quotation illustrates, diversity is a polysemic notion that combines many aspects.
Among other things, the concept includes languages, high and popular culture, and ways
of life. It is also viewed as a means of economic development and as an element to
consolidate democracy (Atkinson and Bernier, 2000). The Convention on the Protection
and Promotion of the Diversity of Cultural Expressions refers to diversity as “the manifold
ways in which the cultures of groups and societies find expression”. It was adopted by the
33rd General Conference of UNESCO in October 2005 and took effect on 18 March 2007.
So, how can we understand diversity in the context of cinema activities? Diversity in this
case relies on many different factors – for example, the ability of producers to work with
film-makers and actors from different origins, the number of films released or on the level
of standardization of goods and more. Cultural diversity can be captured through two
complementary dimensions. The first deals with the “human” criteria (i.e. criteria that apply
to individuals), such as the genre or the origin of film-makers. The second dimension
refers to more “material” criteria (i.e. criteria that apply to products, such as the nationality
of a film). Of course, “human” and “material” criteria may be linked. The nationality of a
movie depends on the original country where the film is produced but it may also have an
influence on the nationality of the film-maker. More generally speaking, while some
aspects are easily quantifiable, others are definitely qualitative.
1.2 Defining diversity – What is at stake?
Why is it important to have a clear definition of diversity? An available definition and
measure of diversity can lead to an appropriate definition of the tools needed to improve
diversity. The following are two examples of the greater policy implications of having a
proper definition of cultural diversity.
i) Defining a policy for a sustainable level of culture and creation
This is a simple example to illustrate the policy implications of having a strong definition,
measure, and thus, strong determinants of diversity. It is hypothesized that the diversity of
cultural products implies diversity in the industrial structures and in the governance of
companies. This can be seen in the TV sector in particular (Steiner, 1952). Many studies
show that oligopolies with a competitive fringe dominate in cultural industries. This
structure is well-adapted to the uncertainty that characterizes the production of cultural
goods and services. The firms on the fringe develop a propensity to innovate thanks to
- 9 -
their proximity to creators while the firms in the core regularly try to attract the most
creative artists and/or to purchase the most promising small labels and firms.
If we adopt this point of view, we can assert that a country that wishes to support diversity
is interested in subsidizing the creation of small firms – directly or indirectly (e.g. through
tax cuts, etc.).
ii) Accounting for national and local culture
The policies in favour of diversity may be paradoxical. On the one hand, one way to
safeguard local cultures that are threatened by the effects of globalization is through
protectionism (e.g. quotas on TV programs and cinema screens to support local
production). Yet, two major disadvantages may emerge with this approach. First, there is a
risk of a decrease in quality resulting from a lower level of competition. Second,
protectionism represents a barrier to foreign products, which could work to decrease
cultural diversity as an end result.
For example, quotas on European TV have not only limited the importance of American TV
series but have probably raised a strong barrier to productions from Brazil, India, Africa
and other countries outside of Europe. In France, two kinds of measures have been
developed to support cinema:
- Automatic subsidies are allocated to producers who have already made a film.
Current subsidies for a new film depend on the number of admissions reached by
the same producer’s previous film. The higher the success of the previous film, the
higher the subsidies allocated to the new one. This mechanism leads to a growth in
the number of new films. Its incidences on cultural diversity are ambivalent. On the
one hand, it promotes diversity by increasing the number of films. On the other, there
is a correlation between success and subsidies that may end up not rewarding
innovation and risk. As a result, product standardization may increase and the level
of diversity may in fact decrease.
- Regulators in France seek to encourage innovation in cultural industries by providing
interest-free loans. The loans are to be repaid only once a film turns a profit (avance
sur recettes) and all films selected by commissions based on their quality are
eligible, regardless of rank (i.e. first film or not). Thus, subsidies encourage creativity,
support innovation and discourage a standardization of films.
In this case, a reliable assessment of cultural diversity is essential in order to evaluate the
efficiency of the measures that were adopted. Here, cultural diversity can be measured
using two complementary points of view: the number of films produced (especially films
from new film-makers), and the genre and quality of these films. Thus, it is possible to
adopt qualitative and/or quantitative criteria to measure the efficiency of a cultural policy in
promoting diversity. Nevertheless, the cultural policy issues that need to be addressed and
how they are interpreted may vary deeply, depending on the respective criteria chosen.
- 10 -
Section 2. The Stirling model
2.1 The initial inspiration
In the field of ecology, Weitzman (1992, 1993) voices the need for a theoretical framework
in order to study the challenges in the preservation of biodiversity and to build serious
grounds to justify policies to ensure the survival of endangered species. More generally
speaking, ecology pays close attention to the question of diversity – Odum (1953)
observes this tradition in early publications and bears testimony to this tendency.
Ecology is not the only domain where the concept of diversity plays a central role. Stirling
(2007) remarks that that the term “arises repeatedly in the physical (Shevchenko et al.,
2006), life (Maynard Smith, 1989) and information sciences (Kauffman, 1993), as well as
in social (Grabher and Stark, 1997), economic (Geroski, 1989) and policy (Gillett, 2003)
studies. In particular, diversity is a prominent theme in science and technology policy
(Nowotny et al., 2001).”
2.2 The three dimensions of diversity
Probably inspired by Rao (1982), Stirling defines diversity as a combination of three basic
properties – variety, balance and disparity. These dimensions are not necessarily linked
and do not evolve in the same way. Thus, it is impossible to interpret one of those
dimensions without taking the other two into account.
i) Variety
Variety is the easiest dimension to understand and evaluate. It is “the number of
categories into which system elements is apportioned” (Stirling, 2007). Stirling refers to
different fields in which variety plays a central role and observes that it is highlighted by
environmental economists through species-number indices. In the same way, the number
of firms or products is a signal of variety in management and economics.
All else being equal, the greater the variety, the greater the diversity. When this principle is
applied to the movie industry, Stirling’s model leads one to consider that cultural diversity
increases, for example, in direct proportion to the number of films. This criterion can be
considered as a measure of variety. Variety can also reflect the number of different origins
of films or the languages used in them.
ii) Balance
A common mistake that is still present in many studies and arguments is to associate
diversity with the sheer multiplicity of types (variety), overlooking the fact that their relative
frequencies are also crucial to defining balance (i.e. the amount of diversity).
Balance refers to the pattern in the distribution of the quantity of a specific element across
the relevant categories. As Stirling points out, “balance is a function of the pattern of
apportionment of elements across categories.” Balance is perfect when each category is
equally represented in the population.
- 11 -
Applied to the movie industry, Stirling’s model maintains that balance refers to the extent
to which different origins or languages are equally well represented. Balance is usually
captured by the Shannon-Wiener Index
1
(1948) or the Herfindhal-Hirschmann Index
(HHI)
2
. In this report, the HHI will be used for two reasons. First, the HHI is a more widely
used index and second, it affords the advantage of describing the balance quite correctly
without having to focus too heavily on variety, making the interpretation of the level and
evolution of the index easier
3
.
The HHI is traditionally used to measure industrial concentration in a market. This indicator
is defined as follows:
HHI = s
i
2
where s
i
is the market share of each statistical individual
The higher the value of the index, the weaker the balance. Of course, the HHI not only
depends on the balance but also on the number of individuals. When two firms have equal
market shares in a relevant market, the HHI is higher than when three firms have equal
shares in the same market. In this report, it is considered that all else being equal, the
better the balance, the greater the diversity.
iii) Disparity
Disparity goes beyond these measurement schemes by accounting for the nature of the
categorization. Disparity is defined as the degree of dissimilarity between any given pair of
objects or types. It “refers to the manner and degree in which the elements may be
distinguished” (Runnegar 1987 in Stirling 2007). All else being equal, the more disparate
the represented elements are, the greater the diversity.
Applied to the movie industry, Stirling’s model interprets disparity as the extent to which
films display marked specificities that clearly distinguish them from one another.
iv) The Stirling Index
Stirling (1999) proposed an index that takes into account the three dimensions of diversity
listed above (i.e. variety, balance, disparity). Stirling’s proposal introduces a new element
to the existing set of basic constituents, which considers objects to be uniquely and
intrinsically distinguishable with no differences in their (relative) proximities.
1
Supposing a suitably characterized context is given, basic elements for the construction of the index are a
well-defined set of objects, outcomes or types, say 1, 2, …, n, and an associated frequency (or probability)
distribution p
i
, 1 i n,
i
p
i
= 1. The Shannon Index is:
H
SW
= -
i
p
i
lnp
i
,
where, though in the theoretical developments, the logs are assumed to be neperian, in practical
applications they often chosen base 2.
2
For a survey of the different indexes available, see Patil and Taillie (1982) as well as Stirling 2007.
3
For more details on the comparison between the Shannon-Wiener Index and the HHI, see Benhamou and
Peltier (2008).
- 12 -
He assumes the existence of a distance function d
ij
that is well-defined for all pairs (i,j).
The implicit influence of Lancaster’s (1966) early ideas – pioneered by Gorman (1953,
1956 and 1961) – can be seen here to incorporate quality in consumer theory, where
products (i.e. types) are defined by transformations of an original attribute’s space
4
. In this
way, a Euclidean distance can be naturally computed between products.
In the light of these assumptions, Stirling’s proposal is:
H
St
=
i,j
d
ij
p
i
p
j
.
Distances between pairs of elements represent their mutual disparity (d
ij
). Variety and
balance can be captured by weighting distances by the product of the proportional
importance in the system of each element in the pair (p
i
p
j
).
4
As previously established, purely economic approaches to diversity can differ. Rosen (2004), for instance,
gives an example of another independent line albeit based on standard ideas on product differentiation and
imperfect competition.
- 13 -
Section 3. Enriching Stirling’s approach
3.1 Limits to the analogy of environmental economics
Diversity is crucial to the environment and sustaining ecological equilibrium. In ecology,
scientists maintain that an unbalanced ecosystem naturally leads to the disappearance of
the less-represented species. This hypothesis is relatively weak when applied to culture.
For instance, in the book industry, if poetry books are not published in as great a volume
as novels or documentary books, this does not signify that poetry books have no future.
Moreover, if all publishers decided to reach an almost perfect balance between all these
genres of books, the market would face an overproduction of poetry books. The same
outcome applies to the cinema industry as some films have a narrow viewership that
would not justify a larger scale of production and presence in theatres. Although more
copies of a film may give rise to a larger attendance rate, the limits of this growth would
probably become apparent rapidly.
In the field of culture, the dynamics of the circulation of information and prescriptions are
specific. Sir Alan Bowness (1989), a former Director of the Tate Gallery, studied the rise of
success of four schools of English painting. In each of the four cases, a clear succession
of different steps of recognition was seen, involving the professionals, the most serious
critics, the collectors and the public at large. In the same way, Boudon (1984) describes
the three markets linked to the intellectual life: professional certification of specialized
audiences, semi-specialized large public and media. For films, the whole production
process is not naturally adapted to a large public. It may be paradoxically less profitable
and a film could risk becoming obsolete if the number of titles or copies is too large in
proportion to their observed and potential public. In cinema, even though blockbusters
attract the widest segment of the audience, not all films can be considered potential
blockbusters. Although blockbusters leave fewer opportunities for other types of movies to
gain an audience, some movies are better adapted to narrow audiences. This is always a
necessary risk (i.e. smaller audiences) for innovative films that prepare more ambitious
products.
3.2 Improvement to the initial model
i) Dealing with demand
The Stirling model focuses on the production side only, which is probably due to the
heritage of ecological reasoning. However, in the field of culture, a high level of diversity
supplied cannot be considered an objective per se – it has to correlate to a high level of
diversity consumed. This means that production should be “correctly” distributed. Such an
objective requires an industrial organization that creates the appropriate means for
consumers to access the diversity of goods and services. This highlights the distinction
between diversity produced and diversity distributed.
In addition, Van der Wurff and Van Cuilenburg (2004) make a distinction between open
diversity and reflective diversity. Open diversity corresponds to the concept of supplied
diversity. Reflective diversity measures the degree of response of supply to demand. The
postulate underlying reflective diversity is that the diversity supplied should reflect the
diversity demanded. However, in the cultural industries, it is rational to supply a greater
level of diversity than the level that will ultimately be consumed. As Caves (2000) points
out, faced with uncertainty about the future success of any given product (i.e. the “nobody
- 14 -
knows” property of cultural products), it is rational to “overproduce” with the aim of
maximizing the chances of success. In the same way, Cowen (2002) refers to reflective
diversity using the term “operative or practical diversity”. Through this concept, he defines
the ability to benefit from the diversity supplied in spite of the possible obstacles that
prevent some individuals from accessing the “menu of choice”.
Adopting a similar framework for the Stirling model, the distinction between the diversity
produced, the diversity distributed and the diversity consumed can be introduced. One can
then analyse the extent to which the diversity produced is distributed and to what extent
economic agents create conditions for diversity to be consumed.
ii) From the Stirling Index to the H
bfp
Index
The Stirling Index considers distances between each pair of elements. It does not
introduce the distance between each element and one focal element that could play the
role of a referent
5
. This approach may be relevant in order to measure diversity in some
specific contexts when the different types or elements are considered equivalent.
In contrast, many economic problems require the introduction of a referent. For example,
the level of diversity resulting from the introduction of new technologies must take into
account not only the distances among the new technologies, but also distances between
those new technologies and the previous dominant technology. Therefore, we must
introduce a new index of the class of the generalized distance, taking into account the
distance between all the types or elements weighted by their importance and the distance
of each type to the referent. With this:
f
ij
( {d
lk
, l, k types} ) = d
ij
d
ik
d
jk
or all i, j, with k, fixed, as the referent,
.
and the corresponding index becomes
H
BFP
=
i,j
d
ij
d
ik
d
jk
p
i
p
j
with k, fixed, as the referent.
Distances – in the specific case of this study – correspond to the distances between
languages (see Section 5.1). When calculating the value of the index, the distance
between the language of the referent country and the language of the national production
is not taken into account
6
. In other words, for example, we consider the presence of
national films in the top ten as positive and desirable.
5
For more details, see Benhamou et al., 2009.
6
Otherwise, the distance would have been equal to zero and the level of diversity would be considered very
low.
- 15 -
Section 4. Availability of the variables and the adaptation of the
initial framework to the first form of categorization: The titles
For each criterion, we choose the corresponding variables when they are available, and
proxies or indexes otherwise.
4.1 The availability of variables
The responses to the UIS Feature Film Survey directly provide a set of variables which are
summarized in Table 1. Three categories can be used here: titles, languages and country
of origin.
Theoretically, the assessment of cultural diversity in the movie industry should rely on:
- produced, distributed and consumed diversity;
- three dimensions (variety, balance and disparity); and
- four forms of categorization (title, language, geographical origin and genre of films).
Given the lack of statistical data on the genres of films in the UIS Database, this last form
of categorization had to be discounted.
A 333 matrix of indicators of cultural diversity in the film industry can only be partially
completed (see Table 1 and Table 4). Variables can be defined for the three forms of
categorization: “title”, “language” and “country of origin”.
Table 1. Criteria measuring cultural diversity in the film industry, based directly on
the UIS Feature Film survey
Variety Balance Disparity Dimensions
Forms of
categorization
Produced Distributed Consumed Produced Distributed Consumed Produced Distributed Consumed
Title Number of
feature films
produced
nationally
Number of
cinemas/
1,000
inhabitants
Admissions per
cinema
% of multiplexes
Number of film
distribution
companies
Admissions
per capita
- Market
share of the
the top 3
distribution
companies
Language Number of
different
languages in
which films are
shot
-
- - -
Country of
origin
Number of
feature films
co-produced
- - % of
feature
films
100%
nationally
produced
% of
nationally
controlled
distribution
companies
Notes: - Data unavailable
Methodology unavailable
- 16 -
i) Variety: The supply side
To assess variety, the three forms of categorization “title”, “language” and “country of
origin” can be used. The variety produced by title is measured by the number of feature
films produced in a given country in one year. This variable indicates the size of the
national production of different films. In the “language” category, we observe the number of
different languages in which the films are shot and for the “country of origin,” the number of
films that are co-produced.
ii) Variety: The distribution side
It is essential to cross reference this “theoretical” supply with an indicator of the
accessibility (i.e. variety distributed) to the films produced. Is the variety of films available
for the widest possible number of consumers or reserved for only a small elite?
Thus, the measurement of the variety supplied is completed using the average number of
cinemas available for 1,000 inhabitants. The higher this number is, the greater the
chances, a priori, that each film will be widely available in space (i.e. geographical
coverage) and time (i.e. number of days the films are shown).
It would have been preferable to analyse the number of screens as well but this data is not
available. So, in order to approximate the total number of screens available, the
percentage of multiplexes provided in the UIS database is used.
The number of admissions per cinema is also taken into account to estimate the size of
cinemas. No information is available on the average number of copies per film. Thus, only
the number of distribution companies as a proxy for this data can be used.
iii) Variety: The consumption side
A high level of demand is a necessary condition for an effective level of diversity. A large
demand maximizes the chances that each variety supplied will be consumed. Thus, variety
consumed will be evaluated based on the average number of admissions per capita.
iv) Balance: The supply side
For the “title” category, the notion of balance produced is irrelevant. In the “country of
origin” category, the percentage of feature films that are 100% nationally produced is proof
of the existence and the strength of a domestic cinema industry. This does not mean that
co-productions can not co-exist with nationally produced films in a dynamic domestic
industry. Therefore, this variable must be interpreted with caution.
- 17 -
v) Balance: The distribution side
An equivalent indicator for distributed diversity should take into account the number of
copies per film, which will help in the measurement of the degree of inequality in the
competition between different films. Unfortunately, this data is not currently available for all
countries
7
. Only the information on the market share of the three main distribution
companies in countries is available. A priori, the more concentrated the distribution, the
more difficult it is for movies produced by unknown directors to be exhibited in numerous
cinemas.
In the “country of origin” category, the percentage of nationally controlled distribution
companies is studied. This informs of the ability of countries to build companies that can
promote their own domestic production.
4.2 Enriching the initial empirical framework
At this stage, the variables alone do not help us fully understand balance and disparity. To
gain a better understanding of these elements, a new step needs to be introduced to the
general methodology.
i) Balance: The consumption side
At the “title” level, we study the distribution of admissions over the total number of released
movies. This indicator of consumed diversity signals whether all consumers tend to
“consume” the same films or, on the contrary, whether different films have similar
audiences. It indicates the concentration of demand for a narrow segment of the market
and is a strong indicator of the propensity of demand to be driven by a “star system” logic.
Thus, the market share of the top ten films in the total number of admissions or CR
10
8
can
be calculated.
ii) Disparity: The consumption
Disparity – the last dimension used to define diversity – can be determined using two
forms of categorization; “title” and “languages”.
To evaluate disparity for “titles” using the given data, one can only use the rate of similarity
between the domestic top ten and the global top ten – the higher the rate, the lower the
disparity.
The following is an example of how to calculate the rate of similarity. First, evaluate the
general top ten for the 31 countries for 2005 and 2006 data. Next, each film is sorted on a
scale of 1 to 10 depending on its rank. The highest position corresponds to the film with
the largest audience. Table 2 summarizes the results.
7
The Centre National du Cinéma (CNC) supplies these data for France but they are unavailable for other
countries.
8
It is impossible to calculate the HHI in this case because the complete set of data on the distribution of
admissions by film is unavailable.
- 18 -
Table 2. Global top ten films
Global top ten for 2005 Origin Language
Harry Potter and the Goblet of Fire GBR inc/USA English/French
Madagascar USA English
Star Wars Episode 3: Revenge of the Sith USA English
War of the Worlds USA English
Mr. and Mrs. Smith USA English
Meet the Fockers USA English
Kingdom of Heaven GBR English
Charlie and the Chocolate Factory USA English
Hitch USA English
Alexander USA English
Global top ten for 2006
Pirates of the Caribbean: Dead Man's Chest USA English
Ice Age 2: The Meltdown USA English
Da Vinci Code USA English/French
Casino Royale GBR inc/USA English
Cars USA English
The Chronicles of Narnia: The Lion, the Witch
and the Wardrobe
NZL English
Over the Hedge USA English
Mission Impossible III USA English
Borat USA English
Garfield: A Tail of Two Kitties USA English
Note: The original language for the films Harry Potter and Da Vinci Code are English and French,
however, the majority of the films were shot in English.
Source: UIS 2007 Feature Film Statistics Survey, 2009
- 19 -
Section 5. Language and countries – A new methodology
5.1 Diversity and language
To determine diversity in terms of language, indicators can be defined that simultaneously
take into account two or three of the following dimensions: variety, balance and disparity
(produced and consumed).
i) Variety and balance produced
The variety of “languages” and of “countries of origin” can only be analysed at the supply
level by the number of different languages in which films are shot and the number of
feature films that are co-produced, respectively (see Section 4).
For the original language of films (both produced and consumed), variety and balance
could be assessed using the HHI (as described in Section 2.2).
On the supply side, the HHI is calculated using the distribution of national films produced
according to the language in which they are shot. This method is not completely adequate
as a film can be shot in several languages. Therefore, to evaluate the variety of languages,
the HHI is an imperfect tool. To overcome this problem, an analysis was conducted on the
number of different languages in which films are shot. The number of foreign languages
among the total number of languages was also studied. These data reveal the degree of
openness of a country to other cultures and languages. Of course, some countries may be
multilingual. In which case, the number of languages is not a fully satisfactory index and
has to be completed using other data. In any case, one can hypothesize that the more
numerous the languages, the higher the level of diversity.
ii) Variety, balance and disparity consumed
On the consumption side, the HHI and the synthetic indexes (H
st
and H
bfp
) can only be
calculated for the distribution of top ten films using admissions by language.
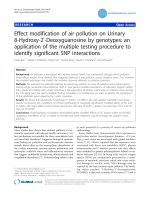
iii) Disparity in languages
To study the evolution of disparity between languages in which films are shot, a method
displayed by Ginsburgh et al. (2005, 2008) can be used. Ginsburgh uses the matrix of
linguistic distances among Indo-European languages proposed by Dyen et al. (1992)
9
to
analyse the choices to learn foreign languages (see Table 3).
9
Dyen et al. estimate the linguistic distances for 95 Indo-European speech varieties (i.e. languages and
dialects), by comparing 200 basic meanings in those different languages. For this report, only the linguistic
distances for the 20 Indo-European languages included in the top ten films are taken into account (with the
exception of Norwegian which is not available in the matrix). Since Estonian, Finnish, Hungarian,
Japanese, Arabic and Turkish are not Indo-European languages, they are not estimated. Given the
difficulty learning these languages for Indo-European populations, the linguistic distance between these
languages and others is considered to be at a maximum (i.e. equal to 1). By contrast, the distances
between the non Indo-European languages are not estimated – for example, the distance between Bahasa
Malaysia and Mandarin or between Korean and Japanese.
- 20 -
Based on lexicographic methods, linguistic distance evaluations are an objective way to
analyse some aspects of disparity. The distance between two languages i and j is equal to
the percentage of words in the two languages that do not descend from a common word.
This distance, normalized, falls between 0 and 1. If the distance is close to 1, the two
languages have completely different roots (e.g. English and Japanese), and if the distance
is close to 0, the language have more similarities (e.g. Slovak and Czech).
To calculate the H
st
and the H
bfp
indexes, and to account for the films that were shot in
more than one language, it is hypothesized here that the number of attendants is equally
allocated to each language. For example, if a film was simultaneously shot in French,
Italian and English and if the film reaches 300,000 tickets sold, it is assumed that 100,000
cinema tickets were sold for each language respectively
10
.
At the production level, the indexes are irrelevant for two reasons. First, the list of
languages in which films were shot is incomplete for seven countries (Canada, Finland,
Nigeria, Portugal, Slovenia, Switzerland and the Ukraine). Second, the distance between
non Indo-European languages is unknown (e.g. between Yoruba and Hausa in Nigeria),
which would be required to analyse the disparity between the languages in multi-language
countries.
Table 3. The Dyen Matrix of Linguistic Distances
Ck D Dk E F G Gr I Ice Po Pol Ru S Slo Sw
Ck
0 0.762 0.746 0.759 0.773 0.741 0.836 0.753 0.766 0.764 0.234 0.255 0.760 0.126 0.767
D
0.762 0 0.337 0.392 0.756 0.162 0.812 0.74 0.408 0.747 0.769 0.776 0.742 0.769 0.308
Dk
0.746 0.337 0 0.407 0.759 0.293 0.817 0.737 0.221 0.750 0.749 0.740 0.750 0.732 0.126
E
0.759 0.392 0.407 0 0.764 0.422 0.838 0.753 0.454 0.760 0.761 0.758 0.760 0.750 0.411
F
0.773 0.756 0.759 0.764 0 0.756 0.843 0.197 0.772 0.291 0.781 0.778 0.291 0.765 0.756
G
0.741 0.162 0.293 0.422 0.756 0 0.812 0.735 0.409 0.753 0.754 0.755 0.747 0.742 0.305
Gr
0.836 0.812 0.817 0.838 0.843 0.812 0 0.822 0.802 0.833 0.837 0.832 0.833 0.832 0.816
I
0.753 0.740 0.737 0.753 0.197 0.735 0.822 0 0.755 0.227 0.764 0.761 0.212 0.749 0.741
Ice
0.766 0.408 0.221 0.454 0.772 0.409 0.802 0.755 0 0.763 0.758 0.754 0.763 0.757 0.211
Po
0.764 0.747 0.750 0.760 0.291 0.753 0.833 0.227 0.763 0 0.776 0.773 0.126 0.760 0.742
Pol
0.234 0.769 0.749 0.761 0.781 0.754 0.837 0.764 0.758 0.776 0 0.266 0.772 0.222 0.763
Ru
0.255 0.776 0.740 0.758 0.778 0.755 0.832 0.761 0.754 0.773 0.266 0 0.769 0.259 0.754
S
0.760 0.742 0.750 0.760 0.291 0.747 0.833 0.212 0.763 0.126 0.772 0.769 0 0.756 0.747
Slo
0.126 0.769 0.732 0.750 0.765 0.742 0.832 0.749 0.757 0.760 0.222 0.259 0.756 0 0.758
Sw
0.767 0.308 0.126 0.411 0.756 0.305 0.816 0.741 0.211 0.742 0.763 0.754 0.747 0.758 0
Notes: For non Indo-European languages, Estonian, Finnish, Hungarian, Japanese, Arabic and Turkish, the
linguistic distance to Indo-European languages is set at 1. Due to their linguistic remoteness, these
languages are considered as far from resembling each other.
10
For the films Harry Potter and Da Vinci Code, the original languages are English and French. However, as
they were shot mainly in English, only this latter language is considered in our study.
- 21 -
The following distances are used in this table: Bulg-E = 0,772, Bulg-F = 0,791, Rom-E = 0,773, Rom-
F=0,421, Lith-E = 0,784, Lith-F = 0,779, Uk-E= 0,777, Uk-F= 0,781, Let-E = 0,803, Let-F = 0,793 and
Let-Ru = 0,641. Also, these codes used to denote the following countries: Ck = Czech, Bulg =
Bulgarian, D = Dutch, Dk = Danish, E = English, F = French, G = German, Gr = Greek, It = Italian,
Ice = Icelandic, Let = Latvian, Lith = Lithuanian, Po = Portuguese, Pol = Polish; Rom = Romanian,
Ru = Russian, S= Spanish, Slo = Slovene, Sw = Swedish, UK = Ukrainian.
In the H
bfp
index for any given year, the average linguistic distance of titles produced is
calculated as the average of the distance between a referent language (e.g. French) and
each of the other languages – this distance being weighted by the market share of each
language in the set of titles produced.
At the consumption level, the same methodology can be applied to the original languages
of the top ten films.
5.2 Diversity and country of origin
i) Variety supplied
The number of feature films that are co-produced is an indicator of the level of variety by
country of origin. Co-productions can be viewed as a means of favouring cooperation
between different cultures. This form of cooperation can help countries with a less
developed film industry, produce and finance innovative films. At the same time, this
contributes to the circulation of films among different countries.
Co-productions provide a means for collecting the funds necessary to make a film. They
help countries with few resources produce a national movie and movies from emergent
countries to gain access to different markets. However, the interpretation of this criterion is
ambiguous. On the one hand, co-productions increase cooperation among European
countries and help Africa enhance local production. They can promote the transfer of
knowledge and help some countries build a domestic film industry. On the other hand, they
may also lead to a decline in diversity by watering down national or local differences as
film-makers may feel inclined to present the smallest common cultural denominator among
the different countries involved in the co-production in order to limit the level of commercial
and industrial risk.
Thus, although this indicator is studied, caution is advised when interpreting its level and
evolution.
ii) Balance supplied, distributed and consumed
Balance by country of origin can be estimated for production, distribution and
consumption. A first approach – and probably a very restrictive one – consists of the study
of the respective percentage of feature films that are 100% nationally produced and
feature films that are co-produced. However, as the criterion used to distinguish national
and foreign films is always financial, it does not truly assess diversity. A second approach
consists of analysing the percentage of national versus foreign controlled distribution
companies. This indicator is not very strong either as it may be a better determinant of
cultural diversity than an indicator of the level of diversity.
- 22 -
As was the case for languages, the HHI is calculated based on the market share of the five
main countries of origin. In this instance, as the number of individuals is always equal to
five, the HHI is simply an indicator of balance.
The presence of a category called “others” in the database prevents the evaluation of this
indicator for all the origins. In order to work on the largest number of countries possible,
the allocation is studied using a three-element typology (national, US, and others). In
addition, the rank of national films in the top five is introduced by country in the analysis.
5.3 A final view of the methodology
Table 4 provides a summary of the criteria and indexes used to evaluate the dimensions
that Stirling points out in his study of diversity.
Table 4. A summary of the improvements to the methodology
Variety Balance Disparity Dimensions
Forms of
categorization
Produced Distributed Consumed Produced Distributed Consumed Produced Distributed Consumed
Title Number of
feature
films
nationally
produced
Number of
cinemas/
1,000
inhabitants
Admissions
per cinema
% of
multiplexes
Number of
film
distribution
companies
Admissions
per capita
- Market
share of the
top three
distribution
companies
Market
share of top
ten films in
total
admissions
Rate of
similarity
between
national top
ten films
and the
global top
ten
Language Number of
different
languages
in which
films are
shot
Number of
foreign
languages
- Number of
different
languages
of the top
ten
Number of
foreign
languages
of the top
ten
(a) (b)
HHI
calculated
on the
distribution
of films
produced
by
language
- HHI
calculated
on the
distribution
of top ten
films
admissions
by language
(a) (b)
- - H
st
and H
fbp
based on
the
distribution
of top ten
films
admissions
by language
(b) (c)
Country of origin Number of
feature
films co-
produced
- - % of
feature
films
100%
nationally
produced
% of
nationally
controlled
distribution
companies
% of foreign
controlled
distribution
companies
HHI
calculated
on market
share of the
five main
countries of
origin
Rank of
national
films in the
top five by
country
Notes: - data unavailable
methodology unavailable
(a) HHI calculated on the distribution of top ten film admissions by language also taking into
account the variety consumed by language.
(b) H
st
and H
bfp
based on the distribution of top ten film admissions by language also estimate the
two others dimensions (i.e. variety and balance) consumed by language.
(c) Methodology available for Indo-European languages only.
- 23 -
Table 5 indicates the number and the list of countries used in our analysis according to the
number of criteria for which the database provides answers – it cross-references the list of
countries with the list of indicators that we consider relevant (see also Appendix Table 1).
It is rather paradoxical to observe that the countries that provided the most complete list of
answers to the questionnaire are not the same ones that have developed the most
sophisticated statistical apparatus. For instance, the United Kingdom and Canada did not
provide as many answers as expected. Moreover, some countries that are especially
interested in nurturing cultural diversity did not provide a significant set of answers
(especially Canada).
Table 5. Availability of data
Number of
criteria
Criteria Number
of
countries
Countries
21
N° films produced, admissions per capita,
admissions per cinema, N° cinemas per
capita, % of multiplexes, N° film distribution
companies, MS of the 3 distribution
companies, MS of the top ten films in total
admissions, rate of similarity, N° different
languages in which films are shot, N°
foreign languages, N° different languages of
the top ten, N° foreign languages in the top
ten, HHI distribution of films produced by
language, HHI distribution of top ten film
admissions by languages, H
st
on
distribution of top ten film admissions by
languages, H
fbp
distribution of top ten film
admissions by languages, N° films co-
produced, % of 100% national feature films
produced, HHI on the five mains countries
of origin, MS of national, US and other
countries
8 Switzerland, Romania, Mexico, Lithuania, Lebanon,
Hungary, Chile, Australia
6 N° national films, admissions per capita, MS
of the top ten films, rate of similarity, H
bfp
,
HHI on five main origins
14 Switzerland, Romania, Mexico, Lithuania, Lebanon,
Hungary, Chile, Australia,
Austria , Estonia, Finland, France, Poland, Slovakia
4 N° national films, admissions per capita, H
bfp
,
HHI on five main origins
18 Switzerland, Romania, Mexico, Lithuania, Lebanon,
Hungary, Chile, Australia
Austria , Estonia, Finland, France, Poland, Slovakia
Iceland, Netherlands, Germany, Latvia
3 N° national films, admissions per capita, HHI
on five main origins
27 Switzerland, Romania, Mexico, Lithuania, Lebanon,
Hungary, Chile, Australia
Austria , Estonia, Finland, France, Poland, Slovakia
Iceland, Netherlands, Norway, Germany, Latvia
USA, Spain, Republic of Moldova, Morocco,
Malaysia, Croatia, Ukraine, Macao, China
Special
Administrative Region
Notes: MS = Market share
N° = Number of
Source: UIS 2007 Feature Film Statistics Survey, 2009
- 24 -
Section 6. Some issues and their interpretation
This section presents the results of the analysis of diversity in the cinema industry using
the framework outlined earlier. Table A3 in the Appendix provides basic statistics for the
21 criteria. The results show a deep heterogeneity among countries. Note that the number
of observations (i.e. countries) varies from 24 to 75 depending on the criterion selected
11
.
All the variables and criteria have been calculated as an average over the 2005-2006
period. If the value for one of the two years is ignored, an average value equalling the
value obtained for the other year (2005 or 2006) is used.
6.1 Variety by titles produced, distributed and consumed
The variety produced at the film level is estimated based on the number of feature films
produced nationally each year (Appendix, Table A4). Of note, film production is limited to a
narrow number of countries. If a minimum of 50 films produced each year is considered to
signify the existence of a national industry, it can be said that 16 out of the 66 countries
analysed possess a proper cinema industry. Even among these 16 countries, the level of
production is highly heterogeneous.
Overall, four groups of countries can be distinguished (see Table 6):
a) As expected, in India, Nigeria and the in the United States, the number of new
films released each year is very high (1,041, 872 and 699
12
, respectively in
2005). However, in contrast with Hollywood and “Bollywood”, the Nigerian film
industry, commonly called “Nollywood”, produces small budgets films, generally
shot in digital video format in two or three weeks (for more details, see UNESCO,
2008).
b) In Japan, China and France, the average number of new films produced is lower
but greater than 200 (417, 260
13
and 203, respectively in 2006)
c) In Germany, Spain, Italy, the Republic of Korea and the United Kingdom, the
number of national films produced is greater than 100 (174, 150, 116, 110 and
107, respectively in 2006)
d) Lastly, in five others countries (Canada, the Russian Federation, the Philippines,
Mexico and Indonesia), more than 50 (but less than 100) new films are produced
each year (74, 67, 65, 64 and 60, respectively in 2006).
In contrast, 41% of the countries with data produce less than ten films and almost 23%
produce less than five films per year (i.e. Azerbaijan, Belarus, Burkina Faso, Croatia,
Cyprus, Kyrgyzstan, Latvia, Lithuania, China Macao Special Administrative Region,
Mongolia, Mozambique, Namibia, Oman, and the Republic of Moldova).
11
Only reliable responses were taken into account. When the comment associated to a criterion is specified
as “magnitude nil or negligible”, it denotes that the country was eliminated for this criterion.
12
In 2006, the number of films produced in the United States decreased to 480.
13
For China, the number of films produced is only available for 2005.
- 25 -
This ranking is certainly influenced by the size of a country (i.e. population size) and its
level of development (i.e. GNP/inhabitant). Demography and economic growth are two
factors that influence the vitality of cinema production. Nevertheless, there exists a historic
and economic tradition – as in Nigeria – where a relatively low level of development goes
hand in hand with a high level of production.
Table 6. Number of national films produced per year
a
Number of films Countries
600
India, Nigeria, USA
200-600 China, Japan, France
50-200 UK, Spain, Germany, Italy, Canada, Mexico,
Philippines, Indonesia, Republic of Korea, Russian
Federation
< 10 Armenia, Azerbaijan, Belarus, Bulgaria, Burkina Faso,
Cameroon, Croatia, Cuba, Cyprus, Dominican
Republic, Estonia, Iceland, Kyrgyzstan, Latvia,
Lebanon, Lithuania, China Macao Special
Administrative Region, Mongolia, Mozambique,
Namibia, New Zealand, Oman, Republic of Moldova,
Singapore, Slovakia, Slovenia, Ukraine
Note:
(a)
The ranking is based on the mean for the years 2005 and 2006
Source: UIS 2007 Feature Film Statistics Survey, 2009
i) Diversity supplied vs. diversity consumed for the variety of national films produced
The variety distributed can be approximated by the number of cinemas per capita – more
precisely, cinemas per 1,000 inhabitants (see Appendix, Table A5). Only 12
14
countries out
of 75 (16% of the countries) have a relatively high density of cinema theatres (i.e. more
than 50 cinemas per 1,000 inhabitants, see Table 7). In 2006, Sweden ranked first as the
country with the most number of cinemas per capita (129 cinemas per 1,000 inhabitants),
surpassing the United States (127 cinemas). Conversely, for 40% of the countries in the
sample, the accessibility to films seems very low with less than ten cinemas per 1,000
inhabitants. For countries like Cameroon, the Lao PDR, Niger and Mozambique, the
numbers of cinemas is less than one per 1,000 inhabitants (0.72, 0.87, 0.36, and 0.57
cinemas, respectively in 2006).
Two other variables may be used to analyse the variety distributed:
- the number of admissions per cinema;
- the percentage of multiplexes (i.e. cinemas with eight screens or more) (see
Appendix, Tables A5 and A6).
14
The United States, Sweden, France, Austria, Andorra, the Czech Republic, Denmark, Iceland,
Luxembourg, Norway, Switzerland and Ukraine.