Báo cáo khoa học: Radical-induced oxidation of metformin pptx
Bạn đang xem bản rút gọn của tài liệu. Xem và tải ngay bản đầy đủ của tài liệu tại đây (264.63 KB, 8 trang )
Radical-induced oxidation of metformin
H. Khouri
1
, F. Collin
1
, D. Bonnefont-Rousselot
2,3
, A. Legrand
2
, D. Jore
1
and M. Garde
`
s-Albert
1
1
Laboratoire de Chimie Physique UMR 8601-CNRS, Universite
´
Paris 5, France;
2
Laboratoire de Biochimie Me
´
tabolique et Clinique,
Faculte
´
de Pharmacie, Paris 5, France;
3
Laboratoire de Biochimie B, Ho
ˆ
pital de la Salpe
ˆ
trie
`
re (AP-HP), Paris, France
Metformin (1,1-dimethylbiguanide) is an antihyperglycae-
mic d rug u sed t o norm alize g lucose concentrations in type 2
diabetes. Furthermore, antioxidant benefits have been
reported in diabetic p atients treated with metformin. This
work was aimed at studying the scavenging capacity of this
drug against reactive oxygen species (ROS) like
Æ
OH and
O
ÆÀ
2
-free radicals. ROS were produced by gamma radio-
lysis of water. The irradiated solutions of metformin were
analyzed by UV/visible absorption spectrophotometry. It
has been shown that hydroxyl free radicals react with met-
formin in a concentration-dependent way. The maximum
scavenging activity was obtained for concentrations of
metformin ‡ 200 lmolÆL
)1
, under our experimental condi-
tions. An estimated value of 10
7
LÆmol
)1
Æs
)1
has been
determined for the second order r ate co nstant
k(
Æ
OH + metformin). Superoxide free radicals and hydro-
gen peroxide do not initiate any oxidation on metformin in
our in vitro experiments.
Keywords: metformin; hydroxyl radical; antioxidant; radio-
lysis.
Metformin (MTF) (1 ,1-dimethylbiguanide, see structure in
Fig. 1) is one of the most used oral antihyperglycaemic
agents. It normalizes plasma glucose concentration without
any stimulation of insulin production. It has been demon-
strated that elevated glucose levels induce oxidative stress
in diabetes, i.e. an imbalance between the production of
oxidant species, particularly radical species, and the anti-
oxidant defences [1]. This might partly explain the elevated
risk factors for diabetic patients to develop cardiovascular
complications [2,3]. This imbalance c an be detected by
oxidative stress markers such as those of lipid peroxidation
and protein oxidation.
Previous in vivo and in vitro studies have demonstrated
several antioxidant proper ties of m etfo rmin such as the
inhibition of the formation of advanced glycation end
products (AGEs) [4,5] that a re thought to be responsible
for further diabetic complications, and the decrease in
the formation of methylglyoxal, one of the precursors of
AGEs [6].
Metformin improves liver antioxidant potential in rats
fed a high-fructose d iet [ 7]. It has been observed that the
administration of metformin in diabetic p atients ameliorates
the a ntioxidant status. T his was shown by a decrease in lipid
peroxidation [monitored by determining the production of
thiobarbituric acid reactive substances (TBARS)] [8,9], a
decrease in lipid peroxidation markers in both LDL and
HDL [10], an increase in reduced glutathione (GSH) blood
concentration ( usually low in d iabetic patients) [11] and in
antioxidant enzyme activities (such as catalase and CuZn
superoxide dismutase) [11].
Furthermore, clinical benefits against vascular complica-
tions have been obtained, and protective e ffects against
diabetic complications have been observed with metformin
monotherapy [12]. Patients with type 2 diabetes receiving
either metformin alone or accompanied by another treat-
ment reduced by 40% the risk of developing f urther
vascular complications compared to those receiving other
treatments [12–14].
In order to improve the knowledge of M TF antioxidant
mode of action, this work focused o n th e direct antioxidant
properties of metformin in vitro against different oxygen-
derived free radical species generated in aqueous solution
by gamma radiolysis. Gamma radiolysis of water i s a well
known m ethod that has many advantages, such as the
homogeneous production of known quantities o f free
radicals (as superoxide an ion O
ÆÀ
2
or hydroxyl radical
Æ
OH), as well as the possibility to selectively produce
one specific radical to be studied at a time [15–18]. Free
radicals thus generated have been used to initiate one
electron oxidation reaction(s) on metformin dissolved in
water. In a previous work, we have identified the oxida-
tion end-products of
Æ
OH-induced oxidation of m etformin
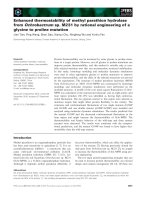
[19]. Four products have been characterized (Fig. 1):
methylbiguanide (MBG), a dimer o f M TF (diMTF), a
hydroperoxide of MTF (MTFOOH) and 4-amino-2-
imino-1-methyl-1,2-dihydro-1,3,5-triazine (4,2,1-AIMT).
The generation of these oxidation end-products was
shown to be dependent on the e xperimental conditions:
MTFOOH is only produced under aerated conditions,
while diMTF occurs only in nonaerated solutions,
saturated with nitrogen protoxide. The two other products,
MBG and 4,2,1-AIMT, have been found in both aerated
Correspondence t o H. Khouri or F. Collin, L aboratoire de Chimie
Physique, CNRS U M R 8601 universite
´
s Pa ris 5, 45 rue de s Sain ts-
Pe
`
res, 75270 Paris Cedex 06, Fr ance. F a x: + 33 1 42862213,
Tel.: + 33 1 42862173, E- mail: h or
Abbreviations: 4,2,1-AIMT, 4-amino-2-imino-1-methyl-1,2-dihydro-
1,3,5-triazine; AGE, a dvanced glycation end p roducts; GSH , glut a -
thione; MBG, methylbiguanide; MTF, metformin; ROS, reactive
oxygen species; TBARS, thiobarbituric acid reactive substance.
(Received 1 7 Au gust 2004, accepted 1 4 O ctober 2004)
Eur. J. Biochem. 271, 4745–4752 (2004) Ó FEBS 2004 doi:10.1111/j.1432-1033.2004.04438.x
and nonaerated irradiated solutions of metformin. How-
ever, o nly t wo radiation doses (50 and 300 Gy) and only
one concentration of metformin (200 lmolÆL
)1
) h ave been
studied [19]. In order to specify the
Æ
OH-induced oxidation
mechanism of m etformin, we p resent in this paper t he
effect of several radiation doses (from 52 to 627 Gy) on
different metformin concentrations (from 4 to 500 lmolÆ
L
)1
). UV/visible differential absorption spectra (where the
reference is non-irradiated solutions) have been recorded as
a function of the radiation dose.
In addition, we have determined the initial slope of the
curves [Dabsorbance
k
¼ f(radiation dose)] which is propor-
tional to the radiolytic yield (initial slope ¼ GÆDe
k
Æl, were G
is the radiolytic yield, De
k
the differential molar extinction
coefficient and l the optical path-length. Kinetic data have
been obtained from the dilution curves {i.e. GÆDe
k
Æl ¼
f([metformin])}, allowing us to discuss the possible compe-
tition of hydroxyl radicals between metformin and radio-
lytically generated hydrogen peroxide.
Materials and methods
Chemicals
All chemicals were purchased from Sigma (St Louis,
MO, USA) except when mentioned. Metformin solutions
(4–500 lmolÆL
)1
)werepreparedin10mmolÆL
)1
phosphate
buffer NaH
2
PO
4
Æ2H
2
O (purchased from Prolabo, Manche-
ster, UK) at pH 7. Ultra pure water (Maxima Ultra-pure
Water, ELGA, resistivity 18.2 MW) was used to pre pare the
solutions. Irradiations were carried out in test tubes that
have been previously cleaned with hot TFD4 d etergent
(Franklab S.A., France), rinsed thoroughly with ultra pure
water,andthenheatedat400°C for 4 h to avoid any
pollution by remaining organic compounds.
Gamma radiolysis
Radiolysis corresponds to the c hemical transformations of a
solvent due to the absorption of ionizing radiations, which
allows, w ithin a few nanoseconds, the production of a
homogeneous solution of free radicals. In addition, this
method allows selective generation of particular radicals
from the solvent, and thus it is possible to s tudy their action
towards the dissolved entities. Radiolytically generated free
radicals are independent of the nature and of the concen-
tration of the dissolved compound as long as its concentra-
tion remains lower than or equal to 10 mmolÆL
)1
[20].
Gamma r adiolysis was carried out by using an IBL 637
irradiator (CIS Biointernational, Gif-sur-Yvette, France) of
137
Cs source, whose activity was % 22 2 TBq (6000 Ci). In
our experiments the dose rate was 10.45 GyÆmin
)1
.The
dosimetry was determined by Fricke’s method [21], namely
radio-oxidation of 1 mmolÆL
)1
of iron(II) sulfate solution i n
0.4 molÆL
)1
sulfuric acid (under an aerated atmosphere)
taking k
max
(Fe
3+
) ¼ 304 nm, e
(304 nm)
¼ 2204 LÆmol
)1
Æ
cm
)1
)at25°C, and a radiolytic yield of G(Fe
3+
) ¼
1.62 lmolÆJ
)1
. Different radiation doses, ranging from 52
to 627 Gy, were delivered to 5 mL of the solution depend-
ing on the time of the exposure to the c-ray source: the
longer the time of the exposure, the higher the radiation
dose. For each experimental set, 5 mL of non-irradiated
solution was taken as a control.
Water radiolysis by c-rays generates the free radical
species e
–
aq
,
Æ
OH,
Æ
H, and the molecular species H
2
and
H
2
O
2
. U nder aerated conditions (oxygen c oncentration is
about 0.2 mmolÆL
)1
), hydroxyl and superoxide radicals
(resulting from the scavenging of e
–
aq
and
Æ
H species) were
simultaneously produced with radiolytic yields (G-values
expressed in molÆJ
)1
) of 0.28 and 0.34 lmolÆJ
)1
, respectively.
In order to select only hydroxyl radicals, radiolysis was
Fig. 1. Structures of the protonated form of
metformin (1,1-dimethylbiguanide) and of the
oxidation products generated from
Æ
OH attacks
on metformin, according to [19].
4746 H. Khouri et al. (Eur. J. Biochem. 271) Ó FEBS 2004
carried out in a nonaerated medium saturated with nitrogen
protoxide (N
2
O). N
2
O scavenges hydrated electrons and
converts them into hydroxyl radicals: as a result,
Æ
OH is
produced with a final G-value of 0.56 lmolÆJ
)1
,thatistwice
as high as the G-value in an aerated medium [20]. To
selectively obtain superoxide anions, s odium formate (Pro-
labo) was added to the solution at a concentration of
0.1 molÆL
)1
in order to c onvert all radicals (
Æ
OH,
Æ
Hand
e
–
aq
)intoO
2
Æ–
radicals with a final G-value of 0.62 lmolÆJ
)1
[20].
Analysis
Detection of the oxidation products was achieved by
spectrophotometric measurements with an UV/visible spec-
trophotometer (Beckman DU 70). Samples were scanned
from 200 nm to 300 nm. At p H 7 , metformin, like all
biguanides, is present in its mono-protonated form (Fig. 1).
Therefore, the p ossibility of r esonance gives to biguanides a
characteristic absorption band at about 230 nm [22]. Beer–
Lambert law was applicable on metformin within the
studied range of concentrations (4–500 lmolÆL
)1
), and the
molar extinction coefficient at 232 nm was found to be
12 300 ± 490 LÆmol
)1
Æcm
)1
).
Results
Action of
Æ
OH/O
ÆÀ
2
-free radicals
A 450 lmolÆL
)1
solution of metformin (in 10 mmolÆL
)1
sodium phosphate buffer, pH 7) was irradiated at doses
ranging from 52 to 627 Gy, with a dose rate of
10.45 GyÆmin
)1
. The absolute absorption spectra (refer-
ence ¼ phosphate buffer, 10 mmolÆL
)1
, pH 7) a re presen-
ted in Fig. 2A, as a function of the radiation dose. The
non-irradiated solution shows a main absorption band at
232 nm c orresponding to the absorption of metformin [22].
As the radiation dose increased, the absorption at this
wavelength decreased (illustrating the consumption of
metformin) and two new bands were detected at 208 nm
(intensified) and 258 nm, probably due to the generation of
oxidation products. Differential absorption spectra (refer-
ence ¼ non-irradiated metformin solution) allows us to
better show the same phenomenon (Fig. 2B). The arrows in
Fig. 2. UV/visible absorption spectra of
metformin (450 lmo lÆL
)1
) as a function of the
radiation dose (52–627 Gy) in aerated medium.
(A) Absolute absorption spectra (refer-
ence, phosphate buffer, 10 mmolÆL
)1
,pH7).
(B) Differential absorption spectra (refer-
ence, non-irradiated metformin solution).
Optical path-length: l ¼ 0.2 cm, dose rate:
I ¼ 10.45 GyÆmin
)1
. The arrows in dicate th e
decrease (disappearance) and the increase
(appearance) in t he a bsorbance values as a
function of the enhancing radiation dose.
Ó FEBS 2004 Radical-induced oxidation of metformin (Eur. J. Biochem. 271) 4747
Fig. 2 indicate the variations in the absorption intensity of
every characterized band as a function of the increasing
radiation dose. Differential spectra highlight the previous
observation: at 232 nm, the differential absorbance is
decreasing (consumption of metformin), while it increases
at 208 and 258 nm (formation of oxidation products).
The differential absorbances at 232 nm and 258 nm have
been reported as a fun ction of t he radiation dose (Fig. 3). At
232 nm, the differential absorbances decrease confirming
the consumption of metformin as a function of the radiation
dose (Fig. 3A). At 208 nm (not shown) and 258 nm
(Fig. 3B), the differential absorbance increases with the
radiation dose, indicating the simultaneous formation of
one or more oxidation products. However, the 258-nm
absorption band has been selected for this study, as non-
irradiated metformin solution does not absorb at all at this
wavelength; 258 nm is a characteristic wavelength of
aromatic structure. In fact, Collin et al. [19] have identified
4,2,1-AIMT as one oxidation product of metformin
(Fig. 1), which m ight be considered as the compound that
absorbs at this particular wavelength. The other oxidation
products identified (methylbiguanide and metformin
peroxide) seem to share the same spectral characteristics
as metformin since their chemical structures are very close.
Similar analyses have been replicated for several metfor-
min initial concentrations (4–500 lmolÆL
)1
). Initial slopes
of the curves [DAbs
k
¼ f(dose)], corresponding to GÆDe
k
Æl
(where G is the radiolytic yield, De
k
the molar extinction
coefficient and l the optical path-length) at 232 and 258 nm,
respectively, have b een reported as a function of the initial
concentration of metformin (Fig. 4A,B). These dilution
curves give the evolution of GÆDe
k
(corrected for optical
path-length l ¼ 1 cm) with the initial concentration of
metformin. Both dilution curves at 232 nm and 258 nm
exhibit the same profile, namely increasing values of GÆDe
k
at low metformin concentration (from 4 to 200 lmolÆL
)1
)
followed by plateau values of GÆDe
k
at high metformin
concentration (200–500 lmolÆL
)1
). Hence , these dilution
curves exhibit two key areas. At the plateau, the value G.De
k
at 232 nm or 258 nm reaches a steady state, meaning that
all free radicals (
Æ
OH/O
ÆÀ
2
) produced by water radiolysis
have reacted with metformin independently of its initial
concentration (200–500 lmolÆL
)1
). The second key area is
characterized by GÆDe
k
values that decrease as concentra-
tions o f metformin decrease (200–4 lmolÆL
)1
). This latter
phenomenon might be due to a competition between
Fig. 3. Differential absorbances as a function of the radiation dose.
[Metformin] ¼ 450 lmolÆL
)1
, [phosphate b uffer] ¼ 10 mmolÆL
)1
,
pH 7, aerated medium. Reference ¼ non-irradiated metformin solu-
tions. (A) 232 nm, (B) 258 nm. Op tical p ath-length: l ¼ 0.2 cm, dose
rate: I ¼ 10.45 GyÆmin
)1
. Uncertainties (RSD) h ave been calculated
as being equal to 4%, at the 95% confidence level (2 r, n ¼ 3).
Fig. 4. Dilution curves of metformin (GÆDe
k
as a function of the initial
concentration of metformin), [phosphate buffer] = 10 mmolÆL
)1
,pH7,
aerated medium. (A) 232 nm, (B) 258 nm – values are corrected for an
optical path-length of 1 cm. Uncertainties (RSD) have been calculated
as being equal to 4%, at the 95% confidence level (2 r, n ¼ 3).
4748 H. Khouri et al. (Eur. J. Biochem. 271) Ó FEBS 2004
metformin and either phosphate buffer or hydrogen
peroxide radiolytically generated, towards the action of
Æ
OH/O
ÆÀ
2
radicals.
To verify this assumption, the effect of various phosphate
buffer concentrations (0.05, 0.5 and 5 mmolÆL
)1
)atpH7
was studied in the presence of 50 lmolÆL
)1
of metformin.
After irradiation, solutions were analyzed by absorption
spectrophotometry at 232 nm. Any change was observed i n
the consumption of metformin, indicating that phosphate
buffer did not compete at all with metformin towards
Æ
OH/O
ÆÀ
2
-free radicals oxidation (data not shown).
When hydrogen peroxide was added to the metfo rmin
solutions, it was been first verified that there was no
detectable effect of H
2
O
2
as an initiator of metformin
oxidation in the absence of irradiation. However, under
irradiation, there was a noticeable effect of the concentra-
tion of H
2
O
2
(0.05, 0.5 and 5 mmolÆL
)1
) added to
metformin (50 lmo lÆL
)1
) as shown in Fig. 5. These
metformin–H
2
O
2
solutions were irradiated from 52 to
520 Gy and analyzed at 232 nm by absorption spectro-
photometry. The consumption of metformin was gradually
decreased by increasing the concentration of H
2
O
2
from
0.05 to 5 mmolÆL
)1
regardless of the radiation dose. At
5 mmolÆL
)1
H
2
O
2
, i t can be seen in Fig. 5 that m etformin
was n ot consumed as the radiation dose increased, i.e.
metformin no longer reacted with the radiolytically gener-
ated free radicals.
Action of O
ÆÀ
2
radicals
In order to study the effect of superoxide radicals as
initiators of metformin oxidation, metformin solutions at
different concentrations ranging from 50 to 100 lmolÆL
)1
were irradiated in the presence o f sodium formate
(0.1 mol ÆL
)1
). Under these conditions (0.1 molÆL
)1
of
sodium formate), O
ÆÀ
2
radicals are the only radical species
produced by water radiolysis with a formation yield of
0.62 lmolÆJ
)1
, as described in Materials and methods.
Metformin consumption was measured by absorption
spectrophotometry at 232 nm. Under our experimental
conditions, no detected effect of O
ÆÀ
2
radicals on the
initiation of metformin oxidation has been observed. This
phenomenon implies that superoxide radicals would mainly
dismutate in such conditions (k ¼ 6 · 10
5
LÆmol
)1
Æs
)1
at
pH 7 [23]).
Action of
Æ
OH radicals
In order to study the action of
Æ
OH radicals on the initiation
of metformin oxidation in nonaerated medium, different
solutions of metformin (4–500 lmolÆL
)1
)weresaturated
with nitrogen protoxide (N
2
O). Under these conditions,
Æ
OH radicals are the main radical s pecies produced from
water r adiolysis with a radiolytic yield of 5.6 · 10
)7
molÆJ
)1
(see Materials and methods). The apparition of m etformin
oxidation product(s) was followed by absorption spectro-
photometry at 258 nm.
In Fig. 6, for a metformin concentration of 500 lmolÆ
L
)1
, differential absorbances at 232 n m (Fig. 6A) and
258 nm ( Fig. 6B) have b een reported as a function of the
radiation dose (from 52 to 627 Gy). The formation of
oxidized product(s) exhibit the same profile as under a erated
conditions (Fig. 3 A,B), confirming that
Æ
OH radicals are
responsible for the initiation of metformin oxidation.
Several metformin concentrations were studied under the
same experimental conditions (nonaerated and N
2
O-satur-
ated medium). The initial slope of the curves [DAbs
k
¼
f(radiation dose)] allowed us to determine the GÆDe
k
values
(corrected for an optical path-length l ¼ 1 cm). Dilution
curves {GÆDe
k
¼ f([MTF])} were plotted on Fig. 7. It can
be observed that GÆDe
k
values increase with metformin
initial concentration u p to 200 lmolÆL
)1
and plate au va lues
are reached for metformin initial concentrations supe rior to
200 lmolÆL
)1
. At 232 and 258 nm (Fig. 7A,B, respectively),
it can be noted that GÆDe
k
plateau values (13 ± 2 · 10
)4
and 6.5 ± 0.5 · 10
)4
, respectively) are twice as high as
those obtained under aerated medium (6.5 ± 0.3 · 10
)4
,
Fig. 4A and 3.2 ± 0.2 · 10
)4
, Fig. 4B). These observa-
tions can be explained by the fact that
Æ
OH radicals have a
formation yield under N
2
O atmosphere (0.56 lmolÆJ
)1
)
twice as high as those of
Æ
OH radicals formed under aerated
medium (0.28 lmolÆJ
)1
). However, the exact G-values of
metformin oxidation products formation are not actually
known.
Fig. 5. Differential absorbance at 232 nm as a
function of the radiation dose for me tformin
solutions (50 lmolÆL
)1
) with or w ithout H
2
O
2
(0.05, 0.5 and 5 mmolÆL
)1
). [phosphate buf-
fer] ¼ 10 mmolÆL
)1
,pH7,aeratedmedium,
optical path-length: l ¼ 1 cm, do se ra te :
I ¼ 10.45 GyÆmin
)1
. (Reference, non-
irradiated metformin solution). Uncertainties
(RSD) have been calculated as b eing equal to
4%, at the 95% confidence level (2 r, n ¼ 3).
Ó FEBS 2004 Radical-induced oxidation of metformin (Eur. J. Biochem. 271) 4749
Discussion
According to our experimental results, it seems that neither
superoxide radicals nor hydrogen peroxide react with
metformin, but that
Æ
OH radicals are the only species
initiating metformin oxidation. Knowing that
Æ
OH-free
radicals can abstract one electron (charge transfer) or one H
atom, or add to a double bond, we may assume that
Æ
OH-
free radicals can abstract an H atom from the CH
3
groups
and/or from the N–H between the N(CH
3
)
2
and NH
2
.
Hydroxyl radicals can also add to the C¼NH double bonds
(giving nitrogen-centred free radicals). It can be noted that,
because of the conjugation of the nitrogen electron pair [of
NH
2
,NHandN(CH
3
)
2
]withtheC¼NH double bonds, the
charge transfe r process of
Æ
OH abstracting an electron from
the nitrogen electron pair seems rather unfavourable.
Scheme 1 summarizes the radical-induced oxidation of
metformin. MTF
Æ
symbolizes the
Æ
OH-induced radical of
metformin. Once metformin radicals are produced, they
might undergo various reactions leading to different oxida-
tion products [19]. In the presence of oxygen, metformin
radical may react with oxygen molecules leading to peroxy
radicals which could be reduced (maybe by superoxide
radicals) to give metformin hydroperoxide (MTFOOH),
whereas in the absence of oxygen, metformin radicals would
tend to dimerize (diMTF). The occurrence of these latter
compounds is oxygen dependent [19]. Another two oxida-
tion end-products have been observed by Collin et al., i.e.
MBG and 4,2,1-AIMT [19] whose mechanisms of forma-
tion are unknown. In order to specify the different steps
of the proposed mechanism, additional results would be
necessary, mainly the quantification of the oxidation
products.
The observed progressive inhibition of metformin oxida-
tion, in the presence of added hydrogen peroxide, would
come from the reaction of
Æ
OH radicals with H
2
O
2
.An
estimated value of the second order rate constant of
k(
Æ
OH + MTF) could be determined, by comparing the
initial rates of
Æ
OH radical with hydrogen peroxide [relation
(1)] or with metformin [relation (2)].
vð
Æ
OH þ H
2
O
2
Þ¼kð
Æ
OH þ H
2
O
2
Þ½
Æ
OH½H
2
O
2
0
ð1Þ
vð
Æ
OH þ MTFÞ¼kð
Æ
OH þ MTFÞ½
Æ
OH½MTF
0
ð2Þ
It is well known that the rate constant of
Æ
OH radicals with
H
2
O
2
is close to 10
7
LÆmol
)1
Æs
)1
[24]. For the highest
Fig. 6. Differential absorbances as a function of the radiation dose.
[Metformin] ¼ 500 lmolÆL
)1
, [phosphate b uffer] ¼ 10 mmolÆL
)1
,
pH 7, N
2
O-saturate d solutions. Reference, non-irradiated metformin
solution.(A)232nm,(B)258nm.Opticalpath-length:l¼ 0.2 cm,
dose rate: I ¼ 10.45 GyÆmin
)1
. Uncertainties (RSD) have been cal-
culated as being equal to 17% (A) and 8% (B), at the 9 5% confidence
level (2 r, n ¼ 3).
Fig. 7. Dilution curves of metformin (GÆDe
k
as a function of the initial
concentration of metformin), [phosphate buffer] = 10 mmolÆL
)1
,pH7,
N
2
O-saturated solutions. (A) 232 nm, (B) 258 nm – values are correc-
ted for an optical path-length of 1 cm. Uncertainties (RSD) have been
calculated as being equal to 17% (A) and 8% (B), at the 95% con-
fidence le vel ( 2 r, n ¼ 3).
4750 H. Khouri et al. (Eur. J. Biochem. 271) Ó FEBS 2004
hydrogen peroxide concentration (5 mmolÆL
)1
), a quasi-
total inhibition of metformin (50 lmolÆL
)1
) oxidation
(Fig. 5) has been observed, involving a reaction rate of it
Æ
OH radicals with H
2
O
2
at least 10 times higher than those
of
Æ
OH radicals with metformin [relation 3].
vð
Æ
OH þ H
2
O
2
Þ > 10 Â vð
Æ
OH þ MTFÞð3Þ
From relations 1–3, it can be deduced that the second order
rate constant [k(
Æ
OH + metformin)] is lower than 10
8
LÆmol
)1
Æs
)1
). Therefore, this rate constant is likely of the
same order of magnitude (% 10
7
LÆmol
)1
Æs
)1
) than that of
hydrogen peroxide with
Æ
OH radicals. It is worth mention-
ing that this value is rather weak for a reaction involving
hydroxyl radicals whose k-values are usually diffusion
controlled, and approximately e qual to 1 0
9
)10
10
LÆmol
)1
Æs
)1
[24]. Accordingly, metformin exhibits a relat-
ively weak radical scavenging capacity against
Æ
OH radicals
in vitro.
In the radiolysis solutions, H
2
O
2
could come from
different pathways: (i) from
Æ
OH radical recombination (in
the spurs) giving H
2
O
2
with a G-value of 0.7 · 10
)7
molÆJ
)1
(this production being independent of the presence of
metformin); (ii) from O
ÆÀ
2
(in equilibrium with HO
Æ
2
)
radical dismutation (in homogeneous phase) leading to
H
2
O
2
with a G-value of (3.4 · 10
)7
)/2 m olÆJ
)1
, i.e.
(Ge
–
aq
+G
H
)/2, in the case where O
2
Æ–
radicals do not
react neither with metformin nor with the metformin
radical, and (iii) from O
ÆÀ
2
radical oxidation of metfo rmin
radical giving H
2
O
2
with a G-value of 3.4 · 10
)7
molÆJ
)1
.
H
2
O
2
concentration in the radiolysis solution is propor-
tional to G(H
2
O
2
) and to the radiation dose ([H
2
O
2
] ¼
G(H
2
O
2
) · dose). For example, at 50 Gy (which is a dose
where G-value can be determined), t he following H
2
O
2
concentration can be calculated: 3 .5 lmolÆL
)1
[pathway
(i)], 1 2 lmolÆL
)1
[pathway (i) + (ii)] or 20.5 lmolÆL
)1
[pathway (i) + (iii)]. Such H
2
O
2
concentrations are similar
to the lowest concentrations of metformin (from 4 to
50 lmolÆL
)1
). Hence, the hypothesis of a competition of
Æ
OH radicals between H
2
O
2
and metformin is plausible
providing that the rate constants [k(
Æ
OH + H
2
O
2
)and
k(
Æ
OH + metformin)] be of the same order of magnitude
[i.e. % 10
7
LÆmol
)1
Æs
)1
]. In agreement with these consider-
ations, it can be proposed that the decrease of GÆDe
k
values
at low m etformin concentration ( 4–200 lmolÆL
)1
)(Figs4
and 7) would come from the competition of
Æ
OH radicals
between metformin and radiolytically generated hydrogen
peroxide.
Conclusion
We have investigated the antioxidant properties of metfor-
min against
Æ
OH and O
ÆÀ
2
-free radicals produced by water
gamma radiolysis. Metformin aqueous solutions (from 4 to
500 lmolÆL
)1
) were analyzed by UV/visible absorption
spectroscopy. We have shown that metformin does not
scavenge O
ÆÀ
2
radicals, but is able to react with
Æ
OH
radicals. However, under our experimental condition s, the
Æ
OH-induced oxidation of metformin depended on its
initial concentration because of the possible competitive
reaction of
Æ
OH radicals with radiolytically generated H
2
O
2
.
Moreover, we have determined an estimated value of
10
7
LÆmol
)1
Æs
)1
) for the second order r ate constant o f the
reaction of
Æ
OH radicals with metformin.
Our results obtained with an in vitro model allow
assuming that metformin, at a molecular level, is not a very
good scavenger of reactive oxygen species. Consequently, it
seems that metformin would certainly exert its in vivo
antioxidant activity by different pathways other than the
simple free radical scavenging action, such as increasing
the antioxidant enzyme activities [8,11,25], decreasing the
markers of lipid peroxidation [10,11] and inhibiting the
formation of AGEs [4,5].
Acknowledgements
Authors s how gratitude towards Dr N. Wiernsperger (LIPHA S.A.,
Lyon, France) for h is support to this work. As well our thanks to
Dr Averbeck of the Institut Curie – P aris for c irradiation f acil ities.
References
1. Betteridge, D.J. (2002) What is oxidative stress? Metabolism 49 ,
3–8.
2. Chu, N.V., Kong, A.P.S., Kim, D.P., Armstrong, D., Baxi, S.,
Deutch, R., Caulfield, M., Mudaliar,S.R.,Reitz,R.,Henry,R.R.
& Reaven, P.D. (2002) Differential effects of metformin and tro-
glitazone on cardiovascular risk factors in patients with type 2
diabetes. Diabetes Care 25, 542–549.
3. Rosen,P.,Nawroth,P.P.,King,G.,Moller,W.,Tritchler,H.J.&
Packer, L. (2001) The role of oxidative stress in the onset and
progression of diabetes and its complications: a summary of a
Scheme 1. Radical-induced oxidation scheme
of metformin.
Ó FEBS 2004 Radical-induced oxidation of metformin (Eur. J. Biochem. 271) 4751
congress series sponsored by UNESCO-MCBN, the American
Diabetes Association and the German Diabetes Society. Diabetes
Metab. Res. Rev. 17, 189–212.
4. Tanaka, Y., Uchino, H., Shimizu, T., Yoshii, H., Njwa, M.,
Ohmura, C., Mitsuhashi, N., On uma, T. & Kawamori, R. (1999)
Effect of metformin on advanced glycation end product formation
and peripheral nerve function in streptozocin-induced diabetic
rats. Eur. J. Pharmacol. 376 , 17–22.
5. Ruggiero-Lopez, D., Lecompte,M.,Moinet,G.,Patereau,G.,
Lagarde, M . & Wiernsperger, N. (1999) Reaction of metformin
with dicarbonyl compounds: possible implication in the inhibition
of advanced g lycation endproductformation. Bioche m. Phar-
macol. 58, 1765–1773.
6. Beisswenger, P.J., Howell, S.K., Touchette, A.D., Lal, S. &
Szwergold, B.S. (1999) Metformin reduces systemic methylglyoxal
levels in type 2 diabetes. Diabetes 48, 198–202.
7. Srividha, S. & Anuradha, C.V. (2002) Metformin improves liver
antioxidant potential in rat s fed a high-fructose diet. Asia Pacific J.
Clin. Nutr. 11, 319–322.
8. Faure, P., Rossini, E., Wiernsperger, N., Richard, J.M., Favier, A.
& Halini, S. (1999) An insulin sensitizer improves the free radical
defense system potential and insulin sensitivity in high fructose-fed
rats. Diabetes 48, 353–357.
9. Trivin, F., Chevenne, D. & Hautecouverture, M. (1999) Produits
de Maillard et complications chroniques du diabe
`
te sucre
´
. Ann.
Biol. Clin. 57, 445–454.
10. Tessier, D., Maheux, P., Khalil, A. & Fu
¨
lo
¨
p, T. (1999) Effect of
gliclazide versus metformin on the clinical profile and lipid per-
oxidation markers in type 2 diabetes. Metabolism 48, 897–903.
11. Pavlovic, D., Kocic, R., Kocic, G., Jevtovic, T., Radenkovic, S.,
Mikic, D., Stojanovic, M. & Djordjevic, P.B. (2000) Effect of four-
week metformin treatment on plasma and erythrocyte anti-
oxidative d efense enzymes in newly diagnosed obese patients with
type 2 diabetes. Diabetes Obes. Metab. 2, 251–256.
12. Wiernsperger, N. (2000) Metformin: intrinsic vasculoprotective
properties. Diab etes Technol. Ther. 2, 259–272.
13. UK Prospective Diabetes Study (UKPDS) Group. (1998) Effect of
intensive blood-glucose control with metformin on complications
in over weight patients with type 2 diab etes ( UKPDS 34). Lancet
352, 854–865.
14. Derosa, G., Mugellini, A., Ciccarelli,L.,Crescenzi,G.&Fogari,
R. (2003) Comparison of glycaemic control and cardiovascular
risk profile in patients wit h type 2 diabetes during treatment wit h
either repaglinide or metformin. Diabetes Res. Clin. Pract. 60 ,
161–169.
15. Garde
`
s-Albert, M. & Jore, D. (1998) La radiolyse: une me
´
thode
efficace d’approche des me
´
canismes radicalaires antioxydants.
J. Chim. Phys. 95, 763–766.
16. Bonnefont-Rousselot, D. (1999) Oxydation des lipoprote
´
ines et
me
´
canisme d’action des anti-oxydants: apport de la radiolyse
gamma. Ann. Biol. Clin. 57, 409–416.
17. Cadet, J., Berger, M., Buchko, G.W., Joshi, P.C., Morin, B.,
Raoul, S. & Ravanat, J.L. (1995) Hydroxyl and one-electron
oxidation mediated reactions of the purine bases of DNA and
model compounds: mechanistic aspects. In Radiation Damage in
DNA: Structure/Function Relationships at Early Times (Fuciarelli
A.F. & Zimbrick J.D., eds), pp. 305–312. Battelle Press, Colum-
bus, OH.
18. Vieira, J.S.C., Telo, J.P., Pereira, H.F., Patrocinio, P.F. & Dias,
R.M.B. (1999) Antioxidant effect of naturally occurring xanthines
on the oxidative damage of DNA bases. J. Chim. Phys. 96, 116–
123.
19. Collin, F., Khoury, H., Bonnefont-Rousselot, D., The
´
rond, P.,
Legrand, A., Jore, D. & Garde
`
s-Albert, M. (2004) Liquid chro-
matographic/electrospray ionisation mass spectrometric identifi-
cation of the oxidation end-products of metformin in aq ueous
solutions. J. Mass. Spectrom. 39, 890–902.
20. Spinks, J.W.T. & Woods, R.J. (1990) Water and inorganic
aqueous systems. In Introduction to Radiation Chemistry,3rdedn.
(A Wiley Interscience publication), pp. 243–313. Wiley, New
York.
21. Fricke, H. & Morse, S. (1927) The chemical action of Roentgen
rays on dilute ferrosulfonate solutions as a measure of dose. Am. J.
Roentgenol. Radium. Ther. 18, 430–432.
22. Beckmann, R. (1968) The fate o f biguanides in man. Ann. NY.
Acad. Sci. 148, 820–832.
23. Bielski, B.H.J., C abelli, D.E., Arudi, R.L. & Ross, A.B. (1985)
Reactivity of HO
2
/O
À
2
radicals in aqueou s solution. J. Phys.
Chem. Ref. Data 14, 1041–1100.
24. Buxton, G.V., Greenstock, C.L., Helman, W.P. & Ross, A.B.
(1988) Critical review of rate constants for reactions of hydrated
electrons, hydrogen atoms and hydroxyl radicals in aqueous
solution. J. Phys. Chem. Ref. Data 17, 513–887.
25. Ewiss, S.A. & Abdel-Rahman, M.S. (1995) Effect of metformin on
glutathione and m agnesium in n ormal an d stre tozotocin- indu ced
diabetic rats. J. Appl. T oxicol. 15, 387–390.
4752 H. Khouri et al. (Eur. J. Biochem. 271) Ó FEBS 2004