Towards an Aesthetic Dimensions Framework for Dynamic Graph Visualisations pptx
Bạn đang xem bản rút gọn của tài liệu. Xem và tải ngay bản đầy đủ của tài liệu tại đây (457.91 KB, 6 trang )
Towards an Aesthetic Dimensions Framework for Dynamic Graph Visualisations
Fabian Beck
Michael Burch
Stephan Diehl
University of Trier, Germany
Abstract
Most research on the readability of graph visualisation
focuses on node-link diagrams of static graphs. But in many
applications graphs are not static, but change over time, or
graphs are too dense to be drawn as node-link diagrams.
In this paper we look at dynamic graph visualisations: We
translate the general goal of graph visualisation—to con-
vey the underlying information of a graph—into aesthetic
dimensions that are applicable in practice. These aesthetic
dimensions help to design, compare, and evaluate dynamic
graph visualisations.
1 Introduction
While the aesthetics of node-link representations of
static graphs have been studied a lot [1], those of alternative
visual representations, as well as those of visual represen-
tation of dynamic graphs have received little attention. The
quality of visual representations of graphs in form of node-
link diagrams has been widely assessed by how good they
meet certain, mostly geometrical requirements often called
aesthetic criteria in the literature. These include the min-
imisation of the number of edge crossings or the reduction
of overlap of nodes and links. The goal of these criteria
is to improve the “aesthetics” of the visual representation.
Empirical studies [9, 8] have tried to validate or rank these
criteria by how good users could solve given tasks based
on different visual representations of graphs. In essence,
these studies reduce aesthetics to usability, or more pre-
cisely readability.
In this paper, we discuss and classify different represen-
tations of graphs (Section 2) and different approaches to vi-
sualise the dynamics of graphs (Section 3). In Section 4
we formulate general aesthetic criteria for graph visualisa-
tions, propose aesthetic criteria for visual representations
of dynamic graphs and discuss three dimensions of scala-
bility that are relevant for visualising dynamic graphs. To
illustrate the usefulness of the proposed criteria, we apply
them to discuss the benefits and drawbacks of three recently
developed graph visualisation techniques in Section 5. Fi-
nally, Section 6 presents some concluding remarks.
2 Visualising Graphs
Graphs are a method to formally model relations be-
tween objects. In graph theory the objects of a graph are
called vertices whereas the relations between pairs of ob-
jects are called edges. In this section we will discuss three
widely used techniques to represent graph structures. All
three approaches visualise the same kind of data—weighted
directed graphs—but they differ in the visual elements and
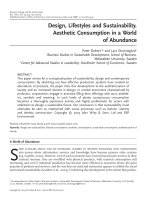
layout principles used. Figure 2 presents a small graph in
the three different representations as an example.
Node-Link Each vertex of the graph is represented by a
single visual element (node). Relations between ver-
tices are displayed as lines connecting their visual rep-
resentations (links). If the relation is not symmetric,
arrow heads indicate the direction of the relation. If the
relation is associated with a weight, the correspond-
ing link can be coloured with respect to a given colour
scheme.
Matrix A second approach to visualise a graph is to map
the weighted edges to a matrix. The vertices appear
twice in such a matrix. A vertex is represented ver-
tically by a column and horizontally by a row. The
appearance of a cell of the matrix indicates the exis-
tence of a certain edge: This edge connects the vertices
represented by the row and column intersecting at this
cell.
List A slightly different approach to visualise a graph
structure is to show for each vertex a visual represen-
tation of the list of all related vertices. As a result, a
vertex is represented multiple times, once as an entire
list and possibly once as a member of each list.
2009 13th International Conference Information Visualisation
978-0-7695-3733-7/09 $25.00 © 2009 IEEE
DOI 10.1109/IV.2009.42
598
2009 13th International Conference Information Visualisation
978-0-7695-3733-7/09 $25.00 © 2009 IEEE
DOI 10.1109/IV.2009.42
592
Figure 1. Node-link, matrix and list representation of the a small graph that consists of five vertices
and seven edges.
3 Visualising Dynamic Graphs
A graph structure that changes over time is called a dy-
namic graph. Orthogonal to the introduced visual represen-
tations, the following visualisation techniques render this
additional dimension visual.
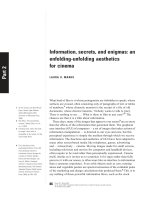
Figure 2. Aligned node-link and list represen-
tation of a dynamic graph consisting of three
subsequent graphs.
Sequence Dynamic graphs are often shown as a sequence
of single images put next to each other as in a comic
strip.
Animation An animation is a sequence of images which
are shown one after another. Each image represents
one of the graphs or an intermediate step of a smooth
transition from one graph to the next.
Alignment Another approach is to connect the diagrams
of the subsequent graphs more closely by integrating
them into a single diagram and aligning multiple vi-
sual representatives of the same vertex or edge over
the entire sequence of graphs.
For example, to integrate a sequence of node-link dia-
grams into a single image, a common approach is to
stack the sequence of node-link diagrams on top of
each other such that the nodes representing the same
vertex are vertically aligned. For list representations
the alignment is straightforward. Figure 3 shows ex-
amples of such aligned dynamic graph visualisations.
An alternative way to visualise dynamic graphs is to ag-
gregate all graphs into a single non-dynamic graph. Since
such an aggregation loses most of the dynamic information,
this case is out of scope for this paper.
4 Aesthetic Dimensions
The main goal of graph visualisation is on the one hand
to provide easy to access detail information and on the other
hand to uncover general regularities and anomalies of the
graph structure. This includes that the user is able to detect
and read information like edge weights, adjacency of ver-
tices, paths, as well as, clusters of vertices, outliers, trends,
symmetries and patterns. A dynamic graph visualisation
that meets these two general design goals is considered
readable, or in other words, aesthetic.
In this section we translate the unspecific term aesthetic
into a set of specific criteria that are directly applicable to
arbitrary dynamic graph visualisations. These criteria as-
pire to be independent and exhaustive as far as possible. We
consider them as aesthetic dimensions of dynamic graph vi-
sualisations. They are arranged in three groups: general
criteria, dynamic criteria, and scalability criteria.
4.1 General Aesthetic Criteria
For node-link representations various aesthetic crite-
ria [9, 8, 12] have been investigated, including minimisation
of drawing area, edge length, number of edge crossings and
edge bends, reduction of overlap, as well as the maximisa-
tion of angles between outgoing edges, crossing edges or in
edge bends.
599593
Some of these criteria also apply directly to matrix and
list representations. For example, in a matrix visualisation a
coloured pixel suffices to represent a weighted edge. Thus,
the drawing area required can be considered as minimal for
dense graphs. Other criteria do not apply directly: In matrix
visualisations there exist no edge crossings because cells of
a matrix do not overlap. Thus, by crystallising the gist of
the criteria we identified the following generalised aesthetic
criteria that apply to all three kinds of graph representations:
GAC1: Reduce visual clutter Visual clutter is the state in
which excess visual elements or their disorganisation
lead to a degradation of performance at some task [10].
In particular for node-link diagrams visual clutter
overly increases when the graphs become more dense.
Matrices have many benefits when visualising very
dense graphs [6]. Visual clutter that is caused in the
node-link approach by lots of edge crossings is here
reduced to a minimum.
GAC2: Reduce spatial aliases Visual elements that might
be mistaken one for the other due to their placement
are called spatial aliases.
Spatial aliases can occur if similar visual elements rep-
resenting different objects are put too close to each
other. In matrix representations of larger data set, this
easily happens when the user cannot distinguish two
adjacent rows or columns. In node-link diagrams spa-
tial aliases may also appear, for instance, if two edges
cross at a small angle.
GAC3: Spatial matching of multiple representatives
Multiple visual representatives of the same underlying
object that are spatially spread have to be matched to
extract the information.
For example, in matrix representations path tracking is
difficult due to unconnected multiple representatives of
vertices. The user has to switch from rows to columns
and columns to rows to follow edges.
GAC4: Maximise compactness A graph visualisation is
compact if it uses space (and time) efficiently for dis-
playing the graph information.
Matrix visualisations can be scaled down such that a
cell is shown by a single pixel on the screen and are
still readable to some extent. The matrix visualisation
is compact for dense graphs. In contrast, node-link di-
agrams need more space to draw edges. Edge length
minimisation aims to increase compactness of the dia-
grams.
4.2 Dynamic Aesthetic Criteria
When it comes to visualise the dynamics of a graph, ad-
ditional aesthetic criteria come into play. The user should
be able to follow trends easily, that is to say, the develop-
ment of edge weights, missing edges, or temporal patterns
should be visible.
DAC1: Preserving the mental map The term mental
map refers to the abstract structural information a user
forms by looking at the layout of a graph [7].
The mental map facilitates navigation in the graph or
comparison of it and other graphs. In the context of
dynamic graph drawing, changes to this map should be
minimal. The same property is sometimes also called
dynamic stability.
DAC2: Reducing the cognitive load The cognitive load
refers to the amount of information the user has to keep
in his working memory to read the visualisation.
To track what is going on in an animation or to com-
pare different graphs in a sequence or aligned repre-
sentation, the user has to keep some of the information
in his or her working memory. A visualisation is of no
use if the required amount of information exceeds the
capacity of the working memory or if it demands too
much attention such that the working memory is not
refreshed. In particular, for animations the cognitive
load is a major problem, because at each moment, we
see only a single image and have to rely on our working
memory to remember what happened before. Our use
of the term cognitive load is motivated by the concept
of extraneous cognitive load in learning theory [11].
DAC3: Minimising temporal aliases Visual elements
that might be mistaken one for the other due to their
placement in time/on a time axis are called temporal
aliases.
To detect changes in animations, a correspondence be-
tween visual elements in subsequent pictures has to be
established. The illusion of backward-spinning wagon
wheels in Western movies demonstrates that it is pos-
sible that the mind matches the wrong elements. If the
visual properties like position or shape of the visual
elements representing the same object in subsequent
graphs differ considerably, the user may not be able
to realise that these visual elements actually represent
the same object. This is not only possible in anima-
tions, but might also be a problem if the entire graph
sequence is concurrently displayed.
600594
4.3 Aesthetic Scalability Criteria
In general, scalability addresses the question whether a
tool is able to handle a growing data set or, more specifically
in the context of this paper, whether a visualisation is still
readable for larger data sets. Since dynamic graphs are able
to grow on different dimensions, their aesthetic scalability
has to be discussed separately for each dimension.
SC1: Scalability in number of vertices For increasing
numbers of vertices the readability of the visualisation
is preserved.
It is not realistic to assume that while increasing the
number of vertices, no edges are added to the graph.
Thus, a practical assumption for discussing the scala-
bility in number of vertices is that the density of the
graph stays at a constant level.
SC2: Scalability in number of edges For increasing
numbers of edges the readability of the visualisation
is preserved.
Increasing the number of edges—thus, increasing the
density of the graph—the node-link and list represen-
tation are growing while the space consumption of a
matrix representation stays the same. The matrix rep-
resentation, however, already needs quadratic space
for sparse graphs.
SC3: Scalability in number of graphs For increasing
numbers of graphs the readability of the visualisation
is preserved.
The dynamic aspect adds a third dimension to the
discussion of scalability: the number of subsequent
graphs. At first glance, animated dynamic graphs are
infinitely extensible in their number of graphs. Nev-
ertheless, this does not result in a good scalability be-
cause watching the animation the user is just able to
remember a few of the previous graphs. Thus, anima-
tions do only scale up to a very small number of graphs
but are independent from the sizes (number of vertices
and edges) of the single graphs.
4.4 Discussion
At best, all these aesthetic criteria are fulfilled concur-
rently by a dynamic graph visualisation. But in practise
some of the criteria are indirectly in conflict. For instance,
usually the scalability in number of graphs (SC3) can be
traded for the scalability in number of vertices or edges
(SC1 and SC2). Thus, the choice of a visualisation method
should be based on the criteria that are most important for
the particular application without ignoring the trade-offs.
To satisfy a certain criterion, the parameters of the visu-
alisation can be adapted. For example, for node-link repre-
sentations almost arbitrary node positions and edge routes
can be chosen. In contrast, for matrix visualisations rows
and columns can only be reordered. Thus, depending on the
type of visualisation the degrees of freedom are different.
Moreover, the visual representations can be extended by
interaction features. The user might browse through the
graph, request details on demand, or customise the visuali-
sation to his or her requirements. In particular, interaction
features are able to compensate shortcomings with respect
to some of the criteria. For example, brushing can mitigate
the problem of multiple representatives (GAC3). It would
be interesting for future work to investigate how interactions
might support particular aesthetic dimensions and what fur-
ther dimensions are needed for assessing interactions (for
example, based on the general dimensions introduced by
the Cognitive Dimensions Framework [4]).
5 Case Study
The introduced aesthetic dimensions can be used for var-
ious purposes, for example,
• to formulate design goals of a novel dynamic graph
visualisation
• to classify and compare existing dynamic graph visu-
alisations in qualitative evaluations
• to identify promising hypotheses for quantitative eval-
uations
This case study picks up the second use case. It com-
pares three recently developed dynamic graph visualisa-
tions: TimeRadarTrees [2], TimeArcTrees [5], and Fore-
sighted Layout with Tolerance [3]. Although such a case
study does not replace an quantitative evaluation, it provides
a standardised qualitative assessment scheme that helps to
identify the pros and cons of the visualisations and can be
used for formative evaluations. Like the following assess-
ment, such ratings are, however, subjective to some extent.
The following list describes the assessed techniques in
terms of the classification scheme for dynamic graph visu-
alisations introduced in Sections 2 and 3.
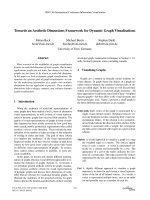
TimeRadarTrees (TRT) An aligned dynamic graph visu-
alisation based on a combined matrix-list representa-
tion (Figure 5).
TRT uses a radial layout where vertices are represented
by circle sectors of the inner circle. The representation
is aligned—it depicts each graph from the sequence of
graphs as a ring of the inner circle. The edge represen-
tation is a mixture of a matrix and a list representation:
601595
Figure 3. TimeRadarTrees (top) and TimeArc-
Trees (bottom) visualisation showing the
same dynamic graph that was already pre-
sented in Figure 3.
Incoming edges are coloured blocks in the inner circle
(a list representation without adjacency information).
Outgoing edges are coloured blocks in the outer cir-
cles at the same position of the associated incoming
edge (a distributed matrix representation).
TimeArcTrees (TAT) An aligned dynamic graph visuali-
sation based on a node-link representation (Figure 5).
To visualise a dynamic graph, TAT draws a sequence
of node-link diagrams from left to right such that each
node is placed in a particular row (aligned represen-
tation). A specialised algorithm, that aims to reduce
visual clutter, draws edges as links at the left and right
hand side of the nodes.
Foresighted Layout with Tolerance (FLT) An animated
dynamic graph visualisation based on a node-link rep-
resentation.
FLT is an offline approach to compute animated node-
TRT TAT FLT
GAC1: Reduce visual clutter + - o
GAC2: Reduce spatial aliases - o +
GAC3: Spatial matching of multiple
representatives
- + +
GAC4: Maximise compactness + - -
DAC1: Preserving the mental map + + o
DAC2: Reducing the cognitive load + + -
DAC3: Reducing temporal aliases + + -
SC1: Scalability in number of vertices o - +
SC2: Scalability in number of edges + - o
SC3: Scalability in number of graphs + o -
Table 1. Summarised comparison of the three
dynamic graph visualisations based on the
aesthetic dimensions.
link diagrams. It tries to minimise the changes of the
layouts of subsequent graphs without sacrificing qual-
ity of each individual layout. There are many other
approaches to produce animated node-link diagrams.
Here, FLT serves as a concrete representative of this
group—it would be questionable to generalise all pos-
sible approaches.
Next, we discuss these three visualisations based on the
aesthetic dimensions. Table 5 summarises the results of the
comparison. Please note that the ratings (+ good, o mod-
erate, - bad) are based on relative rankings of the three ap-
proaches.
First, the general aesthetic criteria (Section 4.1) just con-
sider static graphs. In TRT visual clutter is reduced (GAC1)
because visual elements do not overlap. But this also leads
to hard to match multiple representatives (GAC3) of edges
which are distributed over several circles. The compact-
ness (GAC4) is high because edge representations just need
at least a few pixels to be drawn. The compact represen-
tation, however, is prone to spatial aliases (GAC2), espe-
cially in the cramped circle center. In contrast, TAT and
FLT—both based on node-link diagrams—show nearly in-
verse qualities: They produce visual clutter through edge
crossings (GAC1) and are not as compact (GAC4) as TRT
because links are not as space-efficient. But there are no
multiple representations of vertices or edges (GAC3), and
spatial aliases (GAC2) only might appear for a few edges
(e.g., if they are draw nearly parallel). Comparing TAT and
FLT, TAT is heavily restricted in the positioning of nodes.
Thus, it is not possible to optimise the graph layout as far as
in FLT. The result is a better rating for FLT for visual clutter
(GAC1) and spatial aliases (GAC2).
For the general aesthetic criteria, the FLT approach per-
forms well. The following discussion about dynamic aes-
602596
thetic criteria, however, shows that the representation of
time in FLT is a main drawback of this visualisation. While
it is hard for the user of an animated node-link representa-
tion to preserve his or her mental map (DAC1), the whole
graph is concurrently visible in TRT and TAT, that is to
say, the mental map is always refreshable. Since TRT and
TAT are aligned representations, the user’s cognitive load
(DAC2) is low and temporal aliases (DAC3) are improb-
able. In contrast, the animated representation of FLT chal-
lenges the user much more with respect to these two criteria.
FLT, like some other animated node-link approaches, how-
ever, uses a special layout algorithm that strives to preserve
the mental map (DAC1).
Finally the scalability aspects complete the assessment.
Due to its high compactness, TRT has a good scalability
in number of edges and graphs (SC2 and SC3). Only the
scalability in number vertices (SC1) is not as high because
the vertex representation as circle sectors needs some space
to be readable. For TAT this problem is even worse. Fur-
thermore, TAT is far less compact which leads to a poor
rating concerning number of edges (SC2) and a moderate
rating concerning number of graphs (SC3). Since in FLT
the nodes can be scattered all around the drawing area, it
performs best with respect to the number of vertices (SC1)
and at least better than TAT with respect to the number of
edges (SC2). Although FLT is theoretically unrestricted in
number of graphs (SC3), we ranked this scalability criterion
last because the user is only able to remember a few of the
previously shown graphs. Analysis over longer time periods
are nearly impossible with such an animated representation.
All in all, this case study provides a clear picture of the
differences and similarities of the assessed visualisations.
While TRT and TAT support analyses in time, FLT might
be preferred when the dynamic aspect is not so important.
The main difference between TRT and TAT is on the one
hand the totally different behaviour for the general aesthetic
criteria and on the other hand the better scalability of TRT.
In practise, the right trade-off between all aesthetic criteria
has to be found for a particular application.
6 Conclusions
In this paper we briefly discussed dynamic graph visu-
alisation with the help of a general classification scheme.
We introduced aesthetic dimensions for these visualisations
consisting of three criteria groups: general and dynamic
aesthetic criteria, as well as scalability criteria. The case
study showed the usefulness of these criteria by compar-
ing three recently developed dynamic graph visualisations.
Differences and similarities clearly emerged on the differ-
ent dimensions. We consider the aesthetic criteria a major
step towards an aesthetic dimensions framework to design,
compare, and evaluate dynamic graph visualisations.
References
[1] C. Bennett, J. Ryall, L. Spalteholz, and A. Gooch. The
Aesthetics of Graph Visualization. In Proceedings of
Computational Aesthetics in Graphics, Visualization,
and Imaging, 2007.
[2] M. Burch and S. Diehl. TimeRadarTrees: Visualiz-
ing Dynamic Compound Digraphs. In Proceedings of
Tenth Joint Eurographics/IEEE-VGTC Symposium on
Visualization, Eindhoven, The Netherlands, 2008.
[3] S. Diehl and C. G
¨
org. Graphs, they are changing. In
S. G. Kobourov and M. T. Goodrich, editors, Graph
Drawing, volume 2528 of Lecture Notes in Computer
Science, pages 23–30. Springer, 2002.
[4] T. R. Green and M. Petre. Usability analysis of vi-
sual programming environments: A ’cognitive dimen-
sions’ framework. Journal of Visual Languages and
Computing, 7(2):131–174, 1996.
[5] M. Greilich, M. Burch, and S. Diehl. Visual-
izing the Evolution of Compound Digraphs with
TimeArcTrees. In Proceedings of the Eleventh Joint
Eurographics/IEEE-VGTC Symposium on Visualiza-
tion, Berlin, Germany, 2009.
[6] R. Keller, C. M. Eckert, and P. J. Clarkson. Matrices
or node-link diagrams: which visual representation is
better for visualising connectivity models? Informa-
tion Visualization, 5:62–76, 2006.
[7] K. Misue, P. Eades, W. Lai, and K. Sugiyama. Layout
Adjustment and the Mental Map. Journal of Visual
Languages and Computing, 6(2):183–210, 1995.
[8] H. C. Purchase. Which aesthetic has the greatest effect
on human understanding? In Proceedings of the 5th
International Symposium on Graph Drawing, pages
248–261, London, UK, 1997. Springer.
[9] H. C. Purchase, R. F. Cohen, and M. James. Validating
graph drawing aesthetics. In Proceedings of the Sym-
posium on Graph Drawing, pages 435–446, London,
UK, 1996. Springer.
[10] R. Rosenholtz, Y. Li, and L. Nakano. Measuring vi-
sual clutter. Journal of Vision, 7(2):1–22, 2007.
[11] J. Sweller, J. J. G. Van Merrienboer, and F. G. W. C.
Paas. Cognitive architecture and instructional design.
Educational Psychology Review, 10:251–296, 1998.
[12] C. Ware, H. C. Purchase, L. Colpoys, and M. McGill.
Cognitive measurements of graph aesthetics. Informa-
tion Visualization, 1(2):103–110, 2002.
603597