Plant physiology - Chapter 14 Gene Expression and Signal Transduction potx
Bạn đang xem bản rút gọn của tài liệu. Xem và tải ngay bản đầy đủ của tài liệu tại đây (328.81 KB, 30 trang )
1
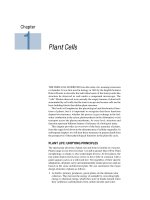
PLANT BIOLOGISTS MAY BE FORGIVEN for taking abiding sat-
isfaction in the fact that Mendel’s classic studies on the role of her-
itable factors in development were carried out on a flowering plant:
the garden pea. The heritable factors that Mendel discovered, which
control such characters as flower color, flower position, pod shape,
stem length, seed color, and seed shape, came to be called genes.
Genes are the DNA sequences that encode the RNA molecules
directly involved in making the enzymes and structural proteins of
the cell. Genes are arranged linearly on chromosomes, which form
linkage groups—that is, genes that are inherited together. The total
amount of DNA or genetic information contained in a cell, nucleus,
or organelle is termed its genome.
Since Mendel’s pioneering discoveries in his garden, the princi-
ple has become firmly established that the growth, development,
and environmental responses of even the simplest microorganism
are determined by the programmed expression of its genes. Among
multicellular organisms, turning genes on (gene expression) or off
alters a cell’s complement of enzymes and structural proteins,
allowing cells to differentiate. In the chapters that follow, we will
discuss various aspects of plant development in relation to the reg-
ulation of gene expression.
Various internal signals are required for coordinating the expres-
sion of genes during development and for enabling the plant to
respond to environmental signals. Such internal (as well as external)
signaling agents typically bring about their effects by means of
sequences of biochemical reactions, called signal transduction path-
ways, that greatly amplify the original signal and ultimately result
in the activation or repression of genes.
Much progress has been made in the study of signal transduction
pathways in plants in recent years. However, before describing what
Gene Expression and Signal Transduction
14
CHAPTER 14
2
is known about these pathways in plants, we will provide
background information on gene expression and signal
transduction in other organisms, such as bacteria, yeasts,
and animals, making reference to plant systems wherever
appropriate. These models will provide the framework
for the recent advances in the study of plant development
that are discussed in subsequent chapters.
Genome Size, Organization, and
Complexity
As might be expected, the size of the genome bears some
relation to the complexity of the organism. For example,
the genome size of E. coli is 4.7 × 10
6
bp (base pairs), that
of the fruit fly is 2 × 10
8
bp per haploid cell, and that of a
human is 3 × 10
9
bp per haploid cell. However, genome
size in eukaryotes is an unreliable indicator of complex-
ity because not all of the DNA encodes genes.
In prokaryotes, nearly all of the DNA consists of
unique sequences that encode proteins or functional
RNA molecules. In addition to unique sequences, how-
ever, eukaryotic chromosomes contain large amounts of
noncoding DNA whose main functions appear to be
chromosome organization and structure. Much of this
noncoding DNA consists of multicopy sequences, called
repetitive DNA. The remainder of the noncoding DNA
is made up of single-copy sequences called spacer DNA.
Together, repetitive and spacer DNA can make up the
majority of the total genome in some eukaryotes. For
example, in humans only about 5% of the total DNA
consists of genes, the unique sequences that encode for
RNA and protein synthesis.
The genome size in plants is more variable than in
any other group of eukaryotes. In angiosperms, the hap-
loid genome ranges from about 1.5 × 10
8
bp for Ara-
bidopsis thaliana (smaller than that of the fruit fly) to 1 ×
10
11
bp for the monocot Trillium,which is considerably
larger than the human genome. Even closely related
beans of the genus Vicia exhibit genomic DNA contents
that vary over a 20-fold range. Why are plant genomes
so variable in size?
Studies of plant molecular biology have shown that
most of the DNA in plants with large genomes is repet-
itive DNA. Arabidopsis has the smallest genome of any
plant because only 10% of its nuclear DNA is repetitive
DNA. The genome size of rice is estimated to be about
five times that of Arabidopsis, yet the total amount of
unique sequence DNA in the rice genome is about the
same as in Arabidopsis. Thus the difference in genome
size between Arabidopsis and rice is due mainly to repet-
itive and spacer DNA.
Most Plant Haploid Genomes Contain 20,000 to
30,000 Genes
Until recently, the total number of genes in an organ-
ism’s genome was difficult to assess. Thanks to recent
advances in many genomic sequencing projects, such
numbers are now becoming available, although precise
values are still lacking. According to Miklos and Rubin
(1996), the number of genes in bacteria varies from 500
to 8,000 and overlaps with the number of genes in many
simple unicellular eukaryotes. For example, the yeast
genome appears to contain about 6,000 genes. More
complex eukaryotes, such as protozoans, worms, and
flies, all seem to have gene numbers in the range of
12,000 to 14,000. The Drosophila (fruit fly) genome con-
tains about 12,000 genes. Thus, the current view is that
it takes roughly 12,000 basic types of genes to form a
eukaryotic organism, although values as high as 43,000
genes are common, as a result of multiple copies of cer-
tain genes, or multigene families.
The best-studied plant genome is that of Arabidop-
sis thaliana. Chris Somerville and his colleagues at Stan-
ford University have estimated that the Arabidopsis
genome contains roughly 20,000 genes (Rounsley et al.
1996). This estimate is based on more than one
approach. For example, since large regions of the
genome have been sequenced, we know there is one
gene for every 5 kb (kilobases) of DNA. Since the entire
genome contains about 100,000 kb, there must be about
20,000 genes. However, 6% of the genome encodes
ribosomal RNA, and another 2% consists of highly
repetitive sequences, so the number could be lower.
Similar values likely will be found for the genomes of
other plants as well. The current consensus is that the
genomes of most plants will be found to contain from
20,000 to 30,000 genes.
Some of these genes encode proteins that perform
housekeeping functions, basic cellular processes that go
on in all the different kinds of cells. Such genes are per-
manently turned on; that is, they are constitutively
expressed. Other genes are highly regulated, being
turned on or off at specific stages of development or in
response to specific environmental stimuli.
Prokaryotic Gene Expression
The first step in gene expression is transcription, the
synthesis of an mRNA copy of the DNA template that
encodes a protein (Alberts et al. 1994; Lodish et al. 1995).
Transcription is followed by translation, the synthesis
of the protein on the ribosome. Developmental studies
have shown that each plant organ contains large num-
bers of organ-specific mRNAs. Transcription is con-
trolled by proteins that bind DNA, and these DNA-
binding proteins are themselves subject to various types
of regulation.
Much of our understanding of the basic elements of
transcription is derived from early work on bacterial
systems; hence we precede our discussion of eukaryotic
gene expression with a brief overview of transcriptional
regulation in prokaryotes. However, it is now clear that
Gene Expression and Signal Transduction
3
gene regulation in eukaryotes is far more complex than
in prokaryotes. The added complexity of gene expres-
sion in eukaryotes is what allows cells and tissues to dif-
ferentiate and makes possible the diverse life cycles of
plants and animals.
DNA-Binding Proteins Regulate Transcription in
Prokaryotes
In prokaryotes, genes are arranged in operons, sets of
contiguous genes that include structural genes and reg-
ulatory sequences. A famous example is the E. coli lac-
tose (lac) operon, which was first described in 1961 by
François Jacob and Jacques Monod of the Pasteur Insti-
tute in Paris. The lac operon is an example of an
inducible operon—that is, one in which a key metabolic
intermediate induces the transcription of the genes.
The lac operon is responsible for the production of
three proteins involved in utilization of the disaccharide
lactose. This operon consists of three structural genes
and three regulatory sequences. The structural genes (z,
y, and a) code for the sequence of amino acids in three
proteins: β-galactosidase, the enzyme that catalyzes the
hydrolysis of lactose to glucose and galactose; perme-
ase, a carrier protein for the membrane transport of lac-
tose into the cell; and transacetylase, the significance of
which is unknown.
The three regulatory sequences (i, p, and o) control
the transcription of mRNA for the synthesis of these
proteins (Figure 14.1). Gene i is responsible for the syn-
thesis of a repressor protein that recognizes and binds
to a specific nucleotide sequence, the operator. The
operator, o, is located downstream (i.e., on the 3′ side) of
Gene zDNA
mRNA
Gene y Gene a
Operator o
Transcription is blocked when
repressor protein binds to operator;
z y a mRNA is not made, and
therefore enzymes are not
produced
Transcription initiation site
Structural genes
Lactose operon
Translation
Transcription
mRNA
Translation
β-Galactosidase
Acetylase
Permease
Lactose
inducer
Transcription
Repressor protein binds
to the operator gene
RNA
polymerase
attaches to promoter
5′
DNA Gene yGene z
Repressor–inducer
(inactive)
Repressor
protein
Gene a
Promoter p
Operator o
5′
3′
3′
(A)
(B)
RNA
polymerase
mRNA
Transcription occurs
Regulatory
gene i
Regulatory
gene i
Promoter p
Figure 14.1 The lac operon of E. coli uses negative control. (A) The regulatory gene i,
located upstream of the operon, is transcribed to produce an mRNA that encodes a
repressor protein. The repressor protein binds to the operator gene
o. The operator is a
short stretch of DNA located between the promoter sequence
p (the site of RNA poly-
merase attachment to the DNA) and the three structural genes,
z, y, and a. Upon binding
to the operator, the repressor prevents RNA polymerase from binding to the transcription
initiation site. (B) When lactose (inducer) is added to the medium and is taken up by the
cell, it binds to the repressor and inactivates it. The inactivated repressor is unable to bind
to
o, and transcription and translation can proceed. The mRNA produced is termed “poly-
cistronic” because it encodes multiple genes. Note that translation begins while transcrip-
tion is still in progress.
CHAPTER 14
4
the promoter sequence, p, where RNA polymerase
attaches to the operon to initiate transcription, and
immediately upstream (i.e., on the 5′ side) of the tran-
scription start site, where transcription begins. (The ini-
tiation site is considered to be at the 5′ end of the gene,
even though the RNA polymerase transcribes from the
3′ end to the 5′ end along the opposite strand. This con-
vention was adopted so that the sequence of the mRNA
would match the DNA sequence of the gene.)
In the absence of lactose, the lactose repressor forms a
tight complex with the operator sequence and blocks the
interaction of RNA polymerase with the transcription start
site, effectively preventing transcription (see Figure 14.1A).
When present, lactose binds to the repressor, causing it to
undergo a conformational change (see Figure 14.1B). The
lac repressor is thus an allosteric protein whose confor-
mation is determined by the presence or absence of an
effector molecule, in this case lactose. As a result of the
conformational change due to binding lactose, the lac
repressor detaches from the operator. When the operator
sequence is unobstructed, the RNA polymerase can move
along the DNA, synthesizing a continuous mRNA. The
translation of this mRNA yields the three proteins, and
lactose is said to induce their synthesis.
The lac repressor is an example of negative control,
since the repressor blocks transcription upon binding to
the operator region of the operon. The lac operon is also
regulated by positive control, which was discovered in
connection with a phenomenon called the glucose effect.
If glucose is added to a nutrient medium that includes
lactose, the E. coli cells metabolize the glucose and ignore
the lactose. Glucose suppresses expression of the lac
operon and prevents synthesis of the enzymes needed to
degrade lactose. Glucose exerts this effect by lowering
the cellular concentration of cyclic AMP (cAMP). When
glucose levels are low, cAMP levels are high. Cyclic AMP
binds to an activator protein, the catabolite activator pro-
tein (CAP), which recognizes and binds to a specific
nucleotide sequence immediately upstream of the lac
operator and promoter sites (Figure 14.2).
In contrast to the behavior of the lactose repressor pro-
tein, when the CAP is complexed with its effector, cAMP,
its affinity for its DNA-binding site is dramatically
increased (hence the reference to positive control). The
ternary complex formed by CAP, cAMP, and the lactose
operon DNA sequences induces bending of the DNA,
which activates transcription of the lactose operon struc-
tural genes by increasing the affinity of RNA polymerase
for the neighboring promoter site. Bacteria synthesize
cyclic AMP when they exhaust the glucose in their
growth medium. The lactose operon genes are thus under
opposing regulation by the absence of glucose (high lev-
els of cyclic AMP) and the presence of lactose, since glu-
cose is a catabolite of lactose.
In bacteria, metabolites can also serve as corepressors,
activating a repressor protein that blocks transcription.
Repression of enzyme synthesis is often involved in the
regulation of biosynthetic pathways in which one or
Gene zDNA Gene y Gene a
Operator o
Lactose operon
CAP–cAMP
complex
RNA polymerase
5′
3′
(A)
CAP
Cyclic AMP
(cAMP)
Gene zDNA Gene y Gene a
Operator o
Transcription
occurs
mRNA
5′
3′
(B)
Regulatory
gene i
Promoter p
Regulatory
gene i
Promoter p
Catabolite
activator
protein
Figure 14.2 Stimulation of transcription by the catabolite
activator protein (CAP) and cyclic AMP (cAMP). CAP has no
effect on transcription until cAMP binds to it. (A) The CAP–
cAMP complex binds to a specific DNA sequence near the
promoter region of the
lac operon. (B) Binding of the CAP–
cAMP complex makes the promoter region more accessible to
RNA polymerase, and transcription rates are enhanced.
more enzymes are synthesized only if the end product
of the pathway—an amino acid, for example—is not
available. In such a case the amino acid acts as a core-
pressor: It complexes with the repressor protein, and
this complex attaches to the operator DNA, preventing
transcription. The tryptophan (trp) operon in E. coli is an
example of an operon that works by corepression (Fig-
ure 14.3).
Eukaryotic Gene Expression
The study of bacterial gene expression has provided
models that can be tested in eukaryotes. However, the
details of the process are quite different and more com-
plex in eukaryotes. In prokaryotes, translation is cou-
pled to transcription: As the mRNA transcripts elongate,
they bind to ribosomes and begin synthesizing proteins
(translation). In eukaryotes, however, the nuclear enve-
lope separates the genome from the translational
machinery. The transcripts must first be transported to
the cytoplasm, adding another level of control.
Eukaryotic Nuclear Transcripts Require Extensive
Processing
Eukaryotes differ from prokaryotes also in the organi-
zation of their genomes. In most eukaryotic organisms,
each gene encodes a single polypeptide. The eukaryotic
nuclear genome contains no operons, with one notable
exception.* Furthermore, eukaryotic genes are divided
into coding regions called exons and noncoding regions
Gene Expression and Signal Transduction
5
Gene EDNA
mRNA
Gene D Gene C Gene B Gene A
Gene E Gene D Gene C Gene B Gene A
Tryptophan operon
Translation
Transcription
mRNA
Translation
Transcription
Repressor (inactive)
RNA
polymerase
5′
DNA
Repressor
protein
Corepressor
(tryptophan)
5′
3′
3′
(A)
(B)
RNA
polymerase
mRNA
Transcription occurs
Repressor–corepressor complex (active)
Transcription is blocked
Enzymes for tryptophan synthesis
Regulatory
gene i
Promoter p
Operator o
Regulatory
gene i
Promoter p
Operator o
Figure 14.3 The tryptophan (trp) operon of E. coli. Tryptophan (Trp) is the end product
of the pathway catalyzed by tryptophan synthetase and other enzymes. Transcription of
the repressor genes results in the production of a repressor protein. However, the repres-
sor is inactive until it forms a complex with its corepressor, Trp. (A) In the absence of
Trp, transcription and translation proceed. (B) In the presence of Trp, the activated repres-
sor–corepressor complex blocks transcription by binding to the operator sequence.
* About 25% of the genes in the nematode Caenorhabditis ele-
gans
are in operons. The operon pre-mRNAs are processed
into individual mRNAs that encode single polypeptides
(monocistronic mRNAs) by a combination of cleavage,
polyadenylation, and splicing (Kuersten et al. 1997).
CHAPTER 14
6
called introns (Figure 14.4). Since the primary tran-
script, or pre-mRNA, contains both exon and intron
sequences, the pre-mRNA must be processed to remove
the introns.
RNA processing involves multiple steps. The newly
synthesized pre-mRNA is immediately packaged into a
string of small protein-containing particles, called het-
eronuclear ribonucleoprotein particles, or hnRNP par-
ticles. Some of these particles are composed of proteins
and small nuclear RNAs, and are called small nuclear
ribonucleoproteins,orsnRNPs (pronounced “snurps”).
Various snRNPs assemble into spliceosome complexes
at exon–intron boundaries of the pre-mRNA and carry
out the splicing reaction.
In some cases, the primary transcript can be spliced
in different ways, a process called alternative RNA
splicing. For example, an exon that is present in one
version of a processed transcript may be spliced out of
another version. In this way, the same gene can give rise
to different polypeptide chains. Approximately 15% of
human genes are processed by alternative splicing.
Although alternative splicing is rare in plants, it is
involved in the synthesis of rubisco activase, RNA poly-
merase II, and the gene product of a rice homeobox gene
(discussed later in the chapter), as well as other proteins
(Golovkin and Reddy 1996).
Before splicing, the pre-mRNA is modified in two
important ways. First it is capped by the addition of 7-
methylguanylate to the 5′ end of the transcript via a 5′-
to-5′ linkage. The pre-mRNA is capped almost immedi-
ately after the initiation of mRNA synthesis. One of the
functions of the 5′ cap is to protect the growing RNA
transcript from degradation by RNases. At a later stage
in the synthesis of the primary transcript, the 3′ end is
Intron Intron
DNA
Promoter
Exon Exon Exon
Translational stop siteAUG (Translational start site)
Transcription
starts here
RNA polymerase II
5′
3′
mRNA
Polysome
Released polypeptides
Pre-mRNA
m
7
G cap
Transcription occurs
Transcription
(+ capping and polyadenylation)
Translation
Transport out of nucleus to cytoplasm
Processing of precursor
AAAA
n
AAAA
n
AAAA
n
Figure 14.4 Gene expression in eukaryotes. RNA polymerase II binds to the promoter of
genes that encode proteins. Unlike prokaryotic genes, eukaryotic genes are not clustered
in operons, and each is divided into introns and exons. Transcription from the template
strand proceeds in the 3
′-to-5′ direction at the transcription start site, and the growing
RNA chain extends one nucleotide at a time in the 5
′-to-3′ direction. Translation begins
with the first AUG encoding methionine, as in prokaryotes, and ends with the stop
codon. The pre-mRNA transcript is first “capped” by the addition of 7-methylguanylate
(m
7
G) to the 5′ end. The 3′ end is shortened slightly by cleavage at a specific site, and a
poly-A tail is added. The capped and polyadenylated pre-mRNA is then spliced by a
spliceosome complex, and the introns are removed. The mature mRNA exits the nucleus
through the pores and initiates translation on ribosomes in the cytosol. As each ribosome
progresses toward the 3
′ end of the mRNA, new ribosomes attach at the 5′ end and begin
translating, leading to the formation of polysomes.
cleaved at a specific site, and a poly-A tail, usually con-
sisting of about 100 to 200 adenylic acid residues, is
added by the enzyme poly-A polymerase (see Figure
14.4).
The poly-A tail has several functions: (1) It protects
against RNases and therefore increases the stability of
mRNA molecules in the cytoplasm, (2) both it and the 5′
cap are required for transit through the nuclear pore,
and (3) it increases the efficiency of translation on the
ribosomes. The requirement of eukaryotic mRNAs to
have both a 5′ cap and a poly-A tail ensures that only
properly processed transcripts will reach the ribosome
and be translated.
Each step in eukaryotic gene expression can poten-
tially regulate the amount of gene product in the cell at
any given time (Figure 14.5). Like transcription initia-
tion, splicing may be regulated. Export from the nucleus
is also regulated. For example, to exit the nucleus an
mRNA must possess a 5′ cap and a poly-A tail, and it
must be properly spliced. Incompletely processed tran-
scripts remain in the nucleus and are degraded.
Various Posttranscriptional Regulatory
Mechanisms Have Been Identified
The stabilities or turnover rates of mRNA molecules dif-
fer from one another, and may vary from tissue to tis-
sue, depending on the physiological conditions. For
example, in bean (Vicia faba), fungal infection causes the
rapid degradation of the mRNA that encodes the pro-
line-rich protein PvPRP1 of the bean cell wall. Another
example of the regulation of gene expression by RNA
degradation is the regulation of expression of one of the
genes for the small subunit of rubisco in roots of the
aquatic duckweed Lemna gibba. Lemna roots are photo-
synthetic and therefore express genes for the small sub-
unit of rubisco, but the expression of one of the genes
(SSU5B) is much lower in roots than in the fronds
(leaves). Jane Silverthorne and her colleagues at the Uni-
versity of California, Santa Cruz, showed that the low
level of SSU5B in the roots is due to a high rate of
turnover of the SSU5B pre-mRNA in the nucleus (Peters
and Silverthorne 1995).
In addition to RNA turnover, the translatability of
mRNA molecules is variable. For example, RNAs fold
into molecules with varying secondary and tertiary
structures that can influence the accessibility of the
translation initiation codon (the first AUG sequence) to
the ribosome. Another factor that can influence trans-
latability of an mRNA is codon usage. There is redun-
dancy in the triplet codons that specify a given amino
acid during translation, and each cell has a characteris-
tic ratio of the different aminoacylated tRNAs available,
known as codon bias. If a message contains a large
number of triplet codons that are rare for that cell, the
small number of charged tRNAs available for those
codons will slow translation. Finally, the cellular loca-
tion at which translation occurs seems to affect the rate
of gene expression. Free polysomes may translate
mRNAs at very different rates from those at which
polysomes bound to the endoplasmic reticulum do;
even within the endoplasmic reticulum, there may be
differential translation rates.
Although examples of posttranscriptional regulation
have been demonstrated for each of the steps described
above and summarized in Figure 14.5, the expression of
most eukaryotic genes, like their prokaryotic counterparts,
appears to be regulated at the level of transcription.
Gene Expression and Signal Transduction
7
The levels for control
of gene expression
Genome
Transcription
RNA processing
and translocation
Translation
Posttranslation
Chromatin
DNA available for expression
NUCLEUS
CYTOPLASM
Gene amplification (rare)
DNA rearrangements (rare)
Chromatin decondensation
DNA methylation
RNA polymerase II
Primary RNA transcript
Processing (5′ capping, addition
of poly-A tail, excision of
introns, splicing together of
exons) and turnover
mRNA in nucleus
Transport of mRNA across
nuclear envelope
mRNA in cytosol
mRNA degradation
(turnover)
Functional protein
Protein degradation
(turnover)
Translation
Possible targeting to ER
Polypeptide product in cytosol or ER
Protein folding and assembly
Possible polypeptide cleavage
Possible modification
Possible import into organelles
1
2
3
4
5
Figure 14.5 Eukaryotic gene expression can be regulated
at multiple levels. (1) genomic regulation, by gene amplifi-
cation, DNA rearrangements, chromatin decondensation or
condensation, or DNA methylation; (2) transcriptional regu-
lation; (3) RNA processing, and RNA turnover in the nucleus
and translocation out of the nucleus; (4) translational con-
trol (including binding to ER in some cases); (5) posttransla-
tional control, including mRNA turnover in the cytosol, and
the folding, assembly, modification, and import of proteins
into organelles. (After Becker et al. 1996.)
Transcription in Eukaryotes Is Modulated
by cis-Acting Regulatory Sequences
The synthesis of most eukaryotic proteins is regulated
at the level of transcription. However, transcription in
eukaryotes is much more complex than in prokaryotes.
First, there are three different RNA polymerases in
eukaryotes: I, II, and III. RNA polymerase I is located in
the nucleolus and functions in the synthesis of most
ribosomal RNAs. RNA polymerase II, located in the
nucleoplasm, is responsible for pre-mRNA synthesis.
RNA polymerase III, also located in the nucleoplasm,
synthesizes small RNAs, such as tRNA and 5S rRNA.
A second important difference between transcription
in prokaryotes and in eukaryotes is that the RNA poly-
merases of eukaryotes require additional proteins called
general transcription factors to position them at the cor-
rect start site. While prokaryotic RNA polymerases also
require accessory polypeptides called sigma factors (σ),
these polypeptides are considered to be subunits of the
RNA polymerase. In contrast, eukaryotic general tran-
scription factors make up a large, multisubunit tran-
scription initiation complex. For example, seven gen-
eral transcription factors constitute the initiation
complex of RNA polymerase II, each of which must be
added in a specific order during assembly (Figure 14.6).
According to one current model, transcription is ini-
tiated when the final transcription factor, TFIIH (tran-
scription factor for RNA polymerase II protein H), joins
the complex and causes phosphorylation of the RNA
polymerase. RNA polymerase II then separates from the
initiation complex and proceeds along the antisense
strand in the 3′-to-5′ direction. While some of the gen-
eral transcription factors dissociate from the complex at
this point, others remain to bind another RNA poly-
merase molecule and initiate another round of tran-
scription.
A third difference between transcription in prokary-
otes and in eukaryotes is in the complexity of the pro-
moters, the sequences upstream (5′) of the initiation site
that regulate transcription. We can divide the structure
of the eukaryotic promoter into two parts, the core or
minimum promoter, consisting of the minimum up-
stream sequence required for gene expression, and the
additional regulatory sequences, which control the
activity of the core promoter.
Each of the three RNA polymerases has a different
type of promoter. An example of a typical RNA poly-
merase II promoter is shown schematically in Figure
14.7A. The minimum promoter for genes transcribed by
RNA polymerase II typically extends about 100 bp
upstream of the transcription initiation site and includes
several sequence elements referred to as proximal pro-
moter sequences. About 25 to 35 bp upstream of the
transcriptional start site is a short sequence called the
TATA box, consisting of the sequence TATAAA(A). The
TATA box plays a crucial role in transcription because it
serves as the site of assembly of the transcription initia-
tion complex. Approximately 85% of the plant genes
sequenced thus far contain TATA boxes.
In addition to the TATA box, the minimum promot-
ers of eukaryotes also contain two additional regulatory
sequences: the CAAT box and the GC box (see Figure
14.7A). These two sequences are the sites of binding of
transcription factors, proteins that enhance the rate of
transcription by facilitating the assembly of the initia-
tion complex. The DNA sequences themselves are
CHAPTER 14
8
1
P P P P
Transcription Begins
Protein kinase (TFIIH) activity
Start of transcription
TFIID
TATA
TFIIB
TFIIF
TFIIE
TFIIH
RNA polymerase II
2
3
4
Figure 14.6 Ordered assembly of the general transcription
factors required for transcription by RNA polymerase II. (1)
TFIID, a multisubunit complex, binds to the TATA box via
the TATA-binding protein. (2) TFIIB joins the complex. (3)
TFIIF bound to RNA polymerase II associates with the com-
plex, along with TFIIE and TFIIH. The assembly of proteins is
referred to as the transcription initiation complex. (4) TFIIH,
a protein kinase, phosphorylates the RNA polymerase, some
of the general transcription factors are released, and tran-
scription begins. (From Alberts et al. 1994.)
termed cis-acting sequences, since they are adjacent to
the transcription units they are regulating. The tran-
scription factors that bind to the cis-acting sequences are
called trans-acting factors, since the genes that encode
them are located elsewhere in the genome.
Numerous other cis-acting sequences located farther
upstream of the proximal promoter sequences can exert
either positive or negative control over eukaryotic pro-
moters. These sequences are termed the distal regula-
tory sequences and they are usually located within 1000
bp of the transcription initiation site. As with prokary-
otes, the positively acting transcription factors that bind
to these sites are called activators, while those that
inhibit transcription are called repressors.
As we will see in Chapters 19 and 20, the regulation
of gene expression by the plant hormones and by phyto-
chrome is thought to involve the deactivation of repres-
sor proteins. Cis-acting sequences involved in gene reg-
ulation by hormones and other signaling agents are
called response elements. As will be discussed in Chap-
ters 17 and 19 through 23 (on phytochrome and the
plant hormones), numerous response elements that reg-
ulate gene expression have been identified in plants.
In addition to having regulatory sequences within the
promoter itself, eukaryotic genes can be regulated by
control elements located tens of thousands of base pairs
away from the start site. Distantly located positive reg-
ulatory sequences are called enhancers. Enhancers may
be located either upstream or downstream from the pro-
moter. In plants, many developmentally important plant
genes have been shown to be regulated by enhancers
(Sundaresan et al. 1995).
How do all the DNA-binding proteins on the cis-act-
ing sequences regulate transcription? During formation
Gene Expression and Signal Transduction
9
GGGCGG
GC box CAAT box
Gene X
Promoter
DNA
GCCCAATCT TATAAA
TATA
RNA polymerase II and
general transcription factors
Spacer
DNA
The gene
control
region
for gene X
Silent assembly of
regulatory proteins
Strongly activating
assembly
Strongly
inhibiting
protein
Weakly
activating
protein
assembly
Gene regulatory proteins
RNA
polymerase II
Regulatory
sequence
Proximal control element
General
transcription
factors
RNA
transcript
(A)
(B)
–100 –80
TATA box
–25
Figure 14.7 Organization and regulation of a typical eukaryotic gene. (A) Features of a
typical eukaryotic RNA polymerase II minimum promoter and proteins that regulate gene
expression. RNA polymerase II is situated at the TATA box in association with the general
transcription factors about 25 bp upstream of the transcription start site. Two
cis-acting
regulatory sequences that enhance the activity of RNA polymerase II are the CAAT box
and the GC box, located at about 80 and 100 bp upstream, respectively, of the transcrip-
tion start site. The DNA proteins that bind to these elements are indicated. (B) Regulation
of transcription by distal regulatory sequences and
trans-acting factors. trans-acting fac-
tors bound to distal regulatory sequences can act in concert to activate transcription by
making direct physical contact with the transcription initiation complex. The details of
this process are not well understood. (A after Alberts et al. 1994; B from Alberts et al
1994.)
of the initiation complex, the DNA between the core
promoter and the most distally located control elements
loops out in such a way as to allow all of the transcrip-
tion factors bound to that segment of DNA to make
physical contact with the initiation complex (see Figure
14.7B). Through this physical contact the transcription
factor exerts its control, either positive or negative, over
transcription. Given the large number of control ele-
ments that can modify the activity of a single promoter,
the possibilities for differential gene regulation in
eukaryotes are nearly infinite.
Transcription Factors Contain Specific
Structural Motifs
Transcription factors generally have three structural fea-
tures: a DNA-binding domain, a transcription-activat-
ing domain, and a ligand-binding domain. To bind to
a specific sequence of DNA, the DNA-binding domain
must have extensive interactions with the double helix
through the formation of hydrogen, ionic, and hydro-
phobic bonds. Although the particular combination and
spatial distribution of such interactions are unique for
each sequence, analyses of many DNA-binding proteins
have led to the identification of a small number of
highly conserved DNA-binding structural motifs, which
are summarized in Table 14.1.
Most of the transcription factors characterized thus
far in plants belong to the basic zipper (bZIP) class of
DNA-binding proteins. DNA-binding proteins contain-
ing the zinc finger domain are relatively rare in plants.
Homeodomain Proteins Are a Special Class of
Helix-Turn-Helix Proteins
The term “homeodomain protein” is derived from a
group of Drosophila (fruit fly) genes called selector genes
or homeotic genes. Drosophila homeotic genes encode
transcription factors that determine which structures
develop at specific locations on the fly’s body; that is,
they act as major developmental switches that activate
a large number of genes that constitute the entire genetic
CHAPTER 14
10
Table 14.1
DNA-Binding Motifs
Name Examples of proteins Key structural features Illustration
Helix-turn-helix Transcription factors that Two α helices separated
regulate genes in antho- by a turn in the polypep-
cyanin biosynthesis tide chain; function as
pathway dimers
Zinc finger COP1 in Arabidopsis Various structures in which
zinc plays an important
structural role; bind to DNA
either as monomers or as
dimers
Helix-loop-helix GT element–binding protein A short α helix connected
of phytochrome-regulated by a loop to a longer α helix;
genes function as dimers
Leucine zipper Fos and Jun An α helix of about 35 amino
acids containing leucine
at every seventh position;
dimerization occurs along
the hydrophobic surface
Basic zipper Opaque 2 protein in maize, Variation of the leucine zipper
(bZip) G box factors of phyto- motif in which other hydro-
chrome-regulated genes, phobic amino acids substitute
transcription factors that for leucine and the DNA-
bind ABA response binding domain contains
elements amino acids
COOH
NH
2
NH
+
3
H
+
3
N
Zn
His
His
Cys
Cys
Zn
Cys
Cys
Cys
Cys
+
+
+
+
+
+
+
+
Leu
Leu
Leu
Leu
Leu
Leu
NH
+
3
H
+
3
N
COO
–
COO
–
COO
–
COO
–
Ala
Leu
Val
Ise
Ala
Val
program for a particular structure. Mutations in
homeotic genes cause homeosis, the transformation of
one body part into another. For example, a homeotic
mutation in the ANTENNAPEDIA gene causes a leg to
form in place of an antenna. When the sequences of var-
ious homeotic genes in Drosophila were compared, the
proteins were all found to contain a highly conserved
stretch of 60 amino acids called the homeobox.
Homologous homeobox sequences have now been
identified in developmentally important genes of verte-
brates and plants. As will be discussed in Chapter 16,
the KN1 (KNOTTED) gene of maize encodes a home-
odomain protein that can affect cell fate during devel-
opment. Maize plants with the kn1 mutation exhibit
abnormal cell divisions in the vascular tissues, giving
rise to the “knotted” appearance of the leaf surface.
However, the kn1 mutation is not a homeotic mutation,
since it does not involve the substitution of one entire
structure for another. Rather, the plant homeodomain
protein, KN1, is involved in the regulation of cell divi-
sion. Thus, not all genes that encode homeodomain pro-
teins are homeotic genes, and vice versa. As will be dis-
cussed in Chapter 24, four of the floral homeotic genes
in plants encode proteins with the DNA-binding helix-
turn-helix motif called the MADS domain.
Eukaryotic Genes Can Be Coordinately Regulated
Although eukaryotic nuclear genes are not arranged
into operons, they are often coordinately regulated in
the cell. For example, in yeast, many of the enzymes
involved in galactose metabolism and transport are
inducible and coregulated, even though the genes are
located on different chromosomes. Incubation of wild-
type yeast cells in galactose-containing media results in
more than a thousandfold increase in the mRNA levels
for all of these enzymes.
The six yeast genes that encode the enzymes in the
galactose metabolism pathway are under both positive
and negative control (Figure 14.8). Most yeast genes are
regulated by a single proximal control element called an
upstream activating sequence (UAS). The GAL4 gene
encodes a transcription factor that binds to UAS ele-
ments located about 200 bp upstream of the transcrip-
tion start sites of all six genes. The UAS of each of the six
genes, while not identical, consists of one or more copies
of a similar 17 bp repeated sequence. The GAL4 protein
can bind to each of them and activate transcription. In
this way a single transcription factor can control the expres-
sion of many genes.
Protein–protein interactions can modify the effects of
DNA-binding transcription factors. Another gene on a
different yeast chromosome, GAL80, encodes a negative
transcription regulator that forms a complex with the
GAL4 protein when it is bound to the UAS. When the
GAL80 protein is complexed with GAL4, transcription is
blocked. In the presence of galactose, however, the meta-
bolite formed by the enzyme that is encoded by the GAL3
gene acts as an inducer by causing the dissociation of
GAL80 from GAL4 (Johnston 1987; Mortimer et al. 1989).
There are many other examples of coordinate regu-
lation of genes in eukaryotes. In plants, the develop-
mental effects induced by light and hormones (see
Chapters 17 through 23), as well as the adaptive
responses caused by various types of stress (see Chap-
ter 25), involve the coordinate regulation of groups of
genes that share a common response element upstream
of the promoter. In addition, genes that act as major
developmental switches, such as the homeotic genes,
encode transcription factors that bind to a common reg-
ulatory sequence that is present on dozens, or even hun-
dreds, of genes scattered throughout the genome (see
Chapters 16 and 24).
The Ubiquitin Pathway Regulates Protein Turnover
An enzyme molecule, once synthesized, has a finite life-
time in the cell, ranging from a few minutes to several
hours. Hence, steady-state levels of cellular enzymes are
attained as the result of an equilibrium between enzyme
synthesis and enzyme degradation, or turnover. Protein
turnover plays an important role in development. In eti-
olated seedlings, for example, the red-light photorecep-
tor, phytochrome, is regulated by proteolysis. The phy-
tochrome synthesized in the dark is highly stable and
accumulates in the cells to high concentrations. Upon
exposure to red light, however, the phytochrome is con-
verted to its active form and simultaneously becomes
highly susceptible to degradation by proteases (see
Chapter 17).
In animal cells there are two distinct pathways of pro-
tein turnover, one in specialized digestive vacuoles
called lysosomes and the other in the cytosol. Proteins
destined to be digested in lysosomes appear to be
specifically targeted to these organelles. Upon entering
the lysosomes, the proteins are rapidly degraded by
lysosomal proteases. Lysosomes are also capable of
engulfing and digesting entire organelles by an auto-
phagic process. The central vacuole of plant cells is rich
in proteases and is the plant equivalent of lysosomes,
but as yet there is no clear evidence that plant vacuoles
either engulf organelles or participate in the turnover of
cytosolic proteins, except during senescence.
The nonlysosomal pathway of protein turnover
involves the ATP-dependent formation of a covalent
bond to a small, 76-amino-acid polypeptide called ubiq-
uitin. Ubiquitination of an enzyme molecule apparently
marks it for destruction by a large ATP-dependent pro-
teolytic complex (26S proteasome) that specifically rec-
ognizes the “tagged” molecule (Coux et al. 1996). More
than 90% of the short-lived proteins in eukaryotic cells
are degraded via the ubiquitin pathway (Lam 1997). The
ubiquitin pathway regulates cytosolic protein turnover
in plant cells as well (Shanklin et al. 1987).
Gene Expression and Signal Transduction
11
Before it can take part in protein tagging, free ubiq-
uitin must be activated (Figure 14.9). The enzyme E1 cat-
alyzes the ATP-dependent adenylylation of the C ter-
minus of ubiquitin. The adenylylated ubiquitin is then
transferred to a second enzyme, called E2. Proteins des-
tined for ubiquitination form complexes with a third
protein, E3. Finally, the E2–ubiquitin conjugate is used
to transfer ubiquitin to the lysine residues of proteins
bound to E3. This process can occur multiple times to
form a polymer of ubiquitin. The ubiquitinated protein
is then targeted to the proteasome for degradation. As
we shall see in Chapter 19, recent evidence suggests that
CHAPTER 14
12
E1
E1
E2
E2
E3
AMP
ATP
+
U
UU
U
U
U
U
U
U
U
U
U
Target Target
Degradation
Target
Ubiquitin activation
26S
proteasome
Figure 14.9 Diagram of the ubiquitin (U) pathway of pro-
tein degradation in the cytosol. ATP is required for the ini-
tial activation of E1. E1 tranfers ubiquitin to E2. E3 medi-
ates the final transfer of ubiquitin to a target protein,
which may be ubiquinated multiple times. The ubiquinated
target protein is then degraded by the 26S proteasome.
EXTRACELLULAR SPACE
NUCLEUS
CYTOSOL
Galactose
Galactose
Melibiose
α-Galactosidase
GAL3
protein
GAL2
(transport enzyme)
Inducer
Glucose-1-phosphate
MEL1
GAL1
GAL7
GAL10
GAL7
Chromosome XIII
Chromosome XVI
Chromosome II
Chromosome XII
Chromosome IV
GAL80
Translation
GAL80
protein
Blocks
GAL4 protein
Removes GAL80
Activates
GAL80 mRNA
GAL4
GAL4 mRNA
GAL7 GAL10 GAL1
MEL1
GAL2
GAL3
UAS
Figure 14.8 Model for eukaryotic gene induction: the
galactose metabolism pathway of the yeast
Saccharomyces
cerevisiae
. Several enzymes involved in galactose transport
and metabolism are induced by a metabolite of galactose.
The genes
GAL7, GAL10, GAL1, and MEL1 are located on
chromosome II;
GAL2 is on chromosome XII; GAL3 is on
chromosome IV.
GAL4 and GAL80, located on two other
chromosomes, encode positive and negative
trans-acting
regulatory proteins, respectively. The GAL4 protein binds to
an upstream activating sequence located upstream of each
of the genes in the pathway, indicated by the hatched
lines. The GAL80 protein forms an inhibitory complex with
the GAL4 protein. In the presence of galactose, the
metabolite formed by the GAL3 gene product diffuses to
the nucleus and stimulates transcription by causing dissoci-
ation of the GAL80 protein from the complex. (After
Darnell et al. 1990.)
the regulation of gene expression by the phytohormone,
auxin, may be mediated in part by the activation of the
ubiquitin pathway.
Signal Transduction in Prokaryotes
Prokaryotic cells could not have survived billions of
years of evolution without an exquisitely developed
ability to sense their environment. As we have seen, bac-
teria respond to the presence of a nutrient by synthesiz-
ing the proteins involved in the uptake and metabolism
of that nutrient. Bacteria can also respond to nonnutri-
ent signals, both physical and chemical. Motile bacteria
can adjust their movements according to the prevailing
gradients of light, oxygen, osmolarity, temperature, and
toxic chemicals in the medium.
The basic mechanisms that enable bacteria to sense
and to respond to their environment are common to all
cell sensory systems, and include stimulus detection, sig-
nal amplification, and the appropriate output responses.
Many bacterial signaling pathways have been shown to
consist of modular units called transmitters and receivers.
These modules form the basis of the so-called two-com-
ponent regulatory systems.
Bacteria Employ Two-Component Regulatory
Systems to Sense Extracellular Signals
Bacteria sense chemicals in the environment by means
of a small family of cell surface receptors, each involved
in the response to a defined group of chemicals (here-
after referred to as ligands). A protein in the plasma
membrane of bacteria binds directly to a ligand, or
binds to a soluble protein that has already attached to
the ligand, in the periplasmic space between the plasma
membrane and the cell wall. Upon binding, the mem-
brane protein undergoes a conformational change that
is propagated across the membrane to the cytosolic
domain of the receptor protein. This conformational
change initiates the signaling pathway that leads to the
response.
Abroad spectrum of responses in bacteria, including
osmoregulation, chemotaxis, and sporulation, are regu-
lated by two-component systems. Two-component reg-
ulatory systems are composed of a sensor protein and
a response regulator protein (Figure 14.10) (Parkinson
1993). The function of the sensor is to receive the signal
and to pass the signal on to the response regulator,
which brings about the cellular response, typically gene
expression. Sensor proteins have two domains, an input
domain, which receives the environmental signal, and
a transmitter domain, which transmits the signal to the
response regulator. The response regulator also has two
domains, a receiver domain, which receives the signal
from the transmitter domain of the sensor protein, and
an output domain, such as a DNA-binding domain,
which brings about the response.
The signal is passed from transmitter domain to re-
ceiver domain via protein phosphorylation. Transmitter
domains have the ability to phosphorylate themselves,
using ATP, on a specific histidine residue near the amino
terminus (Figure 14.11A). For this reason, sensor proteins
containing transmitter domains are called autophos-
phorylating histidine kinases. These proteins normally
Gene Expression and Signal Transduction
13
Sensor protein Response regulator
Input
signal
Outpu
t
signal
Input OutputTransmitter Receiver
P
+
–
Figure 14.10 Signaling via bacterial two-component sys-
tems. The sensor protein detects the stimulus via the input
domain and transfers the signal to the transmitter domain
by means of a conformational change (indicated by the
first dashed arrow). The transmitter domain of the sensor
then communicates with the response regulator by protein
phosphorylation of the receiver domain. Phosphorylation
of the receiver domain induces a conformational change
(second dashed arrow) that activates the output domain
and brings about the cellular response. (After Parkinson
1993.)
P
R
R
HH
Transmitter (T):
(A)
(B)
Receiver (R):
H
Phosphorylation sites
D
T
T
Autophosphorylation
Phosphorylation
ATP ADP
P
DD
Conformational
change
of response
regulator
∫
∫
Figure 14.11 Phosphorylation signaling mechanism of bac-
terial two-component systems. (A) The transmitter domain
of the sensor protein contains a conserved histidine (H) at
its N-terminal end, while the receiver domain of the re-
sponse regulator contains a conserved aspartate (D).
(B) The transmitter phosphorylates itself at its conserved
histidine and transfers the phosphate to the aspartate of
the response regulator. The response regulator then under-
goes a conformational change leading to the response.
(After Parkinson 1993.)
function as dimers in which the catalytic site of one sub-
unit phosphorylates the acceptor site on the other.
Immediately after the transmitter domain becomes
autophosphorylated on a histidine residue, the phos-
phate is transferred to a specific aspartate residue near
the middle of the receiver domain of the response regu-
lator protein (see Figure 14.11A). As a result, a specific
aspartate residue of the response regulator becomes
phosphorylated (Figure 14.11B). Phosphorylation of the
aspartate residue causes the response regulator to
undergo a conformational change that results in its acti-
vation.
Osmolarity Is Detected by a Two-Component
System
An example of a relatively simple bacterial two-compo-
nent system is the signaling system involved in sensing
osmolarity in E. coli. E. coli is a Gram-negative bacterium
and thus has two cell membranes, an inner membrane
and an outer membrane, separated by a cell wall. The
inner membrane is the primary permeability barrier of
the cell. The outer membrane contains large pores com-
posed of two types of porin proteins, OmpF and OmpC.
Pores made with OmpF are larger than those made with
OmpC.
When E. coli is subjected to high osmolarity in the
medium, it synthesizes more OmpC than OmpF, result-
ing in smaller pores on the outer membrane. These
smaller pores filter out the solutes from the periplasmic
space, shielding the inner membrane from the effects of
the high solute concentration in the external medium.
When the bacterium is placed in a medium with low
osmolarity, more OmpF is synthesized, and the average
pore size increases.
As Figure 14.12 shows, expression of the genes that
encode the two porin proteins is regulated by a two-
component system. The sensor protein, EnvZ, is located
on the inner membrane. It consists of an N-terminal
periplasmic input domain that detects the osmolarity
changes in the medium, flanked by two membrane-
spanning segments, and a C-terminal cytoplasmic trans-
mitter domain.
When the osmolarity of the medium increases, the
input domain undergoes a conformational change that
is transduced across the membrane to the transmitter
domain. The transmitter then autophosphorylates its
histidine residue. The phosphate is rapidly transferred
to an aspartate residue of the receiver domain of the
response regulator, OmpR. The N terminus of OmpR
consists of a DNA-binding domain. When activated by
phosphorylation, this domain interacts with RNA poly-
merase at the promoters of the porin genes, enhancing
the expression of ompC and repressing the expression of
ompF. Under conditions of low osmolarity in the
medium, the nonphosphorylated form of OmpR stimu-
lates ompF expression and represses ompC expression. In
this way the osmolarity stimulus is communicated to
the genes.
Related Two-Component Systems Have Been
Identified in Eukaryotes
Recently, combination sensor–response regulator pro-
teins related to the bacterial two-component systems
have been discovered in yeast and in plants. For exam-
ple, The SLN1 gene of the yeast Saccharomyces cerevisiae
encodes a 134-kilodalton protein that has sequence sim-
ilarities to both the transmitter and the receiver domains
of bacteria and appears to function in osmoregulation
(Ota and Varshavsky 1993).
There is increasing evidence that several plant sig-
naling systems evolved from bacterial two-component
systems. For example, the red/far-red–absorbing pig-
ment, phytochrome, has now been demonstrated in
CHAPTER 14
14
PERIPLASMIC
SPACE
CYTOPLASMIC
MEMBRANE
P
ATP
P
P
Medium
osmolarity
Control of
porin expression
High
Low
EnvZ
OmpR
DNA-binding
domain
Figure 14.12 E. coli two-component system for osmoregu-
lation. When the osmolarity of the medium is high, the
membrane sensor protein, EnvZ (in the form of a dimer),
acts as an autophosphorylating histidine kinase. The phos-
phorylated EnvZ then phosphorylates the response regula-
tor, OmpR, which has a DNA-binding domain. Phosphory-
lated OmpR binds to the promoters of the two porin genes,
ompC and ompF, enhancing expression of the former and
repressing expression of the latter. When the osmolarity of
the medium is low, EnvZ acts as a protein phosphatase
instead of a kinase and dephosphorylates OmpR. When the
nonphosphorylated form of OmpR binds to the promoters
of the two porin genes,
ompC expression is repressed and
ompF expression is stimulated. (From Parkinson 1993.)
cyanobacteria, and it appears to be related to bacterial
sensor proteins (see Chapter 17). In addition, the genes
that encode putative receptors for two plant hormones,
cytokinin and ethylene, both contain autophosphory-
lating histidine kinase domains, as well as contiguous
response regulator motifs. These proteins will be dis-
cussed further in Chapters 21 and 22.
Signal Transduction in Eukaryotes
Many eukaryotic microorganisms use chemical signals
in cell–cell communication. For example, in the slime
mold Dictyostelium, starvation induces certain cells to
secrete cyclic AMP (cAMP). The secreted cAMP diffuses
across the substrate and induces nearby cells to aggre-
gate into a sluglike colony. Yeast mating-type factors are
another example of chemical communication between
the cells of simple microorganisms. Around a billion
years ago, however, cell signaling took a great leap in
complexity when eukaryotic cells began to associate
together as multicellular organisms. After the evolution
of multicellularity came a trend toward ever-increasing
cell specialization, as well as the development of tissues
and organs to perform specific functions.
Coordination of the development and environmental
responses of complex multicellular organisms required
an array of signaling mechanisms. Two main systems
evolved in animals: the nervous system and the endo-
crine system. Plants, lacking motility, never developed a
nervous system, but they did evolve hormones as chem-
ical messengers. As photosynthesizing organisms, plants
also evolved mechanisms for adapting their growth and
development to the amount and quality of light.
In the sections that follow we will explore some of the
basic mechanisms of signal transduction in animals,
emphasizing pathways that may have some parallel in
plants. However, keep in mind that plant signal trans-
duction pathways may differ in significant ways from
those of animals. To illustrate this point, we end the
chapter with an overview of some of the known plant-
specific transmembrane receptors.
Two Classes of Signals Define Two Classes of
Receptors
Hormones fall into two classes based on their ability to
move across the plasma membrane: lipophilic hormones,
which diffuse readily across the hydrophobic bilayer of
the plasma membrane; and water-soluble hormones,
which are unable to enter the cell. Lipophilic hormones
bind mainly to receptors in the cytoplasm or nucleus;
water-soluble hormones bind to receptors located on the
cell surface. In either case, ligand binding alters the
receptor, typically by causing a conformational change.
Some receptors, such as the steroid hormone recep-
tors (see the next section), can regulate gene expression
directly. In the vast majority of cases, however, the
receptor initiates one or more sequences of biochemical
reactions that connect the stimulus to a cellular
response. Such a sequence of reactions is called a signal
transduction pathway. Typically, the end result of sig-
nal transduction pathways is to regulate transcription
factors, which in turn regulate gene expression.
Signal transduction pathways often involve the gen-
eration of second messengers, transient secondary sig-
nals inside the cell that greatly amplify the original sig-
nal. For example, a single hormone molecule might lead
to the activation of an enzyme that produces hundreds
of molecules of a second messenger. Among the most
common second messengers are 3′,5′-cyclic AMP
(cAMP); 3′,5′-cyclic GMP (cGMP); nitric oxide (NO);
cyclic ADP-ribose (cADPR); 1,2-diacylglycerol (DAG);
inositol 1,4,5-trisphosphate (IP
3
); and Ca
2+
(Figure 14.13).
Hormone binding normally causes elevated levels of
one or more of these second messengers, resulting in the
activation or inactivation of enzymes or regulatory pro-
teins. Protein kinases and phosphatases are nearly
always involved.
Most Steroid Receptors Act as Transcription
Factors
The steroid hormones, thyroid hormones, retinoids, and
vitamin D all pass freely across the plasma membrane
because of their hydrophobic nature and they bind to
intracellular receptor proteins. When activated by bind-
ing to their ligand, these proteins function as transcrip-
tion factors. All such steroid receptor proteins have sim-
ilar DNA-binding domains. Steroid response elements
are typically located in enhancer regions of steroid-stim-
ulated genes. Most steroid receptors are localized in the
nucleus, where they are anchored to nuclear proteins in
an inactive form.
When the receptor binds to the steroid, it is released
from the anchor protein and becomes activated as a
transcription factor. The activated transcription factor
then binds to the enhancer and stimulates transcription.
The receptor for thyroid hormone deviates from this
pattern in that it is already bound to the DNA but is
unable to stimulate transcription in the absence of the
hormone. Binding to the hormone converts the receptor
to an active transcription factor.
Not all intracellular steroid receptors are localized in
the nucleus. The receptor for glucocorticoid hormone
(cortisol) differs from the others in that it is located in
the cytosol, anchored in an inactive state to a cytosolic
protein. Binding of the hormone causes the release of
the receptor from its cytosolic anchor, and the recep-
tor–hormone complex then migrates into the nucleus,
where it binds to the enhancer and stimulates tran-
scription (Figure 14.14).
Although most studies on animal steroid hormones
Gene Expression and Signal Transduction
15
have focused on their roles in regulating gene expres-
sion via receptors that act as transcription factors,
increasing evidence suggests that steroids can also inter-
act with proteins on the cell surface (McEwen 1991). As
will be discussed in Chapter 17, brassinosteroid has
recently been demonstrated to be an authentic steroid
hormone in plants, and the gene for a brassinosteroid
receptor has recently been cloned and sequenced. It
encodes a type of transmembrane receptor called a
leucine-rich repeat receptor, which is described at the end
of this chapter.
Cell Surface Receptors Can Interact with
G Proteins
All water-soluble mammalian hormones bind to cell
surface receptors. Members of the largest class of mam-
malian cell surface receptors interact with signal-trans-
ducing, GTP-binding regulatory proteins called het-
erotrimeric G proteins. The activated G proteins, in
turn, activate an effector enzyme. The activated effector
enzyme generates an intracellular second messenger,
which stimulates a variety of cellular processes.
Receptors using heterotrimeric G proteins are struc-
turally similar and functionally diverse. Their overall
structure is similar to that of bacteriorhodopsin, the pur-
ple pigment involved in photosynthesis in bacteria of
the genus Halobacterium, and to that of rhodopsin, the
visual pigment of the vertebrate eye. The recently char-
acterized olfactory receptors of the vertebrate nose also
belong to this group. The receptor proteins consist of
seven transmembrane a helices (Figure 14.15). These
receptors are sometimes referred to as seven-spanning,
seven-pass, or serpentine receptors.
Heterotrimeric G Proteins Cycle between Active
and Inactive Forms
The G proteins that transduce the signals from the
seven-spanning receptors are called heterotrimeric G pro-
teins because they are composed of three different sub-
units: α, β, and γ (gamma). They are distinct from the
monomeric G proteins, which will be discussed later.
Heterotrimeric G proteins cycle between active and
inactive forms, thus acting as molecular switches. The β
and γ subunits form a tight complex that anchors the
trimeric G protein to the membrane on the cytoplasmic
side (Figure 14.16). The G protein becomes activated
upon binding to the ligand-activated seven-spanning
receptor. In its inactive form, G exists as a trimer with
GDP bound to the α subunit. Binding to the
receptor–ligand complex induces the α subunit to
exchange GDP for GTP. This exchange causes the α sub-
unit to dissociate from β and γ, allowing α to associate
instead with an effector enzyme.
The α subunit has a GTPase activity that is activated
when it binds to the effector enzyme, in this case adeny-
lyl cyclase (also called adenylate cyclase) (see Figure
14.16). GTP is hydrolyzed to GDP, thereby inactivating
the α subunit, which in turn inactivates adenylyl
CHAPTER 14
16
N
N
N
N
O
OP
–
OOH
CH
2
NH
2
O
O
3′,5′-Cyclic AMP
2′
1′4′
3′
5′
N
N
N
N
O
OOH
CH
2
NH
2
3′,5′-Cyclic GMP
2′
1′4′
3′
5′
O
CH
3
C(CH
2
)
n
CH
2
O
CH
3
C(CH
2
)
n
O
1
CH
2
CH
2
OH
3
Fatty acyl groups
Glycerol
O
O
1,2-Diacylglycerol
Inositol
1,4,5-trisphosphate
Calcium ion
PO
3
2–
O
OH
OH HO
3
41
2
5
6
OPO
3
2–
OPO
3
2–
Ca
2+
N
O
HO OH
Cyclic ADP-Ribose (cADPR)
H
H
H
CH
2
C
N
C
H
N
HC
N
C
C
NH
H
O
OH
H
HH
HO
H
CH
2
O
O
P
O
P
HO
O
O
HO
N
O
Nitric oxide
P
–
O
O
O
Figure 14.13 Structure of seven eukaryotic second messengers.
cyclase. The α subunit bound to GDP reassociates with
the β and γ subunits and can then be reactivated by
associating with the hormone–receptor complex.
Activation of Adenylyl Cyclase Increases the
Level of Cyclic AMP
Cyclic AMP is an important signaling molecule in both
prokaryotes and animal cells, and increasing evidence
suggests that cAMP plays a similar role in plant cells.
In vertebrates, adenylyl cyclase is an integral mem-
brane protein that contains two clusters of six mem-
brane-spanning domains separating two catalytic
domains that extend into the cytoplasm. Activation of
adenylyl cyclase by heterotrimeric G proteins raises the
concentration of cAMP in the cell, which is normally
maintained at a low level by the action of cyclic AMP
phosphodiesterase, which hydrolyzes cAMP to 5′-
AMP.
Nearly all the effects of cAMP in animal cells are
mediated by the enzyme protein kinase A (PKA). In
unstimulated cells, PKA is in the inactive state because
of the presence of a pair of inhibitory subunits. Cyclic
AMP binds to these inhibitory subunits, causing them
to dissociate from the two catalytic subunits, thereby
activating the catalytic subunits. The activated catalytic
subunits then are able to phosphorylate specific serine
or threonine residues of selected proteins, which may
also be protein kinases. An example of an enzyme that
is phosphorylated by PKA is glycogen phosphorylase
kinase. When phosphorylated by PKA, glycogen phos-
phorylase kinase phosphorylates (activates) glycogen
phosphorylase, the enzyme that breaks down glycogen in
muscle cells to glucose-1-phosphate.
In cells in which cAMP regulates gene expression,
PKA phosphorylates a transcription factor called CREB
(cyclic AMP response element–binding protein). Upon
activation by PKA, CREB binds to the cAMP response
element (CRE), which is located in the promoter regions
of genes that are regulated by cAMP.
In addition to activating PKA, cAMP can interact
with specific cAMP-gated cation channels. For example,
in olfactory receptor neurons, cAMP binds to and opens
Na
+
channels on the plasma membrane, resulting in Na
+
influx and membrane depolarization.
Because of the extremely low levels of cyclic AMP
that have been detected in plant tissue extracts, the role
of cAMP in plant signal transduction has been highly
controversial (Assmann 1995). Nevertheless, various
lines of evidence supporting a role of cAMP in plant
cells have accumulated. For example, genes that encode
homologs of CREB have been identified in plants (Kate-
giri et al. 1989). Pollen tube growth in lily has been
shown to be stimulated by concentrations of cAMP as
low as 10 nM (Tezuka et al. 1993). Li and colleagues
(1994) showed that cAMP activates K
+
channels in the
plasma membrane of fava bean (Vicia faba) mesophyll
cells. And Ichikawa and coworkers (1997) recently iden-
tified possible genes for adenylyl cyclase in tobacco
(Nicotiana tabacum) and Arabidopsis. Thus, despite years
of doubt, the role of cAMP as a universal signaling agent
in living organisms, including plants, seems likely.
Gene Expression and Signal Transduction
17
+
+
+
EXTRACELLULAR
SPACE
CYTOSOL
NUCLEUS
Plasma
membrane
Steroid
hormone
+
+
+
Receptor
Inhibitory
protein
Hormone–
receptor
complex
DNA-binding
site
Gene
activation
site
Inhibitor
Enhancer region
mRNA
+
+
+
Coding region
DNA
4
5
6
3
2
1
Figure 14.14 Glucocorticoid steroid receptors are transcrip-
tion factors. (1) Glucocorticoid hormone is lipophilic and
diffuses readily through the membrane to the cytosol. (2)
Once in the cytosol, the hormone binds to its cytosolic
receptor, (3) causing the release of an inhibitory protein
from the receptor. (4) The activated receptor then diffuses
into the nucleus. (5) In the nucleus, the receptor–hormone
complex binds to the enhancer regions of steroid-regulated
genes. (6) Transcription of the genes is stimulated. (From
Becker et al. 1996.)
Activation of Phospholipase C Initiates the
IP
3
Pathway
Calcium serves as a second messenger for a wide vari-
ety of cell signaling events. This role of calcium is well
established in animal cells, and as we will see in later
chapters, circumstantial evidence suggests a role for cal-
cium in signal transduction in plants as well. The con-
centration of free Ca
2+
in the cytosol normally is main-
tained at extremely low levels (1 × 10
–7
M). Ca
2+
-
ATPases on the plasma membrane and on the endo-
plasmic reticulum pump calcium ions out of the cell and
into the lumen of the ER, respectively. In plant cells,
most of the calcium of the cell accumulates in the vac-
uole. The proton electrochemical gradient across the
vacuolar membrane that is generated by tonoplast pro-
ton pumps drives calcium uptake via Ca
2+
–H
+
anti-
porters (see Chapter 6).
In animal cells, certain hormones can induce a tran-
sient rise in the cytosolic Ca
2+
concentration to about 5
× 10
–6
M. This increase may occur even in the absence of
extracellular calcium, indicating that the Ca
2+
is being
released from intracellular compartments by the open-
ing of intracellular calcium channels. However, the cou-
pling of hormone binding to the opening of intracellu-
lar calcium channels is mediated by yet another second
messenger, inositol trisphosphate (IP
3
).
Phosphatidylinositol (PI) is a minor phospholipid
component of cell membranes (see Chapter 11). PI can
be converted to the polyphosphoinositides PI phosphate
(PIP) and PI bisphosphate (PIP
2
) by kinases (Figure
14.17). Although PIP
2
is even less abundant in the mem-
brane than PI is, it plays a central role in signal trans-
duction. In animal cells, binding of a hormone, such as
vasopressin, to its receptor leads to the activation of het-
erotrimeric G proteins. The α subunit then dissociates
from G and activates a phosphoinositide-specific phos-
pholipase, phospholipase C (PLC). The activated PLC
rapidly hydrolyzes PIP
2
, generating inositol trisphos-
phate (IP
3
) and diacylglycerol (DAG) as products. Each
of these two molecules plays an important role in cell
signaling.
IP
3
Opens Calcium Channels on the ER and on the
Tonoplast
The IP
3
generated by the activated phospholipase C is
water soluble and diffuses through the cytosol until it
encounters IP
3
-binding sites on the ER and (in plants) on
the tonoplast. These binding sites are IP
3
-gated Ca
2+
channels that open when they bind IP
3
(Figure 14.18).
Since these organelles maintain internal Ca
2+
concen-
trations in the millimolar range, calcium diffuses rapidly
into the cytosol down a steep concentration gradient.
The response is terminated when IP
3
is broken down by
specific phosphatases or when the released calcium is
pumped out of the cytoplasm by Ca
2+
-ATPases.
Studies with Ca
2+
-sensitive fluorescent indicators,
such as fura-2 and aequorin, have shown that the cal-
cium signal often originates in a localized region of the
cell and propagates as a wave throughout the cytosol.
Repeated waves called calcium oscillations can follow the
original signal, each lasting from a few seconds to sev-
eral minutes. The biological significance of calcium
oscillation is still unclear, although it has been suggested
that it is a mechanism for avoiding the toxicity that
might result from a sustained elevation in cytosolic lev-
els of free calcium. Such wavelike oscillations have
recently been detected in plant stomatal guard cells
(McAinsh et al. 1995).
Cyclic ADP-Ribose Mediates Intracellular Ca
2
+
Release Independently of IP
3
Signaling
Cyclic ADP-Ribose (cADPR) acts as a second messenger
CHAPTER 14
18
NH
2
NH
2
COOH
COOH
CYTOSOL
EXTRACELLULAR
SPACE
Ligand-binding
domain
(A) (B)
G protein–
binding domains
G protein–
binding domain
s
Plasma
membrane
Ligand-binding domains
Figure 14.15 Schematic draw-
ing of two types of seven-
spanning receptors. (A) Large
extracellular ligand-binding
domains are characteristic of
seven-spanning receptors that
bind proteins. The region of
the intracellular domain that
interacts with the hetero-
trimeric G protein is indicated.
(B) Small extracellular domains
are characteristic of seven-
spanning receptors that bind
to small ligands such as epi-
nephrine. The ligand-binding
site is usually formed by sev-
eral of the transmembrane
helices within the bilayer.
(After Alberts et al. 1994.)
that can release calcium from intracellular stores, inde-
pendent of the IP
3
signaling pathway. Like cAMP,
cADPR is a cyclic nucleotide, but whereas cAMP brings
about its effects by activating protein kinase A, cADPR
binds to and activates specific calcium channels, called
type-3 ryanodine receptors (ryanodine is a calcium
channel blocker). These ryanodine receptor/calcium
channels are located on the membranes of calcium-stor-
ing organelles, such as sarcoplasmic reticulum of animal
cells or the vacuoles of plant cells. By stimulating the
release of calcium into the cytosol, cADPR helps to reg-
ulate calcium oscillations that bring about physiological
effects. Abscisic acid-induced stomatal closure is an
example of the roles of cADPR and calcium oscillations
in plants (see Chapter 23).
Some Protein Kinases Are Activated by
Calcium–Calmodulin Complexes
As we have seen with IP
3
-gated channels, calcium can
activate some proteins, such as channels, by binding
directly to them. However, most of the effects of calcium
result from the binding of calcium to the regulatory pro-
tein calmodulin (Figure 14.19). Calmodulin is a highly
conserved protein that is abundant in all eukaryotic
cells, but it appears to be absent from prokaryotic cells.
The same calcium-binding site is found in a wide vari-
ety of calcium-binding proteins and is called an EF
hand. The name is derived from the two α helices, E and
F, that are part of the calcium-binding domain of the
protein parvalbumin (Kretsinger 1980).
Each calmodulin molecule binds four Ca
2+
ions and
changes conformation, enabling it to bind to and acti-
vate other proteins. The Ca
2+
–calmodulin complex can
stimulate some enzymes directly, such as the plasma
membrane Ca
2+
-ATPase, which pumps calcium out of
the cell. Most of the effects of calcium, however, are
brought about by activation of Ca
2+
–calmodulin-depen-
dent protein kinases (CaM kinases). CaM kinases
phosphorylate serine or threonine residues of their tar-
get enzymes, causing enzyme activation. Thus, the effect
Gene Expression and Signal Transduction
19
GDP
Receptor
protein
Hormone
Heterotrimeric
G protein
Adenylyl
cyclase
R
C
γ
β
α
R
C
γ
β
α
R
C
γ
β
α
R
C
γ
β
α
R
C
γ
β
α
R
C
γ
β
α
Binding of hormone
produces conformational
change in receptor
Binding of hormone
produces conformational
change in recepto
1
GDP
Receptor binds to G
protein
GDP
GDP
GTP
GDP bound to G protein
is replaced by GTP, and
subunits of G protein
dissociate
3
GTP
α Subunit binds to adenylyl
cyclase, activating synthesis
of cAMP; hormone tends to
dissociate
GTP
GDP
ATP cAMP + PP
i
EXTRACELLULAR
SPACE
CYTOSOL
Plasma
membrane
P
i
Hydrolysis of GTP to GDP
causes α subunit to
dissociate from adenylyl
cyclase and bind to β–γ,
regenerating a conformation
of G protein that can be
activated by a receptor–
hormone complex
2
4
5
Figure 14.16 Hormone-induced activation of an effector
enzyme is mediated by the
α subunit of a heterotrimeric G
protein. (1) Upon binding to its hormonal ligand, the seven-
spanning receptor undergoes a conformational change. (2)
The receptor binds to the heterotrimeric G protein. (3)
Contact with the receptor induces the
α subunit of the het-
erotrimeric G protein to exchange GDP for GTP, and the
α
subunit then dissociates from the complex. (4) The G pro-
tein
α subunit associates with the effector protein (adenylyl
cyclase) in the membrane, causing its activation. At the
same time the hormone is released from its receptor. (5)
The effector enzyme becomes inactivated when GTP is
hydrolyzed to GDP. The
α subunit then reassociates with
the heterotrimeric G protein and is ready to be reactivated
by a second hormonal stimulus. (From Lodish et al. 1995.)
that calcium has on a particular cell depends to a large
extent on which CaM kinases are expressed in that cell.
Calcium signaling has been strongly implicated in
many developmental processes in plants, ranging from
the regulation of development by phytochrome (see
Chapter 17) to the regulation of stomatal guard cells by
abscisic acid (see Chapter 23). Thus far, however, there
have been few reports of CaM kinase activity in plants.
Recently, however, a gene that codes for a CaM kinase
has been cloned from lily and shown to be specifically
expressed in anthers. The lily CaM kinase is a
serine/threonine kinase that phosphorylates various
protein substrates in vitro in a Ca
2+
–calmodulin-depen-
dent manner (Takezawa et al. 1996). The occurrence and
regulatory roles of such plant CaM kinases remain to be
determined.
Plants Contain Calcium-Dependent Protein Kinases
The most abundant calcium-regulated protein kinases
in plants appear to be the calcium-dependent protein
kinases (CDPKs) (Harper et al. 1991; Roberts and Har-
mon 1992). CDPKs are strongly activated by calcium,
but are insensitive to calmodulin. The proteins are char-
acterized by two domains: a catalytic domain that is
similar to those of the animal CaM kinases, and a
calmodulin-like domain. The presence of a calmodulin-
like domain may explain why the enzyme does not
require calmodulin for activity.
CDPKs are widespread in plants and are encoded by
multigene families. A CDPK has also been identified in
Chara, the giant freshwater green alga thought to be a
precursor of land plants (McCurdy and Harmon 1992).
In Chara the enzyme was shown to be associated with
the actin microfilaments that line the outer cortex of the
cytoplasm along the inner surface of the plasma mem-
brane. The function of these microfilaments is to drive
cytoplasmic streaming around the cell. The rate of cyto-
plasmic streaming is inhibited by increases in cytosolic
CHAPTER 14
20
Phosphatidylinositol (Pl)
Pl 4-phosphate (PIP)
Pl 4,5-bisphosphate (PIP
2
)
P
O
–
O
O
–
O
CH
2
CH
2
CH
P
O
O
O
–
O
OH
OH HO
O
O
C COO
P
O
–
O
–
O
P
O
–
O
–
O
CH
2
CH
2
CH
OH
O
O
C COO
CH
2
CH
2
CH
P
O
O
O
–
O
OH
OH HO
O
O
C COO
3
41
2
5
6
OH
OH OH
Inositol
O
CH
2
CH
2
CH
P
O
O
O
–
O
OH
OH HO
O
O
C COO
P
O
O
–
O
–
O
Activates
protein
kinase C
Releases Ca
2+
from the
endoplasmic
reticulum and
vacuole
ADP
PI kinase
ATP ADP
PIP kinase
ATP
Phospholipase C
(PLC)
Diacylglycerol
(DAG)
Inositol 1,4,5-trisphosphate (IP
3
)
O
P
O
O
O
–
O
OH
OH HO
P
O
O
O
–
O
CYTOSOL
Fatty acid chains of outer
lipid monolayer of plasma membrane
Fatty acid
chains of
inner lipid
monolayer
of plasma
membrane
Figure 14.17 Phospholipase C pathway of membrane hydrolysis. The rare
phospholipid phosphatidylinositol (PI) is the starting point for the pathway.
The phosphoinositol head group of PI is phosphorylated twice, producing
first PI 4-phosphate (PIP) and then PI 4,5-bisphosphate (PIP
2
). PIP
2
is then
hydrolyzed by phospholipase C to diacylglycerol (DAG) and inositol 1,4,5-
trisphosphate (IP
3
). (After Alberts et al. 1994.)
Gene Expression and Signal Transduction
21
Cellular
response
EXTRACELLULAR
SPACE
CYTOSOL
Hormone
Receptor
G protein
Phospholipase C
Gβγ Gα
P
P
P
P
P
Protein
(inactive)
Cellular
response
Protein
kinase
C
DAG
PIP
2
IP
3
Protein
(active)
Ca
2+
IP
3
-sensitive
Ca
2+
channel
Endoplasmic
reticulum
or vacuole
P
P
Plasma
membrane
Ca
2+
Bound IP
3
Figure 14.18 Summary diagram of the
events in the inositol–lipid signal trans-
duction pathway coupled to seven-
spanning G protein–linked receptors.
The binding of hormone to its receptor
triggers activation of the
α subunit of
the heterotrimeric G protein, which
activates the effector enzyme phos-
pholipase C (PLC). PLC cleaves PIP
2
in
the membrane to yield IP
3
and DAG.
IP
3
diffuses into the cytosol and binds
to IP
3
-gated calcium channels on the
ER or vacuolar membrane, causing the
release of calcium into the cytosol
from intracellular stores. The increase
in cytosolic calcium concentration leads
to a cellular response. DAG remains in
the membrane and activates protein
kinase C. The activated protein kinase
C then phosphorylates other proteins,
leading to a cellular response. In ani-
mal cells the inositol–lipid pathway
may also be coupled to receptor tyro-
sine kinases. (From Lodish et al. 1995.)
COOH
COOH
COOH
2 nm
HOOC
NH
2
H
2
N
Ca
2+
H
2
N
H
2
N
(A) (B)
Figure 14.19 Structure of calmodulin. (A) Calmodulin con-
sists of two globular ends separated by a flexible
α helix.
Each globular end has two calcium-binding sites. (B) When
the calcium–calmodulin complex associates with a protein,
it literally wraps around it. (From Alberts et al. 1994.)
calcium, and it has been proposed that CDPKs mediate
the effects of calcium by phosphorylating the heavy
chain of myosin, a component of the microfilaments
(McCurdy and Harmon 1992).
CDPKs may also mediate the effects of calcium in
guard cells. Abscisic acid–induced stomatal closure
involves calcium as a second messenger (see Chapter
23). Recent studies using isolated vacuoles from guard
cells of Vicia faba (fava bean) suggest that CDPKs can
regulate anion channels on the tonoplast (Pei et al. 1996).
Thus, CDPKs may be a component of the abscisic acid
signaling pathway.
Diacylglycerol Activates Protein Kinase C
Cleavage of PIP
2
by phospholipase C produces diacyl-
gycerol (DAG) in addition to IP
3
(see Figure 14.17).
Whereas IP
3
is hydrophilic and diffuses rapidly into the
cytoplasm, DAG is a lipid and remains in the mem-
brane. In animal cells, DAG can associate with and acti-
vate the serine/threonine kinase protein kinase C
(PKC). The inactive form of PKC is a soluble enzyme
that is located in the cytosol. Upon binding to calcium,
the soluble, inactive PKC undergoes a conformational
change and associates with a PKC receptor protein that
transports it to the inner surface of the plasma mem-
brane, where it encounters DAG.
PKCs have been shown to phosphorylate ion chan-
nels, transcription factors, and enzymes in animal cells.
One of the enzymes phosphorylated by PKC is another
protein kinase that regulates cell proliferation and dif-
ferentiation, MAP kinase kinase kinase (discussed later in
the chapter). G proteins, phospholipase C, and various
protein kinases have been identified in plant mem-
branes (Millner and Causier 1996). PKC activity has also
been detected in plants (Elliott and Kokke 1987; Chen et
al. 1996), and a plant gene encoding the PKC receptor
protein that transports the soluble enzyme to the mem-
brane has recently been cloned (Kwak et al. 1997). How-
ever, there is as yet no evidence that activation of PKC
by DAG plays a role in plant signal transduction.
Phospholipase A
2
Generates Other Membrane-
Derived Signaling Agents
In animals, the endocrine system is involved in signal-
ing between hormone-producing cells at one location of
the body and hormone-responding cells at another loca-
tion; in contrast, the autocrine system involves cells
sending signals to themselves and their immediate
neighbors. One type of autocrine signaling system that
plays important roles in pain and inflammatory re-
sponses, as well as platelet aggregation and smooth-
muscle contraction, is called the eicosanoid pathway.
There are four major classes of eicosanoids:
prostaglandins, prostacyclins, thromboxanes, and leuko-
CHAPTER 14
22
OH
COOH
COOH
O
COOH
CCH
OH
Oxidation steps
O
O
PO XO
O
O
–
CCH
2
O
O
CH
2
Phospholipase A
2
Membrane
phospholipid
Arachidonic acid
(20 carbons),
extended conformation
Arachidonic acid,
folded conformation
Prostaglandin
(A)
(B)
Arachidonic acid
Cyclooxygenase-
dependent
pathway
Lipoxygenase-
dependent
pathway
Prostaglandins
Prostacyclins
Thromboxanes
Leukotrienes
Figure 14.20 Eicosanoid biosynthetic pathway. (A) The first
step is the hydrolysis of 20-carbon fatty acid chains contain-
ing at least three double bonds from a membrane phos-
pholipid by the enzyme phospholipase A
2
, producing
arachidonic acid, which can be oxidized by prostaglandin.
(B) Arachidonic acid is further metabolized by two path-
ways: one cyclooxygenase dependent, the other lipoxyge-
nase dependent. (From Alberts et al. 1994.)
trienes. All are derived from the breakdown of mem-
brane phospholipids, and in this respect the eicosanoid
pathway resembles the IP
3
pathway. There the resem-
blance ends, however. For whereas the IP
3
pathway
begins with the cleavage of IP
3
from PIP
2
by phospholi-
pase C, the eicosanoid pathway is initiated by the cleav-
age of the 20-carbon fatty acid arachidonic acid from the
intact phospholipid by the enzyme phospholipase A
2
(PLA
2
) (Figure 14.20A). Two oxidative pathways—one
cyclooxygenase dependent, the other lipoxygenase
dependent—then convert arachidonic acid to the four
eicosanoids (Figure 14.20B). As we will see in Chapter
19, there is some indirect evidence for the possible
involvement of prostaglandins in the regulation of the
plant cell cycle, although direct evidence is lacking.
Higher plants generally have negligible amounts of
arachidonic acid in their membranes, although the level
is higher in certain mosses.
In addition to generating arachidonic acid, PLA
2
pro-
duces lysophosphatidylcholine (LPC) as a breakdown
product of phosphatidylcholine. LPC has detergent
properties, and it has been shown to regulate ion chan-
nels through its effects on protein kinases. For example,
LPC has been shown to modulate the sodium currents
in cardiac-muscle cells by signal transduction pathways
that involve the activation of both protein kinase C and
a tyrosine kinase (Watson and Gold 1997). Protein
kinase C is activated by LPC independently of the phos-
pholipase C pathway.
In recent years plant biologists have become increas-
ingly interested in the eicosanoid pathway because it
now appears that an important signaling agent in plant
defense responses, jasmonic acid, is produced by a sim-
ilar pathway, which was described in Chapter 13. In
addition, LPC has been shown to activate plant protein
kinases in vitro. As we will see in Chapter 19, LPC is one
of many candidates for a second messenger in the rapid
responses of plant cells to auxin.
In Vertebrate Vision, a Heterotrimeric G Protein
Activates Cyclic GMP Phosphodiesterase
The human eye contains two types of photoreceptor
cells: rods and cones. Rods are responsible for mono-
chromatic vision in dim light; cones are involved in
color vision in bright light. Signal transduction in
response to light has been studied more intensively in
rods. The rod is a highly specialized tubular cell that
contains an elongated stack of densely packed mem-
brane sacs called discs at the tip, or outer segment,
reminiscent of the grana stacks of chloroplasts. The disc
membranes of rod cells contain the photosensitive pro-
tein pigment rhodopsin, a member of the seven-span-
ning transmembrane family of receptors. Rhodopsin
consists of the protein opsin covalently bound to the
light-absorbing molecule 11-cis-retinal. When 11-cis-reti-
nal absorbs a single photon of light (400 to 600 nm) it
immediately isomerizes to all-trans-retinal (Figure
14.21). This change causes a slower conformational
change in the protein, converting it to meta-rhodopsin II,
or activated opsin.
Gene Expression and Signal Transduction
23
CH
3
CH
3
CH
3
C
O
H
H
3
C
H
3
C
(CH
2
)
4
+ H
2
N+ H
2
OCR
H
H
N
+
(CH
2
)
4
CH
3
CH
3
CH
3
H
3
C CH
3
1
4
2
3
6
810
11
12
13
14
15
7
9
5
cis double
bond
Lysine side chain
on opsin
cis-Retinal moiety
trans-Retinal portion
of rhodopsin
trans double bond
11-cis-Retinal
Opsin
Rhodopsin
Opsin
Opsin
CN
Opsin
15
Meta-rhodopsin II
(activated opsin)
Transducin
(CH
2
)
4
Light-induced
isomerization
H
+
Figure 14.21 Transduction of the light sig-
nal in vertebrate vision. The photoreceptor
pigment is rhodopsin, a transmembrane
protein composed of the protein opsin and
the chromophore 11-
cis-retinal. Light
absorption causes the rapid isomerization
of
cis-retinal to trans-retinal. The formation
of
trans-retinal then causes a conforma-
tional change in the protein opsin, forming
meta-rhodopsin II, the activated form of
opsin. The activated opsin then interacts
with the heterotrimeric G protein trans-
ducin. (After Lodish et al. 1995.)
Activated opsin, in turn, lowers the concentration of
the cyclic nucleotide 3′5′-cGMP. Cyclic GMP is synthe-
sized from GTP by the enzyme guanylate cyclase. In the
dark, guanylate cyclase activity results in the buildup of
a high concentration of cGMP in the rod cells. Because
the plasma membrane contains cGMP-gated Na
+
chan-
nels, the high cGMP concentration in the cytosol main-
tains the Na
+
channels in the open position in the
absence of light. When the Na
+
channels are open, Na
+
can enter the cell freely, and this passage of Na
+
tends to
depolarize the membrane potential.
When opsin becomes activated by light, however, it
binds to the heterotrimeric G protein transducin. This
binding causes the α subunit of transducin to exchange
GDP for GTP and dissociate from the complex. The α
subunit of transducin then activates the enzyme cyclic
GMP phosphodiesterase, which breaks down 3′5′-cGMP
to 5′-GMP (Figure 14.22). Light therefore has the effect
of decreasing the concentration of cGMP in the rod cell.
A lower concentration of cGMP has the effect of closing
the cGMP-gated Na
+
channels on the plasma mem-
brane, which are kept open in the dark by a high cGMP
concentration. To give some idea of the signal amplifi-
cation provided, a single photon may cause the closure
of hundreds of Na
+
channels, blocking the uptake of
about 10 million Na
+
ions.
By preventing the influx of Na
+
, which tends to
depolarize the membrane, the membrane polarity
increases—that is, becomes hyperpolarized. In this way
a light signal is converted into an electric signal. Mem-
brane hyperpolarization, in turn, inhibits neurotrans-
mitter release from the synaptic body of the rod cell.
Paradoxically, the nervous system detects light as an
inhibition rather than a stimulation of neurotransmitter
release.
Cyclic GMP, which regulates ion channels and pro-
tein kinases in animal cells, appears to be an important
regulatory molecule in plant cells as well. Cyclic GMP
has been definitively identified in plant extracts by gas
chromatography combined with mass spectrometry
(Janistyn 1983; Newton and Brown 1992). Moreover,
cGMP has been implicated as a second messenger in the
responses of phytochrome (see Chapter 17) and gib-
berellin (see Chapter 20).
Nitric Oxide Gas Stimulates the Synthesis of cGMP
The level of 3′,5′-cyclic GMP in cells is controlled by the
balance between the rate of cGMP synthesis by the
enzyme, guanylyl (or guanylate) cyclase, and the rate of
cGMP degradation by the enzyme cGMP phosphodi-
esterase. We have seen how light activation of
rhodopsin leads to the activation of cGMP phosphodi-
esterase in vertebrate rod cells, resulting in a reduction
in cGMP. In smooth muscle tissue of animal cells, cGMP
levels can be increased via the direct activation of
guanylyl cyclase by the signaling intermediate, nitric
CHAPTER 14
24
Depolarization of
plasma membrane
Opens Na
+
channels
Increase in
cytosolic Ca
2+
Hyperpolarization o
f
plasma membrane
Decrease in
cytosolic Ca
2+
Opens Ca
2+
channels
Closes Na
+
channels
Closes Ca
2+
channels
cGMP
(active)
GTP
Stimulates
5′-GMP
(inactive)
Guanylate
cyclase
cGMP phosphodiesterase
(active)
Activated transducin
High Ca
2+
inhibits Low Ca
2+
stimulates
Ca
2+
-sensing
protein
Figure 14.22 The role of cyclic GMP (cGMP) and calcium as
second messengers in vertebrate vision. Activation of the
heterotrimeric G protein transducin by activated opsin
causes the activation of cGMP phosphodiesterase, which
lowers the concentration of cGMP in the cell. The reduction
in cGMP closes cGMP-activated Na
+
channels. Closure of the
Na
+
channels blocks the influx of Na
+
, causing membrane
hyperpolarization. Cyclic GMP also regulates calcium chan-
nels. When the cGMP concentration in the cell is high, the
calcium channels open, raising the cytosolic calcium concen-
tration. Guanylate cyclase, the enzyme that synthesizes
cGMP from GTP, is inhibited by high levels of calcium.
Conversely, when cGMP levels are low, closure of calcium
channels lowers the cytosolic calcium concentration. This
lowering of the calcium concentration stimulates guanylate
cyclase. Calcium thus provides a feedback system for regu-
lating cGMP levels in the cell.
oxide (NO). NO is synthesized from arginine by the
enzyme, NO synthase, in a reaction involving oxygen:
NO synthase
Arginine + O2→Citrulline + NO
Once produced in animal endothelial cells, dissolved
NO passes rapidly across membranes and acts locally
on neighboring smooth muscle cells, with a half-life of
5–10 seconds. Guanylyl cyclase contains a heme group
that binds NO tightly, and binding of NO causes a con-
formational change which activates the enzyme. The
NO-induced increase in cGMP causes smooth muscle
cells to relax. Nitroglycerine, which can be metabolized
to yield NO, has long been administered to heart
patients to prevent the coronary artery spasms respon-
sible for variant angina. In plants, NO has recently been
implicated as an intermediate in ABA-induced stomatal
closure (see Chapter 23).
Cell Surface Receptors May Have Catalytic Activity
Some cell surface receptors are enzymes themselves or
are directly associated with enzymes. Unlike the seven-
spanning receptors, the catalytic receptors, as these
enzyme or enzyme-associated receptors are called, are
typically attached to the membrane via a single trans-
membrane helix and do not interact with heterotrimeric
G proteins. The six main categories of catalytic receptors
in animals include: (1) receptor tyrosine kinases, (2)
receptor tyrosine phosphatases, (3) receptor serine/thre-
onine kinases, (4) tyrosine kinase–linked receptors, (5)
receptor guanylate cyclases, and (6) cell surface pro-
teases. Of these, the receptor tyrosine kinases are prob-
ably the most abundant in animal cells.
Thus far, no receptor tyrosine kinases (RTKs) have
been identified in plants. However, plant cells do con-
tain a class of receptors called receptorlike kinases
(RLKs) that are structurally similar to the animal RTKs.
In addition, some of the components of the RTK signal-
ing pathway of animals have been identified in plants.
After first reviewing the animal RTK pathway, we will
examine the RLK receptors of plants.
Ligand Binding to Receptor Tyrosine Kinases
Induces Autophosphorylation
The receptor tyrosine kinases (RTKs) make up the most
important class of enzyme-linked cell surface receptors
in animal cells, although so far they have not been
found in either plants or fungi. Their ligands are soluble
or membrane-bound peptide or protein hormones,
including insulin, epidermal growth factor (EGF),
platelet-derived growth factor (PDGF), and several
other protein growth factors.
Since the transmembrane domain that separates the
hormone-binding site on the outer surface of the mem-
brane from the catalytic site on the cytoplasmic surface
consists of only a single α helix, the hormone cannot
transmit a signal directly to the cytosolic side of the
membrane via a conformational change. Rather, bind-
ing of the ligand to its receptor induces dimerization of
adjacent receptors, which allows the two catalytic
domains to come into contact and phosphorylate each
other on multiple tyrosine residues (autophosphoryla-
tion) (Figure 14.23). Dimerization may be a general
mechanism for activating cell surface receptors that con-
tain single transmembrane domains.
Intracellular Signaling Proteins That Bind to RTKs
Are Activated by Phosphorylation
Once autophosphorylated, the catalytic site of the RTKs
binds to a variety of cytosolic signaling proteins. After
binding to the RTK, the inactive signaling protein is itself
phosphorylated on specific tyrosine residues. Some tran-
scription factors are activated in this way, after which
they migrate to the nucleus and stimulate gene expres-
sion directly. Other signaling molecules take part in a sig-
naling cascade that ultimately results in the activation of
transcription factors. The signaling cascade initiated by
RTKs begins with the small, monomeric G protein Ras.
The Ras superfamily. In addition to possessing het-
erotrimeric G proteins, eukaryotic cells contain small
monomeric G proteins that are related to the α sub-
units of the heterotrimeric G proteins. The three fami-
lies, Ras, Rab, and Rho/Rac, all belong to the Ras
superfamily of monomeric GTPases. Rho and Rac
relay signals from surface receptors to the actin cyto-
skeleton; members of the Rab family of GTPases are
involved in regulating intracellular membrane vesicle
traffic; the Ras proteins, which are located on the inner
surface of the membrane, play a crucial role in initiat-
ing the kinase cascade that relays signals from RTKs to
the nucleus.
The RAS gene was originally discovered as a viral
oncogene (cancer-causing gene) and was later shown to
be present as a normal gene in animal cells. Ras is a G
protein that cycles between an inactive GDP-binding
form and an active GTP-binding form. Ras also pos-
sesses GTPase activity that hydrolyzes bound GTP to
GDP, thus terminating the response. The RAS oncogene
is a mutant form of the protein that is unable to
hydrolyze GTP. As a result, the molecular switch remains
in the on position, triggering uncontrolled cell division.
The study of small GTP-binding proteins in plants is
still in its infancy. Thus far, about 30 genes encoding
members of monomeric G protein families have been
cloned, including homologs of RAB and RHO. Surpris-
ingly, RAS itself has so far not yet been identified in
plants (Terryn et al. 1996).
Ras Recruits Raf to the Plasma Membrane
The initial steps in the Ras signaling pathway are illus-
Gene Expression and Signal Transduction
25