Báo cáo khoa học: "" potx
Bạn đang xem bản rút gọn của tài liệu. Xem và tải ngay bản đầy đủ của tài liệu tại đây (385.17 KB, 9 trang )
Proceedings of ACL-08: HLT, pages 470–478,
Columbus, Ohio, USA, June 2008.
c
2008 Association for Computational Linguistics
A Critical Reassessment of Evaluation Baselines for Speech Summarization
Gerald Penn and Xiaodan Zhu
University of Toronto
10 King’s College Rd.
Toronto M5S 3G4 CANADA
gpenn,xzhu @cs.toronto.edu
Abstract
We assess the current state of the art in speech
summarization, by comparing a typical sum-
marizer on two different domains: lecture data
and the SWITCHBOARD corpus. Our re-
sults cast significant doubt on the merits of this
area’s accepted evaluation standards in terms
of: baselines chosen, the correspondence of
results to our intuition of what “summaries”
should be, and the value of adding speech-
related features to summarizers that already
use transcripts from automatic speech recog-
nition (ASR) systems.
1 Problem definition and related literature
Speech is arguably the most basic, most natural form
of human communication. The consistent demand
for and increasing availability of spoken audio con-
tent on web pages and other digital media should
therefore come as no surprise. Along with this avail-
ability comes a demand for ways to better navigate
through speech, which is inherently more linear or
sequential than text in its traditional delivery.
Navigation connotes a number of specific tasks,
including search, but also browsing (Hirschberg et
al., 1999) and skimming, which can involve far
more analysis and manipulation of content than the
spoken document retrieval tasks of recent NIST
fame (1997 2000). These would include time com-
pression of the speech signal and/or “dichotic” pre-
sentations of speech, in which a different audio track
is presented to either ear (Cherry and Taylor, 1954;
Ranjan et al., 2006). Time compression of speech,
on the other hand, excises small slices of digitized
speech data out of the signal so that the voices speak
all of the content but more quickly. The excision
can either be fixed rate, for which there have been
a number of experiments to detect comprehension
limits, or variable rate, where the rate is determined
by pause detection and shortening (Arons, 1992),
pitch (Arons, 1994) or longer-term measures of lin-
guistic salience (Tucker and Whittaker, 2006). A
very short-term measure based on spectral entropy
can also be used (Ajmal et al., 2007), which has
the advantage that listeners cannot detect the vari-
ation in rate, but they nevertheless comprehend bet-
ter than fixed-rate baselines that preserve pitch pe-
riods. With or without variable rates, listeners can
easily withstand a factor of two speed-up, but Likert
response tests definitively show that they absolutely
hate doing it (Tucker and Whittaker, 2006) relative
to word-level or utterance-level excisive methods,
which would include the summarization-based strat-
egy that we pursue in this paper.
The strategy we focus on here is summariza-
tion, in its more familiar construal from compu-
tational linguistics and information retrieval. We
view it as an extension of the text summarization
problem in which we use automatically prepared,
imperfect textual transcripts to summarize speech.
Other details are provided in Section 2.2. Early
work on speech summarization was either domain-
restricted (Kameyama and Arima, 1994), or prided
itself on not using ASR at all, because of its unreli-
ability in open domains (Chen and Withgott, 1992).
Summaries of speech, however, can still be delivered
audially (Kikuchi et al., 2003), even when (noisy)
transcripts are used.
470
The purpose of this paper is not so much to in-
troduce a new way of summarizing speech, as to
critically reappraise how well the current state of
the art really works. The earliest work to con-
sider open-domain speech summarization seriously
from the standpoint of text summarization technol-
ogy (Valenza et al., 1999; Zechner and Waibel,
2000) approached the task as one of speech tran-
scription followed by text summarization of the re-
sulting transcript (weighted by confidence scores
from the ASR system), with the very interesting re-
sult that transcription and summarization errors in
such systems tend to offset one another in overall
performance. In the years following this work, how-
ever, some research by others on speech summa-
rization (Maskey and Hirschberg, 2005; Murray et
al., 2005; Murray et al., 2006, inter alia) has fo-
cussed de rigueur on striving for and measuring the
improvements attainable over the transcribe-then-
summarize baseline with features available from
non-transcriptional sources (e.g., pitch and energy
of the acoustic signal) or those, while evident in tex-
tual transcripts, not germane to texts other than spo-
ken language transcripts (e.g., speaker changes or
question-answer pair boundaries).
These “novel” features do indeed seem to help,
but not by nearly as much as some of this recent
literature would suggest. The experiments and the
choice of baselines have largely been framed to il-
luminate the value of various knowledge sources
(“prosodic features,” “named entity features” etc.),
rather than to optimize performance per se — al-
though the large-dimensional pattern recognition al-
gorithms and classifiers that they use are inappropri-
ate for descriptive hypothesis testing.
First, most of the benefit attained by these novel
sources can be captured simply by measuring the
lengths of candidate utterances. Only one paper we
are aware of (Christensen et al., 2004) has presented
the performance of length on its own, although the
objective there was to use length, position and other
simple textual feature baselines (no acoustics) to
distinguish the properties of various genres of spo-
ken audio content, a topic that we will return to in
Section 2.1.
1
Second, maximal marginal relevance
1
Length features are often mentioned in the text of other
work as the most beneficial single features in more hetero-
(MMR) has also fallen by the wayside, although it
too performs very well. Again, only one paper that
we are aware of (Murray et al., 2005) provides an
MMR baseline, and there MMR significantly out-
performs an approach trained on a richer collection
of features, including acoustic features. MMR was
the method of choice for utterance selection in Zech-
ner and Waibel (2000) and their later work, but it
is often eschewed perhaps because textbook MMR
does not directly provide a means to incorporate
other features. There is a simple means of doing so
(Section 2.3), and it is furthermore very resilient to
low word-error rates (WERs, Section 3.3).
Third, as inappropriate uses of optimization meth-
ods go, the one comparison that has not made it
into print yet is that of the more traditional “what-is-
said” features (MMR, length in words and named-
entity features) vs. the avant-garde “how-it-is-said”
features (structural, acoustic/prosodic and spoken-
language features). Maskey & Hirschberg (2005)
divide their features into these categories, but only
to compute a correlation coefficient between them
(0.74). The former in aggregate still performs sig-
nificantly better than the latter in aggregate, even if
certain members of the latter do outperform certain
members of the former. This is perhaps the most re-
assuring comparison we can offer to text summariza-
tion and ASR enthusiasts, because it corroborates
the important role that ASR still plays in speech
summarization in spite of its imperfections.
Finally, and perhaps most disconcertingly, we
can show that current speech summarization per-
forms just as well, and in some respects even bet-
ter, with SWITCHBOARD dialogues as it does with
more coherent spoken-language content, such as lec-
tures. This is not a failing of automated systems
themselves — even humans exhibit the same ten-
dency under the experimental conditions that most
researchers have used to prepare evaluation gold
standards. What this means is that, while speech
summarization systems may arguably be useful and
are indeed consistent with whatever it is that humans
are doing when they are enlisted to rank utterances,
this evaluation regime simply does not reflect how
well the “summaries” capture the goal-orientation or
geneous systems, but without indicating their performance on
their own.
471
higher-level purpose of the data that they are trained
on. As a community, we have been optimizing an
utterance excerpting task, we have been moderately
successful at it, but this task in at least one impor-
tant respect bears no resemblance to what we could
convincingly call speech summarization.
These four results provide us with valuable insight
into the current state of the art in speech summariza-
tion: it is not summarization, the aspiration to mea-
sure the relative merits of knowledge sources has
masked the prominence of some very simple base-
lines, and the Zechner & Waibel pipe-ASR-output-
into-text-summarizer model is still very competitive
— what seems to matter more than having access
to the raw spoken data is simply knowing that it is
spoken data, so that the most relevant, still textu-
ally available features can be used. Section 2 de-
scribes the background and further details of the ex-
periments that we conducted to arrive at these con-
clusions. Section 3 presents the results that we ob-
tained. Section 4 concludes by outlining an ecologi-
cally valid alternative for evaluating real summariza-
tion in light of these results.
2 Setting of the experiment
2.1 Provenance of the data
Speech summarizers are generally trained to sum-
marize either broadcast news or meetings. With
the exception of one paper that aspires to compare
the “styles” of spoken and written language ceteris
paribus (Christensen et al., 2004), the choice of
broadcast news as a source of data in more recent
work is rather curious. Broadcast news, while open
in principle in its range of topics, typically has a
range of closely parallel, written sources on those
same topics, which can either be substituted for spo-
ken source material outright, or at the very least
be used corroboratively alongside them. Broadcast
news is also read by professional news readers, using
high quality microphones and studio equipment, and
as a result has very lower WER — some even call
ASR a solved problem on this data source. Broad-
cast news is also very text-like at a deeper level. Rel-
ative position within a news story or dialogue, the
dreaded baseline of text summarization, works ex-
tremely well in spoken broadcast news summariza-
tion, too. Within the operating region of the receiver
operating characteristics (ROC) curve most relevant
to summarizers (0.1–0.3), Christensen et al. (2004)
showed that position was by far the best feature in
a read broadcast news system with high WER, and
that position and length of the extracted utterance
were the two best with low WER. Christensen et
al. (2004) also distinguished read news from “spon-
taneous news,” broadcasts that contain interviews
and/or man-in-the-field reports, and showed that in
the latter variety position is not at all prominent
at any level of WER, but length is. Maskey &
Hirschberg’s (2005) broadcast news is a combina-
tion of read news and spontaneous news.
Spontaneous speech, in our view, particularly in
the lecture domain, is our best representative of what
needs to be summarized. Here, the positional base-
line performs quite poorly (although length does ex-
tremely well, as discussed below), and ASR per-
formance is far from perfect. In the case of lec-
tures, there are rarely exact transcripts available, but
there are bulleted lines from presentation slides, re-
lated research papers on the speaker’s web page and
monographs on the same topic that can be used to
improve the language models for speech recogni-
tion systems. Lectures have just the right amount of
props for realistic ASR, but still very open domain
vocabularies and enough spontaneity to make this a
problem worth solving. As discussed further in Sec-
tion 4, the classroom lecture genre also provides us
with a task that we hope to use to conduct a better
grounded evaluation of real summarization quality.
To this end, we use a corpus of lectures recorded
at the University of Toronto to train and test our sum-
marizer. Only the lecturer is recorded, using a head-
worn microphone, and each lecture lasts 50 minutes.
The lectures in our experiments are all undergradu-
ate computer science lectures. The results reported
in this paper used four different lectures, each from
a different course and spoken by a different lecturer.
We used a leave-one-out cross-validation approach
by iteratively training on three lectures worth of ma-
terial and testing on the one remaining. We combine
these iterations by averaging. The lectures were di-
vided at random into 8–15 minute intervals, how-
ever, in order to provide a better comparison with
the SWITCHBOARD dialogues. Each interval was
treated as a separate document and was summarized
separately. So the four lectures together actually
472
provide 16 SWITCHBOARD-sized samples of ma-
terial, and our cross-validation leaves on average
four of them out in a turn.
We also use part of the SWITCHBOARD cor-
pus in one of our comparisons. SWITCHBOARD
is a collection of telephone conversations, in which
two participants have been told to speak on a cer-
tain topic, but with no objective or constructive
goal to proceed towards. While the conversations
are locally coherent, this lack of goal-orientation is
acutely apparent in all of them — they may be as
close as any speech recording can come to being
about nothing.
2
We randomly selected 27 conver-
sations, containing a total of 3665 utterances (iden-
tified by pause length), and had three human anno-
tators manually label each utterance as in- or out-
of-summary. Interestingly, the interannotator agree-
ment on SWITCHBOARD (
) is higher
than on the lecture corpus (0.372) and higher than
the -score reported by Galley (2006) for the ICSI
meeting data used by Murray et al. (2005; 2006),
in spite of the fact that Murray et al. (2005) primed
their annotators with a set of questions to consider
when annotating the data.
3
This does not mean that
the SWITCHBOARD summaries are qualitatively
better, but rather that annotators are apt to agree
more on which utterances to include in them.
2.2 Summarization task
As with most work in speech summarization, our
strategy involves considering the problem as one
of utterance extraction, which means that we are
not synthesizing new text or speech to include in
summaries, nor are we attempting to extract small
phrases to sew together with new prosodic contours.
Candidate utterances are identified through pause-
length detection, and the length of these pauses has
been experimentally calibrated to 200 msec, which
results in roughly sentence-sized utterances. Sum-
marization then consists of choosing the best N% of
these utterances for the summary, where N is typ-
2
It should be noted that the meandering style of SWITCH-
BOARD conversations does have correlates in text processing,
particularly in the genres of web blogs and newsgroup- or wiki-
based technical discussions.
3
Although we did define what a summary was to each anno-
tator beforehand, we did not provide questions or suggestions
on content for either corpus.
ically between 10 and 30. We will provide ROC
curves to indicate performance as a function over all
N. An ROC is plotted along an x-axis of specificity
(true-negative-rate) and a y-axis of sensitivity (true-
positive-rate). A larger area under the ROC corre-
sponds to better performance.
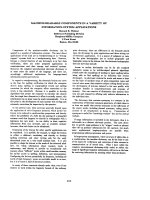
2.3 Utterance isolation
The framework for our extractive summarization ex-
periments is depicted in Figure 1. With the excep-
tion of disfluency removal, it is very similar in its
overall structure to that of Zechner’s (2001). The
summarizer takes as input either manual or auto-
matic transcripts together with an audio file, and
has three modules to process disfluencies and extract
features important to identifying sentences.
Figure 1: Experimental framework for summarizing
spontaneous conversations.
During sentence boundary detection, words that
are likely to be adjacent to an utterance boundary
are determined. We call these words trigger words.
False starts are very common in spontaneous
speech. According to Zechner’s (2001) statistics on
the SWITCHBOARD corpus, they occur in 10-15%
of all utterances. A decision tree (C4.5, Release
8) is used to detect false starts, trained on the POS
tags and trigger-word status of the first and last four
words of sentences from a training set. Once false
starts are detected, these are removed.
We also identify repetitions as a sequence of be-
tween 1 and 4 words which is consecutively re-
473
peated in spontaneous speech. Generally, repetitions
are discarded. Repetitions of greater length are ex-
tremely rare statistically and are therefore ignored.
Question-answer pairs are also detected and
linked. Question-answer detection is a two-stage
process. The system first identifies the questions and
then finds the corresponding answer. For (both WH-
and Yes/No) question identification, another C4.5
classifier was trained on 2,000 manually annotated
sentences using utterance length, POS bigram oc-
currences, and the POS tags and trigger-word status
of the first and last five words of an utterance. After
a question is identified, the immediately following
sentence is labelled as the answer.
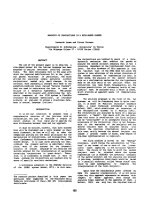
2.4 Utterance selection
To obtain a trainable utterance selection module that
can utilize and compare rich features, we formu-
lated utterance selection as a standard binary clas-
sification problem, and experimented with several
state-of-the-art classifiers, including linear discrim-
inant analysis LDA, support vector machines with
a radial basis kernel (SVM), and logistic regression
(LR), as shown in Figure 2 (computed on SWITCH-
BOARD data). MMR, Zechner’s (2001) choice, is
provided as a baseline. MMR linearly interpolates
a relevance component and a redundancy compo-
nent that balances the need for new vs. salient in-
formation. These two components can just as well
be mixed through LR, which admits the possibility
of adding more features and the benefit of using LR
over held-out estimation.
0 0.2 0.4 0.6 0.8 1
0
0.2
0.4
0.6
0.8
1
Recall
Precision
LR−full−fea
LDA−full−fea
SVM−full−fea
LR−MMR−fea
MMR
Figure 2: Precision-recall curve for several classifiers on
the utterance selection task.
As Figure 2 indicates, there is essentially no dif-
ference in performance among the three classifiers
we tried, nor between MMR and LR restricted to
the two MMR components. This is important, since
we will be comparing MMR to LR-trained classi-
fiers based on other combinations of features below.
The ROC curves in the remainder of this paper have
been prepared using the LR classifier.
2.5 Features extracted
While there is very little difference realized across
pattern recognition methods, there is much more at
stake with respect to which features the methods use
to characterize their input. We can extract and use
the features in Figure 3, arranged there according to
their knowledge source.
We detect disfluencies in the same manner as
Zechner (2001)). Taking ASR transcripts as input,
we use the Brill tagger (Brill, 1995) to assign POS
tags to each word. There are 42 tags: Brill’s 38 plus
four which identify filled-pause disfluencies:
empty coordinating conjunctions (CO),
lexicalized filled pauses (DM),
editing terms (ET), and
non-lexicalized filled pauses (UH).
Our disfluency features include the number of each
of these, their total, and also the number of repeti-
tions. Disfluencies adjacent to a speaker turn are ig-
nored, however, because they occur as a normal part
of turn coordination between speakers.
Our preliminary experiments suggest that speaker
meta-data do not improve on the quality of summa-
rization, and so this feature is not included.
We indicate with bold type the features that indi-
cate some quantity of length, and we will consider
these as members of another class called “length,”
in addition to their given class above. In all of the
data on which we have measured, the correlation be-
tween time duration and number of words is nearly
1.00 (although pause length is not).
2.6 Evaluation of summary quality
We plot receiver operating characteristic (ROC)
curves along a range of possible compression pa-
rameters, and in one case, ROUGE scores. ROUGE
474
1. Lexical features
MMR score
4
,
utterance length (in words),
2. Named entity features — number of:
person names,
location names
organization names
the sum of these
3. Structural features
utterance position, labelled as first, middle, or
last one-third of the conversation
a Boolean feature indicating whether an utter-
ance is adjacent to a speaker turn
1. Acoustic features — min, max and avg. of:
5
pitch
energy
speaking rate
(unfilled) pause length
time duration (in msec)
2. “Spoken language” features
disfluencies
given/new information
question/answer pair identification
Figure 3: Features available for utterance selection by knowledge source. Features in bold type quantify length. In our
experiments, we exclude these from their knowledge sources, and study them as a separate length category.
and F-measure are both widely used in speech sum-
marization, and they have been shown by others
to be broadly consistent on speech summarization
tasks (Zhu and Penn, 2005).
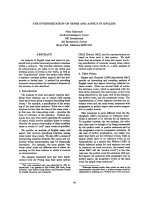
3 Results and analysis
3.1 Lecture corpus
The results of our evaluation on the lecture data ap-
pear in Figure 4. As is evident, there is very little
difference among the combinations of features with
this data source, apart from the positional baseline,
“lead,” which simply chooses the first N% of the
utterances. This performs quite poorly. The best
performance is achieved by using all of the features
together, but the length baseline, which uses only
those features in bold type from Figure 3, is very
close (no statistically significant difference), as is
MMR.
6
4
When evaluated on its own, the MMR interpolating param-
eter is set through experimentation on a held-out dataset, as in
Zechner (2001). When combined with other features, its rele-
vance and redundancy components are provided to the classifier
separately.
5
All of these features are calculated on the word level and
normalized by speaker.
6
We conducted the same evaluation without splitting the lec-
tures into 8–15 minute segments (so that the summaries sum-
marize an entire lecture), and although space here precludes
the presentation of the ROC curves, they are nearly identical
Figure 4: ROC curve for utterance selection with the lec-
ture corpus with several feature combinations.
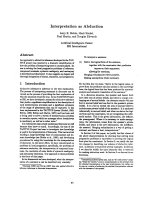
3.2 SWITCHBOARD corpus
The corresponding results on SWITCHBOARD are
shown in Figure 5. Again, length and MMR are
very close to the best alternative, which is again all
of features combined. The difference with respect
to either of these baselines is statistically significant
within the popular 10–30% compression range, as
is the classifier trained on all features but acoustic
to those on the segments shown here.
475
Figure 5: ROC curve for SWITCHBOARD utterance se-
lection with several feature combinations.
(not shown). The classifier trained on all features
but spoken language features (not shown) is not sig-
nificantly better, so it is the spoken language fea-
tures that make the difference, not the acoustic fea-
tures. The best score is also significantly better than
on the lecture data, however, particularly in the 10–
30% range. Our analysis of the difference suggests
that the much greater variance in utterance length in
SWITCHBOARD is what accounts for the overall
better performance of the automated system as well
as the higher human interannotator agreement. This
also goes a long way to explaining why the length
baseline is so good.
Still another perspective is to classify features as
either “what-is-said” (MMR, length and NE fea-
tures) or “how-it-is-said” (structural, acoustic and
spoken-language features), as shown in Figure 6.
What-is-said features are better, but only barely so
within the usual operating region of summarizers.
3.3 Impact of WER
Word error rates (WERs) arising from speech recog-
nition are usually much higher in spontaneous con-
versations than in read news. Having trained ASR
models on SWITCHBOARD section 2 data with
our sample of 27 conversations removed, the WER
on that sample is 46%. We then train a language
model on SWITCHBOARD section 2 without re-
moving the 27-conversation sample so as to delib-
0 0.1 0.2 0.3 0.4 0.5 0.6 0.7 0.8 0.9 1
0
0.1
0.2
0.3
0.4
0.5
0.6
0.7
0.8
0.9
1
Sensitivity
1−Specificity
all
what−is−said
how−it−is−said
Figure 6: ROC curves for textual and non-textual fea-
tures.
erately overfit the model. This pseudo-WER is then
39%. We might be able to get less WER by tuning
the ASR models or by using more training data, but
that is not the focus here. Summarizing the auto-
matic transcripts generated from both of these sys-
tems using our LR-based classifier with all features,
as well as manual (perfect) transcripts, we obtain the
ROUGE–1 scores in Table 1.
WER 10% 15% 20% 25% 30%
0.46 .615 .591 .556 .519 .489
0.39 .615 .591 .557 .526 .491
0 .619 .600 .566 .530 .492
Table 1: ROUGE–1 of LR system with all features under
different WERs.
Table 1 shows that WERs do not impact summa-
rization performance significantly. One reason is
that the acoustic and structural features are not af-
fected by word errors, although WERs can affect
the MMR, spoken language, length and NE features.
Figures 7 and 8 present the ROC curves of the MMR
and spoken language features, respectively, under
different WERs. MMR is particularly resilient,
even on SWITCHBOARD. Keywords are still often
correctly recognized, even in the presence of high
WER, although possibly because the same topic is
discussed in many SWITCHBOARD conversations.
476
Figure 7: ROC curves for the effectiveness of MMR
scores on transcripts under different WERs.
Figure 8: ROC curves for the effectiveness of spoken lan-
guage features on transcripts under different WERs.
When some keywords are misrecognized (e.g. hat),
furthermore, related words (e.g. dress, wear) still
may identify important utterances. As a result, a
high WER does not necessarily mean a worse tran-
script for bag-of-keywords applications like sum-
marization and classification, regardless of the data
source. Utterance length does not change very much
when WERs vary, and in addition, it is often a la-
tent variable that underlies some other features’ role,
e.g., a long utterance often has a higher MMR score
than a short utterance, even when the WER changes.
Note that the effectiveness of spoken language
features varies most between manually and automat-
ically generated transcripts just at around the typi-
cal operating region of most summarization systems.
The features of this category that respond most to
WER are disfluencies. Disfluency detection is also
at its most effective in this same range with respect
to any transcription method.
4 Future Work
In terms of future work in light of these results,
clearly the most important challenge is to formu-
late an experimental alternative to measuring against
a subjectively classified gold standard in which an-
notators are forced to commit to relative salience
judgements with no attention to goal orientation and
no requirement to synthesize the meanings of larger
units of structure into a coherent message. It is here
that using the lecture domain offers us some addi-
tional assistance. Once these data have been tran-
scribed and outlined, we will be able to formulate
examinations for students that test their knowledge
of the topics being lectured upon: both their higher-
level understanding of goals and conceptual themes,
as well as factoid questions on particular details. A
group of students can be provided with access to a
collection of entire lectures to establish a theoreti-
cal limit. Experimental and control groups can then
be provided with access only to summaries of those
lectures, prepared using different sets of features, or
different modes of delivery (text vs. speech), for ex-
ample. This task-based protocol involves quite a bit
more work, and at our university, at least, there are
regulations that preclude us placing a group of stu-
dents in a class at a disadvantage with respect to an
examination for credit that need to be dealt with. It
is, however, a far better means of assessing the qual-
ity of summaries in an ecologically valid context.
It is entirely possible that, within this protocol, the
baselines that have performed so well in our experi-
ments, such as length or, in read news, position, will
utterly fail, and that less traditional acoustic or spo-
ken language features will genuinely, and with sta-
tistical significance, add value to a purely transcript-
based text summarization system. To date, how-
ever, that case has not been made. He et al. (1999)
conducted a study very similar to the one suggested
above and found no significant difference between
using pitch and using slide transition boundaries. No
ASR transcripts or length features were used.
477
References
M. Ajmal, A. Kushki, and K. N. Plataniotis. 2007. Time-
compression of speech in informational talks using
spectral entropy. In Proceedings of the 8th Interna-
tional Workshop on Image Analysis for Multimedia In-
teractive Services (WIAMIS-07).
B Arons. 1992. Techniques, perception, and applications
of time-compressed speech. In American Voice I/O
Society Conference, pages 169–177.
B. Arons. 1994. Speech Skimmer: Interactively Skim-
ming Recorded Speech. Ph.D. thesis, MIT Media Lab.
E. Brill. 1995. Transformation-based error-driven learn-
ing and natural language processing: A case study
in part-of-speech tagging. Computational Linguistics,
21(4):543–565.
F. Chen and M. Withgott. 1992. The use of emphasis
to automatically summarize a spoken discourse. In
Proceedings of the IEEE International Conference on
Acoustics, Speech and Signal Processing (ICASSP),
volume 1, pages 229–232.
E. Cherry and W. Taylor. 1954. Some further exper-
iments on the recognition of speech, with one and
two ears. Journal of the Acoustic Society of America,
26:554–559.
H. Christensen, B. Kolluru, Y. Gotoh, and S. Renals.
2004. From text summarisation to style-specific sum-
marisation for broadcast news. In Proceedings of the
26th European Conference on Information Retrieval
(ECIR-2004), pages 223–237.
M. Galley. 2006. A skip-chain conditional random field
for ranking meeting utterances by importance. In Pro-
ceedings of the 2006 Conference on Empirical Meth-
ods in Natural Language Processing (EMNLP 2006).
L. He, E. Sanocki, A. Gupta, and J. Grudin. 1999. Auto-
summarization of audio-video presentations. In MUL-
TIMEDIA ’99: Proceedings of the seventh ACM in-
ternational conference on Multimedia (Part 1), pages
489–498.
J. Hirschberg, S. Whittaker, D. Hindle, F. Pereira, and
A. Singhal. 1999. Finding information in audio: A
new paradigm for audio browsing and retrieval. In
Proceedings of the ESCA/ETRW Workshop on Access-
ing Information in Spoken Audio, pages 117–122.
M. Kameyama and I. Arima. 1994. Coping with about-
ness complexity in information extraction from spo-
ken dialogues. In Proceedings of the 3rd International
Conference on Spoken Language Processing (ICSLP),
pages 87–90.
T. Kikuchi, S. Furui, and C. Hori. 2003. Two-stage au-
tomatic speech summarization by sentence extraction
and compaction. In Proceedings of the ISCA/IEEE
Workshop on Spontaneous Speech Processing and
Recognition (SSPR), pages 207–210.
S. Maskey and J. Hirschberg. 2005. Comparing lex-
ial, acoustic/prosodic,discourseand structural features
for speech summarization. In Proceedings of the 9th
European Conference on Speech Communication and
Technology (Eurospeech), pages 621–624.
G. Murray, S. Renals, and J. Carletta. 2005. Extractive
summarization of meeting recordings. In Proceedings
of the 9th European Conference on Speech Communi-
cation and Technology (Eurospeech), pages 593–596.
G. Murray, S. Renals, J. Moore, and J. Carletta. 2006. In-
corporating speaker and discourse features into speech
summarization. In Proceedings of the Human Lan-
guage Technology Conference - Annual Meeting of the
North American Chapter of the Association for Com-
putational Linguistics (HLT-NAACL), pages 367–374.
National Institute of Standards. 1997–2000. Pro-
ceedings of the Text REtrieval Conferences.
/>Abhishek Ranjan, Ravin Balakrishnan, and Mark
Chignell. 2006. Searching in audio: the utility of tran-
scripts, dichotic presentation, and time-compression.
In CHI ’06: Proceedings of the SIGCHI conference on
Human Factors in computing systems, pages 721–730,
New York, NY, USA. ACM Press.
S. Tucker and S. Whittaker. 2006. Time is of the essence:
an evaluation of temporal compression algorithms. In
CHI ’06: Proceedings of the SIGCHI conference on
Human Factors in computing systems, pages 329–338,
New York, NY, USA. ACM Press.
R. Valenza, T. Robinson, M. Hickey, and R. Tucker.
1999. Summarization of spoken audio through infor-
mation extraction. In Proceedings of the ESCA/ETRW
Workshop on Accessing Information in Spoken Audio,
pages 111–116.
K. Zechner and A. Waibel. 2000. Minimizing word er-
ror rate in textual summaries of spoken language. In
Proceedings of the 6th Applied Natural Language Pro-
cessing Conference and the 1st Meeting of the North
American Chapter of the Association for Computa-
tional Linguistics (ANLP/NAACL), pages 186–193.
K. Zechner. 2001. Automatic Summarization of Spo-
ken Dialogues in Unrestricted Domains. Ph.D. thesis,
Carnegie Mellon University.
X. Zhu and G. Penn. 2005. Evaluation of sentence selec-
tion for speech summarization. In Proceedings of the
RANLP workshop on Crossing Barriers in Text Sum-
marization Research, pages 39–45.
478