Báo cáo khoa học: "Opinion Mining Using Econometrics: A Case Study on Reputation Systems" pdf
Bạn đang xem bản rút gọn của tài liệu. Xem và tải ngay bản đầy đủ của tài liệu tại đây (672.14 KB, 8 trang )
Proceedings of the 45th Annual Meeting of the Association of Computational Linguistics, pages 416–423,
Prague, Czech Republic, June 2007.
c
2007 Association for Computational Linguistics
Opinion Mining Using Econometrics: A Case Study on Reputation Systems
Anindya Ghose Panagiotis G. Ipeirotis
Department of Information, Operations, and Management Sciences
Leonard N. Stern School of Business, New York University
{aghose,panos,arun}@stern.nyu.edu
Arun Sundararajan
Abstract
Deriving the polarity and strength of opinions
is an important research topic, attracting sig-
nificant attention over the last few years. In
this work, to measure the strength and po-
larity of an opinion, we consider the eco-
nomic context in which the opinion is eval-
uated, instead of using human annotators or
linguistic resources. We rely on the fact that
text in on-line systems influences the behav-
ior of humans and this effect can be observed
using some easy-to-measure economic vari-
ables, such as revenues or product prices. By
reversing the logic, we infer the semantic ori-
entation and strength of an opinion by tracing
the changes in the associated economic vari-
able. In effect, we use econometrics to iden-
tify the “economic value of text” and assign a
“dollar value” to each opinion phrase, measur-
ing sentiment effectively and without the need
for manual labeling. We argue that by inter-
preting opinions using econometrics, we have
the first objective, quantifiable, and context-
sensitive evaluation of opinions. We make the
discussion concrete by presenting results on
the reputation system of Amazon.com. We
show that user feedback affects the pricing
power of merchants and by measuring their
pricing power we can infer the polarity and
strength of the underlying feedback postings.
1 Introduction
A significant number of websites today allow users to
post articles where they express opinions about prod-
ucts, firms, people, and so on. For example, users
on Amazom.com post reviews about products they
bought and users on eBay.com post feedback describ-
ing their experiences with sellers. The goal of opinion
mining systems is to identify such pieces of the text
that express opinions (Breck et al., 2007; K
¨
onig and
Brill, 2006) and then measure the polarity and strength
of the expressed opinions. While intuitively the task
seems straightforward, there are multiple challenges
involved.
• What makes an opinion positive or negative? Is
there an objective measure for this task?
• How can we rank opinions according to their
strength? Can we define an objective measure
for ranking opinions?
• How does the context change the polarity and
strength of an opinion and how can we take the
context into consideration?
To evaluate the polarity and strength of opinions,
most of the existing approaches rely either on train-
ing from human-annotated data (Hatzivassiloglou and
McKeown, 1997), or use linguistic resources (Hu and
Liu, 2004; Kim and Hovy, 2004) like WordNet, or
rely on co-occurrence statistics (Turney, 2002) be-
tween words that are unambiguously positive (e.g.,
“excellent”) and unambiguously negative (e.g., “hor-
rible”). Finally, other approaches rely on reviews with
numeric ratings from websites (Pang and Lee, 2002;
Dave et al., 2003; Pang and Lee, 2004; Cui et al.,
2006) and train (semi-)supervised learning algorithms
to classify reviews as positive or negative, or in more
fine-grained scales (Pang and Lee, 2005; Wilson et al.,
2006). Implicitly, the supervised learning techniques
assume that numeric ratings fully encapsulate the sen-
timent of the review.
416
In this paper, we take a different approach and in-
stead consider the economic context in which an opin-
ion is evaluated. We observe that the text in on-line
systems influence the behavior of the readers. This
effect can be measured by observing some easy-to-
measure economic variable, such as product prices.
For instance, online merchants on eBay with “posi-
tive” feedback can sell products for higher prices than
competitors with “negative” evaluations. Therefore,
each of these (positive or negative) evaluations has
a (positive or negative) effect on the prices that the
merchant can charge. For example, everything else
being equal, a seller with “speedy” delivery may be
able to charge $10 more than a seller with “slow” de-
livery. Using this information, we can conclude that
“speedy” is better than “slow” when applied to “deliv-
ery” and their difference is $10. Thus, we can infer the
semantic orientation and the strength of an evaluation
from the changes in the observed economic variable.
Following this idea, we use techniques from econo-
metrics to identify the “economic value of text” and
assign a “dollar value” to each text snippet, measuring
sentiment strength and polarity effectively and with-
out the need for labeling or any other resource.
We argue that by interpreting opinions within an
econometric framework, we have the first objective
and context-sensitive evaluation of opinions. For
example, consider the comment “good packaging,”
posted by a buyer to evaluate a merchant. This
comment would have been considered unambiguously
positive by the existing opinion mining systems. We
observed, though, that within electronic markets, such
as eBay, a posting that contains the words “good pack-
aging” has actually negative effect on the power of a
merchant to charge higher prices. This surprising ef-
fect reflects the nature of the comments in online mar-
ketplaces: buyers tend to use superlatives and highly
enthusiastic language to praise a good merchant, and
a lukewarm “good packaging” is interpreted as neg-
ative. By introducing the econometric interpretation
of opinions we can effortlessly capture such challeng-
ing scenarios, something that is impossible to achieve
with the existing approaches.
We focus our paper on reputation systems in elec-
tronic markets and we examine the effect of opinions
on the pricing power of merchants in the marketplace
of Amazon.com. (We discuss more applications in
Section 7.) We demonstrate the value of our technique
using a dataset with 9,500 transactions that took place
over 180 days. We show that textual feedback affects
the power of merchants to charge higher prices than
the competition, for the same product, and still make a
sale. We then reverse the logic and determine the con-
tribution of each comment in the pricing power of a
merchant. Thus, we discover the polarity and strength
of each evaluation without the need for human anno-
tation or any other form of linguistic resource.
The structure of the rest of the paper is as fol-
lows. Section 2 gives the basic background on rep-
utation systems. Section 3 describes our methodol-
ogy for constructing the data set that we use in our
experiments. Section 4 shows how we combine estab-
lished techniques from econometrics with text mining
techniques to identify the strength and polarity of the
posted feedback evaluations. Section 5 presents the
experimental evaluations of our techniques. Finally,
Section 6 discusses related work and Section 7 dis-
cusses further applications and concludes the paper.
2 Reputation Systems and Price Premiums
When buyers purchase products in an electronic mar-
ket, they assess and pay not only for the product they
wish to purchase but for a set of fulfillment character-
istics as well, e.g., packaging, delivery, and the extent
to which the product description matches the actual
product. Electronic markets rely on reputation sys-
tems to ensure the quality of these characteristics for
each merchant, and the importance of such systems
is widely recognized in the literature (Resnick et al.,
2000; Dellarocas, 2003). Typically, merchants’ rep-
utation in electronic markets is encoded by a “repu-
tation profile” that includes: (a) the number of past
transactions for the merchant, (b) a summary of nu-
meric ratings from buyers who have completed trans-
actions with the seller, and (c) a chronological list of
textual feedback provided by these buyers.
Studies of online reputation, thus far, base a mer-
chant’s reputation on the numeric rating that charac-
terizes the seller (e.g., average number of stars and
number of completed transactions) (Melnik and Alm,
2002). The general conclusion of these studies show
that merchants with higher (numeric) reputation can
charge higher prices than the competition, for the
same products, and still manage to make a sale. This
price premium that the merchants can command over
the competition is a measure of their reputation.
Definition 2.1 Consider a set of merchants s
1
, . . . , s
n
selling a product for prices p
1
, . . . , p
n
. If s
i
makes
417
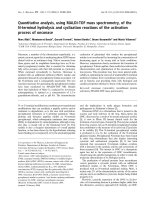
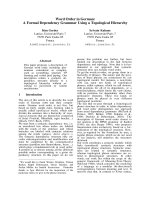
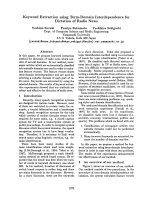
Figure 1: A set of merchants on Amazon.com selling
an identical product for different prices
the sale for price p
i
, then s
i
commands a price pre-
mium equal to p
i
− p
j
over s
j
and a relative price
premium equal to
p
i
−p
j
p
i
. Hence, a transaction that in-
volves n competing merchants generates n − 1 price
premiums.
1
The average price premium for the trans-
action is
j=i
(p
i
−p
j
)
n−1
and the average relative price
premium is
j=i
(p
i
−p
j
)
p
i
(n−1)
. ✷
Example 2.1 Consider the case in Figure 1 where
three merchants sell the same product for $631.95,
$632.26, and $637.05, respectively. If GameHog sells
the product, then the price premium against XP Pass-
port is $4.79 (= $637.05 − $632.26) and against the
merchant BuyPCsoft is $5.10. The relative price pre-
mium is 0.75% and 0.8%, respectively. Similarly, the
average price premium for this transaction is $4.95
and the average relative price premium 0.78%. ✷
Different sellers in these markets derive their repu-
tation from different characteristics: some sellers have
a reputation for fast delivery, while some others have
a reputation of having the lowest price among their
peers. Similarly, while some sellers are praised for
their packaging in the feedback, others get good com-
ments for selling high-quality goods but are criticized
for being rather slow with shipping. Even though pre-
vious studies have established the positive correlation
between higher (numeric) reputation and higher price
premiums, they ignored completely the role of the tex-
tual feedback and, in turn, the multi-dimensional na-
ture of reputation in electronic markets. We show that
the textual feedback adds significant additional value
to the numerical scores, and affects the pricing power
of the merchants.
1
As an alternative definition we can ignore the negative price
premiums. The experimental results are similar for both versions.
3 Data
We compiled a data set using software resellers from
publicly available information on software product
listings at Amazon.com. Our data set includes 280
individual software titles. The sellers’ reputation mat-
ters when selling identical goods, and the price varia-
tion observed can be attributed primarily to variation
in the merchant’s reputation. We collected the data us-
ing Amazon Web Services over a period of 180 days,
between October 2004 and March 2005. We describe
below the two categories of data that we collected.
Transaction Data: The first part of our data set
contains details of the transactions that took place on
the marketplace of Amazon.com for each of the soft-
ware titles. The Amazon Web Services associates a
unique transaction ID for each unique product listed
by a seller. This transaction ID enables us to distin-
guish between multiple or successive listings of iden-
tical products sold by the same merchant. Keeping
with the methodology in prior research (Ghose et al.,
2006), we crawl the Amazon’s XML listings every 8
hours and when a transaction ID associated with a
particular listing is removed, we infer that the listed
product was successfully sold in the prior 8 hour win-
dow.
2
For each transaction that takes place, we keep
the price at which the product was sold and the mer-
chant’s reputation at the time of the transaction (more
on this later). Additionally, for each of the competing
listings for identical products, we keep the listed price
along with the competitors reputation. Using the col-
lected data, we compute the price premium variables
for each transaction
3
using Definition 2.1. Overall,
our data set contains 1,078 merchants, 9,484 unique
transactions and 107,922 price premiums (recall that
each transaction generates multiple price premiums).
Reputation Data: The second part of our data set
contains the reputation history of each merchant that
had a (monitored) product for sale during our 180-day
window. Each of these merchants has a feedback pro-
file, which consists of numerical scores and text-based
feedback, posted by buyers. We had an average of
4,932 postings per merchant. The numerical ratings
2
Amazon indicates that their seller listings remain on the site
indefinitely until they are sold and sellers can change the price of
the product without altering the transaction ID.
3
Ideally, we would also include the tax and shipping cost
charged by each merchant in the computation of the price pre-
miums. Unfortunately, we could not capture these costs using
our methodology. Assuming that the fees for shipping and tax
are independent of the merchants’ reputation, our analysis is not
affected.
418
are provided on a scale of one to five stars. These rat-
ings are averaged to provide an overall score to the
seller. Note that we collect all feedback (both numeri-
cal and textual) associated with a seller over the entire
lifetime of the seller and we reconstruct each seller’s
exact feedback profile at the time of each transaction.
4 Econometrics-based Opinion Mining
In this section, we describe how we combine econo-
metric techniques with NLP techniques to derive the
semantic orientation and strength of the feedback
evaluations. Section 4.1 describes how we structure
the textual feedback and Section 4.2 shows how we
use econometrics to estimate the polarity and strength
of the evaluations.
4.1 Retrieving the Dimensions of Reputation
We characterize a merchant using a vector of reputa-
tion dimensions X = (X
1
, X
2
, , X
n
), representing
its ability on each of n dimensions. We assume that
each of these n dimensions is expressed by a noun,
noun phrase, verb, or a verb phrase chosen from the
set of all feedback postings, and that a merchant is
evaluated on these n dimensions. For example, di-
mension 1 might be “shipping”, dimension 2 might
be “packaging” and so on. In our model, each of these
dimensions is assigned a numerical score. Of course,
when posting textual feedback, buyers do not assign
explicit numeric scores to any dimension. Rather, they
use modifiers (typically adjectives or adverbs) to eval-
uate the seller along each of these dimensions (we de-
scribe how we assign numeric scores to each modifier
in Section 4.2). Once we have identified the set of all
dimensions, we can then parse each of the feedback
postings, associate a modifier with each dimension,
and represent a feedback posting as an n-dimensional
vector φ of modifiers.
Example 4.1 Suppose dimension 1 is “delivery,” di-
mension 2 is “packaging,” and dimension 3 is “ser-
vice.” The feedback posting “I was impressed by the
speedy delivery! Great service!” is then encoded as
φ
1
= [speedy, NULL, great], while the posting “The
item arrived in awful packaging, and the delivery was
slow” is encoded as φ
2
= [slow, awful, NULL]. ✷
Let M = {NULL, µ
1
, , µ
M
} be the set of modi-
fiers and consider a seller s
i
with p postings in its rep-
utation profile. We denote with µ
i
jk
∈ M the modifier
that appears in the j-th posting and is used to assess
the k-th reputation dimension. We then structure the
merchant’s feedback as an n ×p matrix M(s
i
) whose
rows are the p encoded vectors of modifiers associated
with the seller. We construct M(s
i
) as follows:
1. Retrieve the postings associated with a merchant.
2. Parse the postings to identify the dimensions
across which the buyer evaluates a seller, keep-
ing
4
the nouns, noun phrases, verbs, and verbal
phrases as reputation characteristics.
5
.
3. Retrieve adjectives and adverbs that refer to
6
di-
mensions (Step 2) and construct the φ vectors.
We have implemented this algorithm on the feed-
back postings of each of our sellers. Our analysis
yields 151 unique dimensions, and a total of 142 mod-
ifiers (note that the same modifier can be used to eval-
uate multiple dimensions).
4.2 Scoring the Dimensions of Reputation
As discussed above, the textual feedback profile of
merchant s
i
is encoded as a n × p matrix M(s
i
); the
elements of this matrix belong to the set of modifiers
M. In our case, we are interested in computing the
“score” a(µ, d, j) that a modifier µ ∈ M assigns to
the dimension d, when it appears in the j-th posting.
Since buyers tend to read only the first few pages
of text-based feedback, we weight higher the influ-
ence of recent text postings. We model this by as-
suming that K is the number of postings that appear
on each page (K = 25 on Amazon.com), and that c
is the probability of clicking on the “Next” link and
moving the next page of evaluations.
7
This assigns a
posting-specific weight r
j
= c
j
K
/
p
q=1
c
q
K
for
the j
th
posting, where j is the rank of the posting, K
is the number of postings per page, and p is the total
number of postings for the given seller. Then, we set
a(µ, d, j) = r
j
· a(µ, d) where a(µ, d) is the “global”
score that modifier µ assigns to dimension d.
Finally, since each reputation dimension has poten-
tially a different weight, we use a weight vector w to
4
We eliminate all dimensions appearing in the profiles of less
than 50 (out of 1078) merchants, since we cannot extract statisti-
cally meaningful results for such sparse dimensions
5
The technique as described in this paper, considers words like
“shipping” and “ delivery” as separate dimensions, although they
refer to the same “real-life” dimension. We can use Latent Dirich-
let Allocation (Blei et al., 2003) to reduce the number of dimen-
sions, but this is outside the scope of this paper.
6
To associate the adjectives and adverbs with the correct di-
mensions, we use the Collins HeadFinder capability of the Stan-
ford NLP Parser.
7
We report only results for c = 0.5. We conducted experi-
ments other values of c as well and the results are similar.
419
weight the contribution of each reputation dimension
to the overall “reputation score” Π(s
i
) of seller s
i
:
Π(s
i
) = r
T
· A(M(s
i
)) · w (1)
where r
T
= [r
1
, r
2
, r
p
] is the vector of the posting-
specific weights and A(M(i)) is a matrix that con-
tains as element the score a(µ
j
, d
k
) where M(s
i
) con-
tains the modifier µ
j
in the column of the dimen-
sion d
k
. If we model the buyers’ preferences as inde-
pendently distributed along each dimension and each
modifier score a(µ, d
k
) also as an independent ran-
dom variable, then the random variable Π(s
i
) is a sum
of random variables. Specifically, we have:
Π(s
i
) =
M
j=1
n
k=1
(w
k
· a(µ
j
, d
k
)) R(µ
j
, d
k
) (2)
where R(µ
j
, d
k
) is equal to the sum of the r
i
weights
across all postings in which the modifier µ
j
modifies
dimension d
k
. We can easily compute the R(µ
j
, d
k
)
values by simply counting appearances and weighting
each appearance using the definition of r
i
.
The question is, of course, how to estimate the val-
ues of w
k
· a(µ
j
, d
k
), which determine the polarity
and intensity of the modifier µ
j
modifying the dimen-
sion d
k
. For this, we observe that the appearance of
such modifier-dimension opinion phrases has an ef-
fect on the price premiums that a merchant can charge.
Hence, there is a correlation between the reputation
scores Π(·) of the merchants and the price premi-
ums observed for each transaction. To discover the
level of association, we use regression. Since we are
dealing with panel data, we estimate ordinary-least-
squares (OLS) regression with fixed effects (Greene,
2002), where the dependent variable is the price pre-
mium variable, and the independent variables are the
reputation scores Π(·) of the merchants, together with
a few other control variables. Generally, we estimate
models of the form:
PricePremium
ij
=
β
c
· X
cij
+ f
ij
+
ij
+
β
t1
· Π(merchant)
ij
+ β
t2
· Π(competitor)
ij
(3)
where PricePremium
ij
is one of the variations of price
premium as given in Definition 2.1 for a seller s
i
and product j, β
c
, β
t1
, and β
t2
are the regressor co-
efficients, Xc are the control variables, Π(·) are the
text reputation scores (see Equation 1), f
ij
denotes the
fixed effects and is the error term. In Section 5, we
give the details about the control variables and the re-
gression settings.
Interestingly, if we expand the Π(·) variables ac-
cording to Equation 2, we can run the regression us-
ing the modifier-dimension pairs as independent vari-
ables, whose values are equal to the R(µ
j
, d
k
) val-
ues. After running the regression, the coefficients as-
signed to each modifier-dimension pair correspond to
the value w
k
· a(µ
j
, d
k
) for each modifier-dimension
pair. Therefore, we can easily estimate in economic
terms the “value” of a particular modifier when used
to evaluate a particular dimension.
5 Experimental Evaluation
In this section, we first present the experimental set-
tings (Section 5.1), and then we describe the results of
our experimental evaluation (Section 5.2).
5.1 Regression Settings
In Equation 3 we presented the general form of the
regression for estimating the scores a(µ
j
, d
k
). Since
we want to eliminate the effect of any other factors
that may influence the price premiums, we also use a
set of control variables. After all the control factors
are taken into consideration, the modifier scores re-
flect the additional value of the text opinions. Specifi-
cally, we used as control variables the product’s price
on Amazon, the average star rating of the merchant,
the number of merchant’s past transactions, and the
number of sellers for the product.
First, we ran OLS regressions with product-seller
fixed effects controlling for unobserved heterogene-
ity across sellers and products. These fixed effects
control for average product quality and differences
in seller characteristics. We run multiple variations
of our model, using different versions of the “price
premium” variable as listed in Definition 2.1. We
also tested variations where we include as indepen-
dent variable not the individual reputation scores but
the difference Π(merchant)−Π(competitor). All re-
gressions yielded qualitatively similar results, so due
to space restrictions we only report results for the re-
gressions that include all the control variables and all
the text variables; we report results using the price
premium as the dependent variable. Our regressions
in this setting contain 107,922 observations, and a to-
tal of 547 independent variables.
5.2 Experimental Results
Recall of Extraction: The first step of our experi-
mental evaluation is to examine whether the opinion
extraction technique of Section 4.1 indeed captures
all the reputation characteristics expressed in the feed-
420
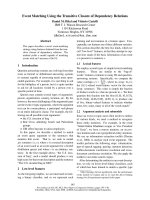
Dimension Human Recall Computer Recall
Product Condition 0.76 0.76
Price 0.91 0.61
Package 0.96 0.66
Overall Experience 0.65 0.55
Delivery Speed 0.96 0.92
Item Description 0.22 0.43
Product Satisfaction 0.68 0.58
Problem Response 0.30 0.37
Customer Service 0.57 0.50
Average 0.66 0.60
Table 1: The recall of our technique compared to the
recall of the human annotators
back (recall) and whether the dimensions that we cap-
ture are accurate (precision). To examine the recall
question, we used two human annotators. The annota-
tors read a random sample of 1,000 feedback postings,
and identified the reputation dimensions mentioned in
the text. Then, they examined the extracted modifier-
dimension pairs for each posting and marked whether
the modifier-dimension pairs captured the identified
real reputation dimensions mentioned in the posting
and which pairs were spurious, non-opinion phrases.
Both annotators identified nine reputation dimen-
sions (see Table 1). Since the annotators did not agree
in all annotations, we computed the average human
recall hRec
d
=
agreed
d
all
d
for each dimension d, where
agreed
d
is the number of postings for which both an-
notators identified the reputation dimension d, and
all
d
is the number of postings in which at least one
annotator identified the dimension d. Based on the
annotations, we computed the recall of our algorithm
against each annotator. We report the average recall
for each dimension, together with the human recall in
Table 1. The recall of our technique is only slightly
inferior to the performance of humans, indicating that
the technique of Section 4.1 extracts the majority of
the posted evaluations.
8
Interestingly, precision is not an issue in our setting.
In our framework, if an particular modifier-dimension
pair is just noise, then it is almost impossible to have a
statistically significant correlation with the price pre-
miums. The noisy opinion phrases are statistically
guaranteed to be filtered out by the regression.
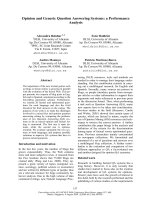
Estimating Polarity and Strength: In Table 2,
8
In the case of “Item Description,” where the computer recall
was higher than the human recall, our technique identified almost
all the phrases of one annotator, but the other annotator had a
more liberal interpretation of “Item Description” dimension and
annotated significantly more postings with the dimension “Item
Description” than the other annotator, thus decreasing the human
recall.
we present the modifier-dimension pairs (positive and
negative) that had the strongest “dollar value” and
were statistically significant across all regressions.
(Due to space issues, we cannot list the values for all
pairs.) These values reflect changes in the merchants’s
pricing power after taking their average numerical
score and level of experience into account, and also
highlight the additional the value contained in text-
based reputation. The examples that we list here il-
lustrate that our technique generates a natural ranking
of the opinion phrases, inferring the strength of each
modifier within the context in which this opinion is
evaluated. This holds true even for misspelled evalua-
tions that would break existing techniques based on
annotation or on resources like WordNet. Further-
more, these values reflect the context in which the
opinion is evaluated. For example, the pair good pack-
aging has a dollar value of -$0.58. Even though this
seems counterintuitive, it actually reflects the nature
of an online marketplace where most of the positive
evaluations contain superlatives, and a mere “good”
is actually interpreted by the buyers as a lukewarm,
slightly negative evaluation. Existing techniques can-
not capture such phenomena.
Price Premiums vs. Ratings: One of the natural
comparisons is to examine whether we could reach
similar results by just using the average star rating as-
sociated with each feedback posting to infer the score
of each opinion phrase. The underlying assumption
behind using the ratings is that the review is per-
fectly summarized by the star rating, and hence the
text plays mainly an explanatory role and carries no
extra information, given the star rating. For this, we
examined the R
2
fit of the regression, with and with-
out the use of the text variables. Without the use of
text variables, the R
2
was 0.35, while when using only
the text-based regressors, the R
2
fit increased to 0.63.
This result clearly indicates that the actual text con-
tains significantly more information than the ratings.
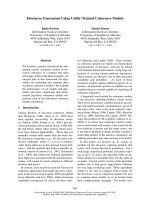
We also experimented with predicting which mer-
chant will make a sale, if they simultaneously sell
the same product, based on their listed prices and on
their numeric and text reputation. Our C4.5 classi-
fier (Quinlan, 1992) takes a pair of merchants and de-
cides which of the two will make a sale. We used as
training set the transactions that took place in the first
four months and as test set the transactions in the last
two months of our data set. Table 3 summarizes the
results for different sets of features used. The 55%
421
Modifier Dimension Dollar Value
[wonderful experience] $5.86
[outstanding seller] $5.76
[excellant service] $5.27
[lightning delivery] $4.84
[highly recommended] $4.15
[best seller] $3.80
[perfectly packaged] $3.74
[excellent condition] $3.53
[excellent purchase] $3.22
[excellent seller] $2.70
[excellent communication] $2.38
[perfect item] $1.92
[terrific condition] $1.87
[top quality] $1.67
[awesome service] $1.05
[A+++ seller] $1.03
[great merchant] $0.93
[friendly service] $0.81
[easy service] $0.78
[never received] -$7.56
[defective product] -$6.82
[horible experience] -$6.79
[never sent] -$6.69
[never recieved] -$5.29
[bad experience] -$5.26
[cancelled order] -$5.01
[never responded] -$4.87
[wrong product] -$4.39
[not as advertised] -$3.93
[poor packaging] -$2.92
[late shipping] -$2.89
[wrong item] -$2.50
[not yet received] -$2.35
[still waiting] -$2.25
[wrong address] -$1.54
[never buy] -$1.48
Table 2: The highest scoring opinion phrases, as de-
termined by the product w
k
· a(µ
j
, d
k
).
accuracy when using only prices as features indicates
that customers rarely choose a product based solely on
price. Rather, as indicated by the 74% accuracy, they
also consider the reputation of the merchants. How-
ever, the real value of the postings relies on the text
and not on the numeric ratings: the accuracy is 87%-
89% when using the textual reputation variables. In
fact, text subsumes the numeric variables but not vice
versa, as indicated by the results in Table 3.
6 Related Work
To the best of our knowledge, our work is the first to
use economics for measuring the effect of opinions
and deriving their polarity and strength in an econo-
metric manner. A few papers in the past tried to
combine text analysis with economics (Das and Chen,
2006; Lewitt and Syverson, 2005), but the text anal-
ysis was limited to token counting and did not use
Features Accuracy on Test Set
Price 55%
Price + Numeric Reputation 74%
Price + Numeric Reputation 89%
+ Text Reputation
Price + Text Reputation 87%
Table 3: Predicting the merchant who makes the sale.
any NLP techniques. The technique of Section 4.1
is based on existing research in sentiment analysis.
For instance, (Hatzivassiloglou and McKeown, 1997;
Nigam and Hurst, 2004) use annotated data to create a
supervised learning technique to identify the semantic
orientation of adjectives. We follow the approach by
Turney (2002), who note that the semantic orientation
of an adjective depends on the noun that it modifies
and suggest using adjective-noun or adverb-verb pairs
to extract semantic orientation. However, we do not
rely on linguistic resources (Kamps and Marx, 2002)
or on search engines (Turney and Littman, 2003) to
determine the semantic orientation, but rather rely on
econometrics for this task. Hu and Liu (2004), whose
study is the closest to our work, use WordNet to com-
pute the semantic orientation of product evaluations
and try to summarize user reviews by extracting the
positive and negative evaluations of the different prod-
uct features. Similarly, Snyder and Barzilay (2007)
decompose an opinion across several dimensions and
capture the sentiment across each dimension. Other
work in this area includes (Lee, 2004; Popescu and
Etzioni, 2005) which uses text mining in the context
product reviews, but none uses the economic context
to evaluate the opinions.
7 Conclusion and Further Applications
We demonstrated the value of using econometrics
for extracting a quantitative interpretation of opin-
ions. Our technique, additionally, takes into con-
sideration the context within which these opinions
are evaluated. Our experimental results show that
our techniques can capture the pragmatic mean-
ing of the expressed opinions using simple eco-
nomic variables as a form of training data. The
source code with our implementation together with
the data set used in this paper are available from
.
There are many other applications beyond reputa-
tion systems. For example, using sales rank data from
Amazon.com, we can examine the effect of product
reviews on product sales and detect the weight that
422
customers put on different product features; further-
more, we can discover how customer evaluations on
individual product features affect product sales and
extract the pragmatic meaning of these evaluations.
Another application is the analysis of the effect of
news stories on stock prices: we can examine what
news topics are important for the stock market and
see how the views of different opinion holders and the
wording that they use can cause the market to move
up or down. In a slightly different twist, we can ana-
lyze news stories and blogs in conjunction with results
from prediction markets and extract the pragmatic ef-
fect of news and blogs on elections or other political
events. Another research direction is to examine the
effect of summarizing product descriptions on prod-
uct sales: short descriptions reduce the cognitive load
of consumers but increase their uncertainty about the
underlying product characteristics; a longer descrip-
tion has the opposite effect. The optimum description
length is the one that balances both effects and maxi-
mizes product sales.
Similar approaches can improve the state of art in
both economics and computational linguistics. In eco-
nomics and in social sciences in general, most re-
searchers handle textual data manually or with sim-
plistic token counting techniques; in the worst case
they ignore text data altogether. In computational
linguistics, researchers often rely on human annota-
tors to generate training data, a laborious and error-
prone task. We believe that cross-fertilization of ideas
between the fields of computational linguistics and
econometrics can be beneficial for both fields.
Acknowledgments
The authors would like to thank Elena Filatova for
the useful discussions and the pointers to related lit-
erature. We also thank Sanjeev Dewan, Alok Gupta,
Bin Gu, and seminar participants at Carnegie Mel-
lon University, Columbia University, Microsoft Re-
search, New York University, Polytechnic University,
and University of Florida for their comments and
feedback. We thank Rhong Zheng for assistance in
data collection. This work was partially supported by
a Microsoft Live Labs Search Award, a Microsoft Vir-
tual Earth Award, and by NSF grants IIS-0643847 and
IIS-0643846. Any opinions, findings, and conclusions
expressed in this material are those of the authors and
do not necessarily reflect the views of the Microsoft
Corporation or of the National Science Foundation.
References
D.M. Blei, A.Y. Ng, and M.I. Jordan. 2003. Latent Dirichlet
allocation. JMLR, 3:993–1022.
E. Breck, Y. Choi, and C. Cardie. 2007. Identifying expressions
of opinion in context. In IJCAI-07, pages 2683–2688.
H. Cui, V. Mittal, and M. Datar. 2006. Comparative experi-
ments on sentiment classification for online product reviews.
In AAAI-2006.
S. Ranjan Das and M. Chen. 2006. Yahoo! for Amazon: Senti-
ment extraction from small talk on the web. Working Paper,
Santa Clara University.
K. Dave, S. Lawrence, and D.M. Pennock. 2003. Mining the
peanut gallery: Opinion extraction and semantic classification
of product reviews. In WWW12, pages 519–528.
C. Dellarocas. 2003. The digitization of word-of-mouth: Promise
and challenges of online reputation mechanisms. Management
Science, 49(10):1407–1424.
A. Ghose, M.D. Smith, and R. Telang. 2006. Internet exchanges
for used books: An empirical analysis for product cannibal-
ization and social welfare. Information Systems Research,
17(1):3–19.
W.H. Greene. 2002. Econometric Analysis. 5th edition.
V. Hatzivassiloglou and K.R. McKeown. 1997. Predicting the
semantic orientation of adjectives. In ACL’97, pages 174–181.
M. Hu and B. Liu. 2004. Mining and summarizing customer
reviews. In KDD-2004, pages 168–177.
J. Kamps and M. Marx. 2002. Words with attitude. In Proceed-
ings of the First International Conference on Global WordNet.
S M. Kim and E. Hovy. 2004. Determining the sentiment of
opinions. In COLING 2004, pages 1367–1373.
A.C. K
¨
onig and E. Brill. 2006. Reducing the human overhead in
text categorization. In KDD-2006, pages 598–603.
T. Lee. 2004. Use-centric mining of customer reviews. In WITS.
S. Lewitt and C. Syverson. 2005. Market distortions when agents
are better informed: The value of information in real estate
transactions. Working Paper, University of Chicago.
M.I. Melnik and J. Alm. 2002. Does a seller’s reputation mat-
ter? Evidence from eBay auctions. Journal of Industrial Eco-
nomics, 50(3):337–350, September.
K. Nigam and M. Hurst. 2004. Towards a robust metric of opin-
ion. In AAAI Spring Symposium on Exploring Attitude and
Affect in Text, pages 598–603.
B. Pang and L. Lee. 2002. Thumbs up? Sentiment classification
using machine learning techniques. In EMNLP 2002.
B. Pang and L. Lee. 2004. A sentimental education: Sentiment
analysis using subjectivity summarization based on minimum
cuts. In ACL 2004, pages 271–278.
B. Pang and L. Lee. 2005. Seeing stars: Exploiting class relation-
ships for sentiment categorization with respect to rating scales.
In ACL 2005.
A M. Popescu and O. Etzioni. 2005. Extracting product features
and opinions from reviews. In HLT/EMNLP 2005.
B. Snyder and R. Barzilay. 2007. Multiple aspect ranking using
the good grief algorithm. In HLT-NAACL 2007.
J.R. Quinlan. 1992. C4.5: Programs for Machine Learning.
Morgan Kaufmann Publishers, Inc.
P. Resnick, K. Kuwabara, R. Zeckhauser, and E. Friedman. 2000.
Reputation systems. CACM, 43(12):45–48, December.
P.D. Turney and M.L. Littman. 2003. Measuring praise and
criticism: Inference of semantic orientation from association.
ACM Transactions on Information Systems, 21(4):315–346.
P.D. Turney. 2002. Thumbs up or thumbs down? Semantic ori-
entation applied to unsupervised classification of reviews. In
ACL 2002, pages 417–424.
T. Wilson, J. Wiebe, and R. Hwa. 2006. Recognizing strong and
weak opinion clauses. Computational Intell., 22(2):73–99.
423