Báo cáo khoa học: "Exploring and Exploiting the Limited Utility of Captions in Recognizing Intention in Information Graphics∗" pdf
Bạn đang xem bản rút gọn của tài liệu. Xem và tải ngay bản đầy đủ của tài liệu tại đây (178.15 KB, 8 trang )
Proceedings of the 43rd Annual Meeting of the ACL, pages 223–230,
Ann Arbor, June 2005.
c
2005 Association for Computational Linguistics
Exploring and Exploiting the Limited Utility of Captions in Recognizing
Intention in Information Graphics
∗
Stephanie Elzer
1
and Sandra Carberry
2
and Daniel Chester
2
and Seniz Demir
2
and
Nancy Green
3
and Ingrid Zukerman
4
and Keith Trnka
2
1
Dept. of Computer Science, Millersville University, Millersville, PA 17551
2
Dept. of Computer Science, University of Delaware, Newark, DE 19716
3
Dept. of Mathematical Sciences, Univ. of NC at Greensboro, Greensboro, NC 27402
4
School of CS & Software Engrg, Monash Univ., Clayton, Victoria 3800 Australia
Abstract
This paper presents a corpus study that ex-
plores the extent to which captions con-
tribute to recognizing the intended mes-
sage of an information graphic. It then
presents an implemented graphic interpre-
tation system that takes into account a va-
riety of communicative signals, and an
evaluation study showing that evidence
obtained from shallow processing of the
graphic’s caption has a significant impact
on the system’s success. This work is part
of a larger project whose goal is to provide
sight-impaired users with effective access
to information graphics.
1 Introduction
Language research has posited that a speaker or
writer executes a speech act whose intended mean-
ing he expects the listener to be able to deduce, and
that the listener identifies the intended meaning by
reasoning about the observed signals and the mutual
beliefs of author and interpreter (Grice, 1969; Clark,
1996). But as noted by Clark (Clark, 1996), lan-
guage is more than just words. It is any “signal” (or
lack of signal when one is expected), where a sig-
nal is a deliberate action that is intended to convey a
message.
Although some information graphics are only in-
tended to display data values, the overwhelming ma-
jority of the graphics that we have examined (taken
∗
Authors can be reached via email as fol-
lows: , ,
{carberry, chester, demir, trnka}@cis.udel.edu, In-
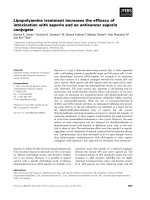
1998 1999 2000 2001
1000
1500
2000
2500
3000
personal filings
Local bankruptcy
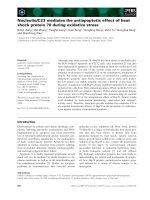
Figure 1: Graphic from a 2001 Local Newspaper
from newspaper, magazine, and web articles) ap-
pear to have some underlying goal or intended mes-
sage, such as the graphic in Figure 1 whose com-
municative goal is ostensibly to convey the sharp in-
crease in local bankruptcies in the current year com-
pared with the previous decreasing trend. Applying
Clark’s view of language, it is reasonable to presume
that the author of an information graphic expects the
viewer to deduce from the graphic the message that
the graphic was intended to convey, by reasoning
about the graphic itself, the salience of entities in
the graphic, and the graphic’s caption.
This paper adopts Clark’s view of language as any
deliberate signal that is intended to convey a mes-
sage. Section 3 investigates the kinds of signals used
in information graphics. Section 4 presents a cor-
pus study that investigates the extent to which cap-
tions capture the message of the graphic, illustrates
the issues that would arise in trying to fully under-
stand such captions, and proposes shallow process-
ing of the caption to extract evidence from it. Sec-
tion 5 then describes how evidence obtained from
a variety of communicative signals, including shal-
low processing of the graphic’s caption, is used in a
probabilistic system for hypothesizing the intended
message of the graphic. Section 6 presents an eval-
223
10
5
15
0−680+ 65−79 7−19 35−4980+65−7950−6435−49
10
5
15
20−347−190−6 20−3450−64
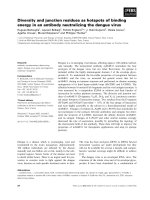
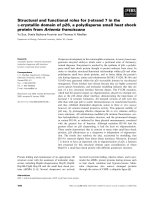
(a) (b)
Figure 2: Two Alternative Graphs from the Same Data
uation showing the system’s success, with particu-
lar attention given to the impact of evidence from
shallow processing of the caption, and Section 7 dis-
cusses future work.
Although we believe that our findings are ex-
tendible to other kinds of information graphics, our
current work focuses on bar charts. This research is
part of a larger project whose goal is a natural lan-
guage system that will provide effective access to
information graphics for individuals with sight im-
pairments, by inferring the intended message under-
lying the graphic, providing an initial summary of
the graphic that includes the intended message along
with notable features of the graphic, and then re-
sponding to follow-up questions from the user.
2 Related Work
Our work is related to efforts on graph summariza-
tion. (Yu et al., 2002) used pattern recognition tech-
niques to summarize interesting features of automat-
ically generated graphs of time-series data from a
gas turbine engine. (Futrelle and Nikolakis, 1995)
developed a constraint grammar for parsing vector-
based visual displays and producing representations
of the elements comprising the display. The goal
of Futrelle’s project is to produce a graphic that
summarizes one or more graphics from a document
(Futrelle, 1999). The summary graphic might be a
simplification of a graphic or a merger of several
graphics fromthe document, along with an appropri-
ate summary caption. Thus the end result of summa-
rization will itself be a graphic. The long range goal
of our project, on the other hand, is to provide alter-
native access to information graphics via an initial
textual summary followed by an interactive follow-
up component for additional information. The in-
tended message of the graphic will be an important
component of the initial summary, and hypothesiz-
ing it is the goal of our current work.
3 Evidence about the Intended Message
The graphic designer has many alternative ways of
designing a graphic; different designs contain differ-
ent communicative signals and thus convey differ-
ent communicative intents. For example, consider
the two graphics in Figure 2. The graphic in Fig-
ure 2a conveys that average doctor visits per year
is U-shaped by age; it starts out high when one is
very young, decreases into middle age, and then
rises again as one ages. The graphic in Figure 2b
presents the same data; but instead of conveying a
trend, this graphic seems to convey that the elderly
and theyoung have thehighest number of doctor vis-
its per year. These graphics illustrate how choice of
design affects the message that the graphic conveys.
Following the AutoBrief work (Kerpedjiev and
Roth, 2000) (Green et al., 2004) on generating
graphics that fulfill communicative goals, we hy-
pothesize thatthe designerchooses a design that best
facilitates the perceptual and cognitive tasks that
are most important to conveying his intended mes-
sage, subject to the constraints imposed by compet-
ing tasks. By perceptual tasks we mean tasks that
can be performed by simply viewing the graphic,
such as finding the top of a bar in a bar chart; by
cognitive tasks we mean tasks that are done via men-
tal computations, such as computing the difference
between two numbers.
Thus one source of evidence about the intended
message is the relative difficulty of the perceptual
tasks that the viewer would need to perform in order
to recognize the message. For example, determining
224
the entity with maximum value in a bar chart will be
easiest if the bars are arranged in ascending or de-
scending order of height. We have constructed a set
of rules, based on research by cognitive psycholo-
gists, that estimate the relative difficulty of perform-
ing different perceptual tasks; these rules have been
validated by eye-tracking experiments and are pre-
sented in (Elzer et al., 2004).
Another source of evidence is entities that have
been made salient in the graphic by some kind of fo-
cusing device, such as coloring some elements of the
graphic, annotations such as an asterisk, or an arrow
pointing to a particular location in a graphic. Enti-
ties that have been made salient suggest particular
instantiations of perceptual tasks that the viewer is
expected to perform, such as comparing the heights
of two highlighted bars in a bar chart.
And lastly, one would expect captions to helpcon-
vey the intended message of an information graphic.
The next section describes a corpus study that we
performed in order to explore the usefulness of cap-
tions and how we might exploit evidence from them.
4 A Corpus Study of Captions
Although one might suggest relying almost ex-
clusively on captions to interpret an information
graphic, (Corio and Lapalme, 1999) found in a cor-
pus study that captions are often very general. The
objective of their corpus study was to categorize the
kinds of information in captions so that their find-
ings could be used in forming rules for generating
graphics with captions.
Our project is instead concerned with recogniz-
ing the intended message of an information graphic.
To investigate how captions might be used in a sys-
tem for understanding information graphics, we per-
formed a corpus study in which we analyzed the
first 100 bar charts from our corpus of information
graphics; this corpus contains a variety of bar charts
from different publication venues. The following
subsections present the results of this corpus study.
4.1 Do Captions Convey the Intended
Message?
Our first investigation explored the extent to which
captions capture the intended message of an infor-
mation graphic. We extracted the first 100 graphics
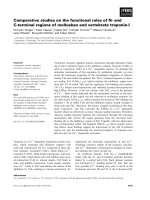
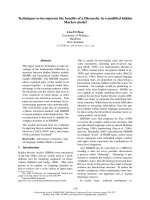
Category #
Category-1: Captures intention (mostly) 34
Category-2: Captures intention (somewhat) 15
Category-3: Hints at intention 7
Category-4: No contribution to intention 44
Figure 3: Analysis of 100 Captions on Bar Charts
from our corpus of bar charts. The intended mes-
sage of each bar chart had been previously annotated
by two coders. The coders were asked to identify
1) the intended message of the graphic using a list
of 12 high-level intentions (see Section 5 for exam-
ples) and 2) the instantiation of the parameters. For
example, if the coder classified the intended mes-
sage of a graphic as Change-trend, the coder was
also asked to identify where the first trend began,
its general slope (increasing, decreasing, or stable),
where the change in trend occurred, the end of the
second trend, and the slope of the second trend. If
there was disagreement between the coders on either
the intention or the instantiation of the parameters,
we utilized consensus-based annotation (Ang et al.,
2002), in which the coders discussed the graphic to
try to come to an agreement. As observed by (Ang
et al., 2002), this allowed us to include the “harder”
or less obvious graphics in our study, thus lowering
our expected system performance. We then exam-
ined the caption of each graphic, and determined to
what extent the caption captured the graphic’s in-
tended message. Figure 3 shows the results. 44%
of the captions in our corpus did not convey to any
extent the message of the information graphic. The
following categorizes the purposes that these cap-
tions served, along with an example of each:
• general heading (8 captions): “UGI Monthly
Gas Rates” on a graphic conveying a recent
spike in home heating bills.
• reference to dependent axis (15 captions):
“Lancaster rainfall totals for July” on a
graphic conveying that July-02 was the driest
of the previous decade.
• commentary relevant to graphic (4 captions):
“Basic performers: One look at the best per-
forming stocks in the Standard&Poor’s 500 in-
dex this year shows that companies with ba-
sic businesses are rewarding investors” on a
225
graphic conveying the relative rank of different
stocks, some of which were basic businesses
and some of which were not. This type of in-
formation was classified as deductive by (Corio
and Lapalme, 1999) since it draws a conclusion
from the data depicted in the graphic.
• commentary extending message of graphic (8
captions): “Profits are getting squeezed” on
a graphic conveying that Southwest Airlines
net income is estimated to increase in 2003 af-
ter falling the preceding three years. Here the
commentary does not draw a conclusion from
the data in the graphic but instead supplements
the graphic’s message. However this type of
caption would probably fall into the deductive
class in (Corio and Lapalme, 1999).
• humor (7 captions): “The Sound of Sales” on
a graphic conveying the changing trend (down-
ward after years of increase) in record album
sales. This caption has nothing to do with the
change-trend message of the graphic, but ap-
pears to be an attempt at humor.
• conclusion unwarranted by graphic (2 cap-
tions): “Defense spending declines” on a
graphic that in fact conveys that recent defense
spending is increasing.
Slightly over half the captions (56%) contributed
to understanding the graphic’s intended message.
34% were judged to convey most of the intended
message. For example, the caption “Tennis play-
ers top nominees” appeared on a graphic whose in-
tended message is to convey that more tennis players
were nominated for the 2003 Laureus World Sports
Award than athletes from any other sport. Since we
argue that captions alone are insufficient for inter-
preting information graphics, in the few cases where
it was unclear whether a caption should be placed
in Category-1 or Category-2, we erred on the side
of over-rating the contribution of a caption to the
graphic’s intended message. For example, consider
the caption “Chirac is riding high in the polls”
which appeared on a graphic conveying that there
has been a steady increase in Chirac’s approval rat-
ings from 55% to about 75%. Although this caption
does not fully capture the communicative intention
of the graphic (since it does not capture the steady
increase conveyed by the graphic), we placed it in
the first category since one might argue that riding
high in the polls would suggest both high and im-
proving ratings.
15% of the captions were judged to convey only
part of the graphic’s intended message; an example
is “Drug spending for young outpace seniors” that
appears on a graphic whose intended message ap-
pears to be that there is a downward trend by age for
increased drug spending; we classified the caption
in Category-2 since the caption fails to capture that
the graphic is talking about percent increases in drug
spending, not absolute drug spending, and that the
graphic conveys the downward trend for increases in
drug spending by age group, not just that increases
for the young were greater than for the elderly.
7% of the captions were judged to only hint at the
graphic’s message. An example is “GM’s Money
Machine” which appeared on a graphic whose in-
tended message was a contrast of recent perfor-
mance against the previous trend — ie., that al-
though there had been a steady decrease in the per-
centage of GM’s overall income produced by its fi-
nance unit, there was now a substantial increase in
the percentage provided by the finance unit. Since
the term money machine is a colloquialism that sug-
gests making a lot of money, the caption was judged
to hint at the graphic’s intended message.
4.2 Understanding Captions
For the 49 captions in Category 1 or 2 (where the
caption conveyed at least some of the message of
the graphic), we examined how well the caption
could be parsed and understood by a natural lan-
guage system. We found that 47% were fragments
(for example, “A Growing Biotech Market”), or in-
volved some other kind of ill-formedness (for ex-
ample, “Running tops in sneaker wear in 2002” or
“More seek financial aid”
1
). 16% would require ex-
tensive domain knowledge or analogical reasoning
to understand. One example is “Chirac is riding
high in the polls” which would require understand-
ing the meaning of riding high in the polls. Another
example is “Bad Moon Rising”; here the verb ris-
ing suggests that something is increasing, but the
1
Here we judge the caption to be ill-formed due to the ellip-
sis since More should be More students.
226
system would need to understand that a bad moon
refers to something undesirable (in this case, delin-
quent loans).
4.3 Simple Evidence from Captions
Although our corpus analysis showed that captions
can be helpful in understanding the message con-
veyed by an information graphic, it also showed that
full understanding of a caption would be problem-
atic; moreover, once the caption was understood, we
would still need to relate it to the information ex-
tracted from the graphic itself, which appears to be
a difficult problem.
Thus webegan investigating whether shallow pro-
cessing of the caption might provide evidence that
could be effectively combined with other evidence
obtained from the graphic itself. Our analysis pro-
vided the following observations:
• Verbs in a caption often suggest the kind of
message being conveyed by the graphic. An
example from our corpus is “Boating deaths
decline”; the verb decline suggests that the
graphic conveys a decreasing trend. Another
example from our corpus is “American Express
total billings still lag”; the verb lag suggests
that the graphic conveys that some entity (in
this case American Express) is ranked behind
some others.
• Adjectives in a caption also often suggest the
kind ofmessage being conveyed bythe graphic.
An example from our corpus is “Air Force has
largest percentage of women”; the adjective
largest suggests that the graphic is conveying
an entity whose value is largest. Adjectives de-
rived from verbs function similarly to verbs.
An example from our corpus is “Soaring De-
mand for Servers” which is the caption on a
graphic that conveys the rapid increase in de-
mand for servers. Here the adjective soaring is
derived from the verb soar, and suggests that
the graphic is conveying a strong increase.
• Nouns in a caption often refer to an entity that
is a label on the independent axis. When this
occurs, the caption brings the entity into focus
and suggests that it is part of the intended mes-
sage of the graphic. An example from our cor-
pus is “Germans miss their marks” where the
graphic displays a bar chart that is intended to
convey that Germans are the least happy with
the Euro. Words that usually appear as verbs,
but are used in the caption as a noun, may func-
tion similarly to verbs. An example is “Cable
On The Rise”; in this caption, rise is used as a
noun, but suggeststhat thegraphic isconveying
an increase.
5 Utilizing Evidence
We developed and implemented a probabilistic
framework for utilizing evidence from a graphic and
its caption to hypothesize the graphic’s intended
message. To identify the intended message of a
new information graphic, the graphic is first given
to a Visual Extraction Module (Chester and Elzer,
2005) that is responsible for recognizing the indi-
vidual components of a graphic, identifying the re-
lationship of the components to one another and to
the graphic as a whole, and classifying the graphic
as to type (bar chart, line graph, etc.); the result is
an XML file that describes the graphic and all of its
components.
Next a Caption Processing Module analyzes the
caption. To utilize verb-related evidence from cap-
tions, we identified a set of verbs that would indicate
each category of high-level goal
2
, such as recover
for Change-trend and
beats
for Relative-difference;
we then extended the set of verbs by examining
WordNet for verbs thatwere closely related in mean-
ing, and constructed a verb class for each set of
closely related verbs. Adjectives such as more and
most were handled in a similar manner. The Caption
Processing Module applies a part-of-speech tagger
and a stemmer to the caption in order to identify
nouns, adjectives, and the root form of verbs and
adjectives derived from verbs. The XML represen-
tation of the graphic is augmented to indicate any
independent axis labels that match nouns in the cap-
tion, and the presence of a verb or adjective class in
the caption.
The Intention Recognition Module then analyzes
the XML file to build the appropriate Bayesian net-
work; the current system is limited to bar charts, but
2
As described in the next paragraph, there are 12 categories
of high-level goals.
227
the principles underlying the system should be ex-
tendible to other kinds of information graphics. The
network is described in (Elzer et al., 2005). Very
briefly, our analysis of simple bar charts has shown
that the intended message can be classified into one
of 12 high-level goals; examples of such goals in-
clude:
• Change-trend: Viewer to believe that there
is a <slope-1> trend from <param1>
to <param2> and a significantly differ-
ent <slope-2> trend from <param3> to
<param4>
• Relative-difference: Viewer to believe that the
value of element <param1> is <comparison>
the value of element <param2> where
<comparison> is greater-than, less-than, or
equal-to.
Each category of high-level goal is represented by a
node in the network (whose parent is the top-level
goal node), and instances of these goals (ie., goals
with their parameters instantiated) appear as chil-
dren with inhibitory links (Huber et al., 1994) cap-
turing their mutual exclusivity. Each goal is broken
down further into subtasks (perceptual or cognitive)
that the viewer would need to perform in order to
accomplish the goal of the parent node. The net-
work is built dynamically when the system is pre-
sented with a new information graphic, so that nodes
are added to the network only as suggested by the
graphic. For example, low-level nodes are added for
the easiest primitive perceptual tasks and for per-
ceptual tasks in which a parameter is instantiated
with a salient entity (such as an entity colored dif-
ferently from others in the graphic or an entity that
appears as a noun in the caption), since the graphic
designer might have intended the viewer to perform
these tasks; then higher-level goals thatinvolve these
tasks are added, until eventually a link is established
to the top-level goal node.
Next evidence nodes are added to the network to
capture the kinds of evidence noted in Sections 3
and 4.3. For example, evidence nodes are added to
the network as children of each low-level perceptual
task; these evidence nodes capture the relative dif-
ficulty (categorized as easy, medium, hard, or im-
possible) of performing the perceptual task as esti-
mated by our effort estimation rules mentioned in
Section 3, whether a parameter in the task refers to
an entity that is salient in the graphic, and whether
a parameter in the task refers to an entity that is a
noun in the caption. An evidence node, indicating
for each verb class whether that verb class appears
in the caption (either as a verb, or as an adjective de-
rived from a verb, or as a noun that can also serve as
a verb) is added as a child of the top level goal node.
Adjectives such as more and most that provide evi-
dence are handled in a similar manner.
In a Bayesian network, conditional probability ta-
bles capture the conditional probability of a child
node given the value of its parent(s). For example,
the network requires the conditional probability of
an entity appearing as a noun in the caption given
that recognizing the intended message entails per-
forming a particular perceptual task involving that
entity. Similarly, the network requires the condi-
tional probability, for each class of verb, that the
verb class appears in the caption given that the in-
tended message falls into a particular intention cat-
egory. These probabilities are learned from our cor-
pus of graphics, as described in (Elzer et al., 2005).
6 Evaluation
In this paper, we are particularly interested in
whether shallow processing of captions can con-
tribute to recognizing the intended message of an
information graphic. As mentioned earlier, the in-
tended message of each information graphic in our
corpus of bar charts had been previously annotated
by two coders. To evaluate our approach, we used
leave-one-out cross validation. We performed a se-
ries of experiments in which each graphic in the cor-
pus is selected once as the test graphic, the probabil-
ity tables in the Bayesian network are learned from
the remaining graphics, and the test graphic is pre-
sented to the system as a test case. The system was
judged to fail if either its top-rated hypothesis did
not match the intended message that was assigned
to the graphic by the coders or the probability rat-
ing of the system’s top-rated hypothesis did not ex-
ceed 50%. Overall success was then computed by
averaging together the results of the whole series of
experiments.
Each experiment consisted of two parts, one in
228
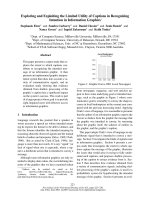
Diner’s Club
Discover
American Express
Mastercard
Visa
400 600200
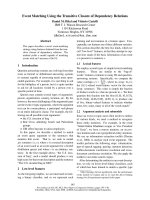
Total credit card purchases per year in billions
Figure 4: A Graphic from Business Week
3
which captions were not taken into account in the
Bayesian network and one in which the Bayesian
network included evidence from captions. Our
overall accuracy without the caption evidence was
64.5%, while the inclusion of caption evidence in-
creased accuracy to 79.1% for an absolute increase
in accuracy of 14.6% and a relative improvement of
22.6% over the system’s accuracy without caption
evidence. Thus we conclude that shallow process-
ing of a caption provides evidence that can be effec-
tively utilized in a Bayesian network to recognize
the intended message of an information graphic.
Our analysis of the results provides some interest-
ing insights on the role of elements of the caption.
There appear to be two primary functions of verbs.
The first is to reflect what is in the data, thereby
strengthening the message that would be recognized
without the caption. One example from our corpus
is a graphic with the caption “Legal immigration to
the U.S. has been rising for decades”. Although
the early part of the graphic displays a change from
decreasing immigration to a steadily increasing im-
migration trend, most of the graphic focuses on the
decades of increasing immigration and the caption
strengthens increasing trend in immigration as the
intended message of the graphic. If we do not in-
clude the caption, our system hypothesizes an in-
creasing trend message with a probability of 66.4%;
other hypotheses include an intended message that
emphasizes the change in trend with a probability
of 15.3%. However, when the verb increasing from
the caption is taken into account, the probability of
increasing trend in immigration being the intended
message rises to 97.9%.
3
This is a slight variation of the graphic from Business
Week. In the Business Week graphic, the labels sometimes ap-
The second function of a verb is to focus atten-
tion on some aspect of the data. For example, con-
sider the graphic in Figure 4. Without a caption, our
system hypothesizes that the graphic is intended to
convey the relative rank in billings of different credit
card issuers and assigns it a probability of 72.7%.
Other possibilities have some probability assigned
to them. For example, the intention of conveying
that Visa has the highest billings is assigned a prob-
ability of 26%. Suppose that the graphic had a cap-
tion of “Billings still lag”; if the verb lag is taken
into account, our system hypothesizes an intended
message of conveying the credit card issuer whose
billings are lowest, namely Diner’s Club; the prob-
ability assigned to this intention is now 88.4%, and
the probability assigned to the intention of convey-
ing the relative rank of different credit card issuers
drops to 7.8%. This is because the verb class con-
taining lag appeared in our corpus as part of the cap-
tion for graphics whose message conveyed an en-
tity with a minimum value, and not with graphics
whose message conveyed the relative rank of all the
depicted entities. On the other hand, if the caption
is “American Express total billings still lag” (which
is the caption associated with the graphic in our cor-
pus), then we have two pieces of evidence from the
caption — the verb lag, and the noun American Ex-
press which matches a label. In this case, the proba-
bilities change dramatically; the hypothesis that the
graphic is intended to convey the rank of American
Express (namely third behind Visa and Mastercard)
is assigned a probability of 76% and the probability
drops to 24% that the graphic is intended to con-
vey that Diner’s Club has the lowest billings. This is
not surprising. The presence of the noun American
Express in the caption makes that entity salient and
is very strong evidence that the intended message
places an emphasis on American Express, thus sig-
nificantly affecting the probabilities of the different
hypotheses. On the other hand, the verb class con-
taining lag occurred both in the caption of graphics
whose message was judged to convey the entity with
the minimum value and in the caption of graphics
pear on the bars and sometimes next to them, and the heading
for the dependent axis appears in the empty white space of the
graphic instead of below the values on the horizontal axis as we
show it. Our vision system does not yet have heuristics for rec-
ognizing non-standard placement of labels and axis headings.
229
that conveyed an entity ranked behind some others.
Therefore, conveying the entity with minimum value
is still assigned a non-negligible probability.
7 Future Work
It is rare that a caption contains more than one verb
class; when it does happen, our current system by
default uses the first one that appears. We need to
examine how to handle the occurrence of multiple
verb classes in a caption. Occasionally, labels in the
graphic appear differently in the caption. An exam-
ple is DJIA (for Dow Jones Industrial Average) that
occurs in one graphic as a label but appears as Dow
in the caption. We need to investigate resolving such
coreferences.
We currently limit ourselves to recognizing what
appears to be the primary communicative intention
of an information graphic; in the future we will also
consider secondary intentions. We will also extend
our work to other kinds of information graphics such
as line graphs and pie charts, and to complex graph-
ics, such as grouped and composite bar charts.
8 Summary
To our knowledge, our project is the first to inves-
tigate the problem of understanding the intended
message of an information graphic. This paper
has focused on the communicative evidence present
in an information graphic and how it can be used
in a probabilistic framework to reason about the
graphic’s intended message. The paper has given
particular attention to evidence provided by the
graphic’s caption. Our corpus study showed that
about half of all captions contain some evidence that
contributes to understanding the graphic’s message,
but that fully understanding captions is a difficult
problem. We presented a strategy for extracting ev-
idence from a shallow analysis of the caption and
utilizing it, along with communicative signals from
the graphic itself, in a Bayesian network that hy-
pothesizes the intended message of an information
graphic, and our results demonstrate the effective-
ness of our methodology. Our research is part of a
larger project aimed at providing alternative access
to information graphics for individuals with sight
impairments.
References
J. Ang, R. Dhillon, A. Krupski, E. Shriberg, and A. Stol-
cke. 2002. Prosody-based automatic detection of an-
noyance and frustration in human-computer dialog. In
Proc. of the Int’l Conf. on Spoken Language Process-
ing (ICSLP).
D. Chester and S. Elzer. 2005. Getting computers to see
information graphics so users do not have to. To ap-
pear in Proc. of the 15th Int’l Symposium on Method-
ologies for Intelligent Systems.
H. Clark. 1996. Using Language. Cambridge University
Press.
M. Corio and G. Lapalme. 1999. Generation of texts
for information graphics. In Proc. of the 7th European
Workshop on Natural Language Generation, 49–58.
S. Elzer, S. Carberry, N. Green, and J. Hoffman. 2004.
Incorporating perceptual task effort into the recogni-
tion of intention in information graphics. In Proceed-
ings of the 3rd Int’l Conference on Diagrams, LNAI
2980, 255–270.
S. Elzer, S. Carberry, I. Zukerman, D. Chester, N. Green,
S. Demir. 2005. A probabilistic framework for recog-
nizing intention in information graphics. To appear in
Proceedings of the Int’l Joint Conf. on AI (IJCAI).
R. Futrelle and N. Nikolakis. 1995. Efficient analysis of
complex diagrams using constraint-based parsing. In
Proc. of the Third International Conference on Docu-
ment Analysis and Recognition.
R. Futrelle. 1999. Summarization of diagrams in docu-
ments. In I. Mani and M. Maybury, editors, Advances
in Automated Text Summarization. MIT Press.
Nancy Green, Giuseppe Carenini, Stephan Kerpedjiev,
Joe Mattis, Johanna Moore, and Steven Roth. Auto-
brief: an experimental system for the automatic gen-
eration of briefings in integrated text and information
graphics. International Journal of Human-Computer
Studies, 61(1):32–70, 2004.
H. P. Grice. 1969. Utterer’s Meaning and Intentions.
Philosophical Review, 68:147–177.
M. Huber, E. Durfee, and M. Wellman. 1994. The auto-
mated mapping of plans for plan recognition. In Proc.
of Uncertainty in AI, 344–351.
S. Kerpedjiev and S. Roth. 2000. Mapping communica-
tive goals into conceptual tasks to generate graphics in
discourse. In Proc. of Int. Conf. on Intelligent User
Interfaces, 60–67.
J. Yu, J. Hunter, E. Reiter, and S. Sripada. 2002.
Recognising visual patterns to communicate gas tur-
bine time-series data. In ES2002, 105–118.
230