Báo cáo khoa học: "An Empirical Study of the Influence of Argument Conciseness on Argument Effectiveness" docx
Bạn đang xem bản rút gọn của tài liệu. Xem và tải ngay bản đầy đủ của tài liệu tại đây (1.44 MB, 8 trang )
An Empirical Study of the Influence of Argument Conciseness on
Argument Effectiveness
Giuseppe Carenini
Intelligent Systems Program
University of Pittsburgh,
Pittsburgh, PA 15260, USA
Johanna D. Moore
The Human Communication Research Centre,
University of Edinburgh,
2 Buccleuch Place, Edinburgh EH8 9LW, UK.
Abstract
We have developed a system that generates
evaluative arguments that are tailored to the
user, properly arranged and concise. We have
also developed an evaluation framework in
which the effectiveness of evaluative arguments
can be measured with real users. This paper
presents the results of a formal experiment we
have performed in our framework to verify the
influence of argument conciseness on argument
effectiveness
1 Introduction
Empirical methods are critical to gauge the
scalability and robustness of proposed
approaches, to assess progress and to stimulate
new research questions. In the field of natural
language generation, empirical evaluation has
only recently become a top research priority
(Dale, Eugenio et al. 1998). Some empirical
work has been done to evaluate models for
generating descriptions of objects and processes
from a knowledge base (Lester and Porter March
1997), text summaries of quantitative data
(Robin and McKeown 1996), descriptions of
plans (Young to appear) and concise causal
arguments (McConachy, Korb et al. 1998).
However, little attention has been paid to the
evaluation of systems generating evaluative
arguments, communicative acts that attempt to
affect the addressee’s attitudes (i.e. evaluative
tendencies typically phrased in terms of like and
dislike or favor and disfavor).
The ability to generate evaluative arguments is
critical in an increasing number of online
systems that serve as personal assistants,
advisors, or shopping assistants
1
. For instance, a
shopping assistant may need to compare two
similar products and argue why its current user
should like one more than the other.
1
See for instance www.activebuyersguide.com
In the remainder of the paper, we first describe a
computational framework for generating
evaluative arguments at different levels of
conciseness. Then, we present an evaluation
framework in which the effectiveness of
evaluative arguments can be measured with real
users. Next, we describe the design of an
experiment we ran within the framework to
verify the influence of argument conciseness on
argument effectiveness. We conclude with a
discussion of the experiment’s results.
2 Generating concise evaluative
arguments
Often an argument cannot mention all the
available evidence, usually for the sake of
brevity. According to argumentation theory, the
selection of what evidence to mention in an
argument should be based on a measure of the
evidence strength of support (or opposition) to
the main claim of the argument (Mayberry and
Golden 1996). Furthermore, argumentation
theory suggests that for evaluative arguments the
measure of evidence strength should be based on
a model of the intended reader’s values and
preferences.
Following argumentation theory, we have
designed an argumentative strategy for
generating evaluative arguments that are
properly arranged and concise (Carenini and
Moore 2000). In our strategy, we assume that
the reader’s values and preferences are
represented as an additive multiattribute value
function (AMVF), a conceptualization based on
multiattribute utility theory (MAUT)(Clemen
1996). This allows us to adopt and extend a
measure of evidence strength proposed in
previous work on explaining decision theoretic
advice based on an AMVF (Klein1994).
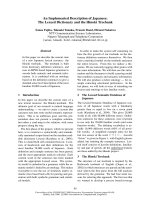
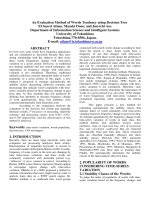
Figure 1 Sample additive multiattribute value function (AMVF)
The argumentation strategy has been
implemented as part of a complete argument
generator. Other modules of the generator
include a microplanner,
which performs
aggregation, pronominalization and makes
decisions about cue phrases and scalar
adjectives, along with a sentence realizer, which
extends previous work on realizing evaluative
statements (Elhadad 1995).
2.1 Background on AMVF
An AMVF is a model of a person’s values and
preferences with respect to entities in a certain
class. It comprises a value tree and a set of
component value functions, one for each
primitive attribute of the entity. A value tree is a
decomposition of the value of an entity into a
hierarchy of aspects of the entity
2
, in which the
leaves correspond to the entity primitive
attributes (see Figure 1 for a simple value tree in
the real estate domain). The arcs of the tree are
weighted to represent the importance of the
value of an objective in contributing to the value
of its parent in the tree (e.g., in Figure 1 location
is more than twice as important as size in
determining the value of a house). Note that the
sum of the weights at each level is equal to 1. A
component value function for an attribute
expresses the preferability of each attribute
value as a number in the [0,1] interval. For
instance, in Figure 1 neighborhood n2 has
preferability 0.3, and a distance-from-park of 1
mile has preferability (1 - (1/5 * 1))=0.8).
2
In decision theory these aspects are called
objectives
. For consistency with previous work, we
will follow this terminology in the remainder of the
paper.
Formally, an AMVF predicts the value
)(ev
of
an entity e as follows:
v(e) = v(x
1
,…,x
n
) =
Σ
w
i
v
i
(x
i
), where
- (x
1
,…,x
n
) is the vector of attribute values for an
entity e
- ∀attribute i, v
i
is the component value function,
which maps the least preferable x
i
to 0, the most
preferable to 1, and the other x
i
to values in [0,1]
- w
i
is the weight for attribute i, with 0
≤
w
i
≤
1
and
Σ
w
i
=1
- w
i
is equal to the product of all the weights
from the root of the value tree to the attribute i
A function v
o
(e) can also be defined for each
objective. When applied to an entity, this
function returns the value of the entity with
respect to that objective. For instance, assuming
the value tree shown in Figure 1, we have:
))
(
6
.
0
(
))
(
4
.
0
(
)
(
e
v
e
v
e
v
park
from
Dist
od
Neighborho
Location
−
−
∗
+
∗
=
=
Thus, given someone’s AMVF, it is possible to
compute how valuable an entity is to that
individual. Furthermore, it is possible to
compute how valuable any objective (i.e., any
aspect of that entity) is for that person. All of
these values are expressed as a number in the
interval [0,1].
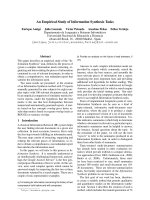
2.2 A measure of evidence strength
Given an AMVF for a user applied to an entity
(e.g., a house), it is possible to define a precise
measure of an objective strength in determining
the evaluation of its parent objective for that
entity. This measure is proportional to two
factors: (A) the weight of the objective
µ
+δ
−δ
k
=1
k
= -1
k
= 0
compellingness
Figure 2 Sample population of objectives
represented by dots and ordered by their
compellingness
(which is by itself a measure of importance), (B)
a factor that increases equally for high and low
values of the objective, because an objective can
be important either because it is liked a lot or
because it is disliked a lot. We call this measure
s-compellingness and provide the following
definition:
s-compellingness(o, e, refo) = (A)
∗
(B) =
= w(o,refo)
∗
max[[v
o
(e)]; [1 – v
o
(e)]], where
−
o is an objective, e is an entity, refo is an
ancestor of o in the value tree
− w(o,refo) is the product of the weights of all
the links from o to refo
−
v
o
is the component value function for leaf
objectives (i.e., attributes), and it is the
recursive evaluation over children(o) for
nonleaf objectives
Given a measure of an objective's strength, a
predicate indicating whether an objective should
be included in an argument (i.e., worth
mentioning) can be defined as follows:
s-notably-compelling?(o,opop,e, refo)
≡
s-compellingness(o, e, refo)
>
µ
x
+k
σ
x
, where
−
o, e, and refo are defined as in the previous
Def; opop is an objective population (e.g.,
siblings(o)), and
opop
>2
−
p
∈
opop; x
∈
X =
s-compellingness(p, e,
refo)
− µ
x
is the mean of X,
σ
x
is the standard
deviation and k is a user-defined constant
Similar measures for the comparison of two
entities are defined and extensively discussed in
(Klein 1994).
2.3 The constant k
In the definition of s-notably-compelling?, the
constant k determines the lower bound of s-
compellingness for an objective to be included
in an argument. As shown in Figure 2, for k=0
only objectives with s-compellingness greater
Figure 3 Arguments about the same house,
tailored to the same subject but with k ranging
from 1 to –1
than the average s-compellingness in a
population are included in the argument (4 in the
sample population). For higher positive values
of k less objectives are included (only 2, when
k=1), and the opposite happens for negative
values (8 objectives are included, when k=-1).
Therefore, by setting the constant k to different
values, it is possible to control in a principled
way how many objectives (i.e., pieces of
evidence) are included in an argument, thus
controlling the degree of conciseness of the
generated arguments.
Figure 3 clearly illustrates this point by showing
seven arguments generated by our argument
generator in the real-estate domain. These
arguments are about the same house, tailored to
the same subject, for k ranging from 1 to –1.
3 The evaluation framework
In order to evaluate different aspects of the
argument generator, we have developed an
evaluation framework based on the task efficacy
evaluation method. This method allows
Figure 4 The evaluation framework architecture
the experimenter to evaluate a generation model
by measuring the effects of its output on user’s
behaviors, beliefs and attitudes in the context of
a task.
Aiming at general results, we chose a rather
basic and frequent task that has been extensively
studied in decision analysis: the selection of a
subset of preferred objects (e.g., houses) out of a
set of possible alternatives. In the evaluation
framework that we have developed, the user
performs this task by using a computer
environment (shown in Figure 5) that supports
interactive data exploration and analysis (IDEA)
(Roth, Chuah et al. 1997). The IDEA
environment provides the user with a set of
powerful visualization and direct manipulation
techniques that facilitate the user’s autonomous
exploration of the set of alternatives and the
selection of the preferred alternatives.
Let’s examine now how an argument generator
can be evaluated in the context of the selection
task, by going through the architecture of the
evaluation framework.
3.1 The evaluation framework architecture
Figure 4 shows the architecture of the evaluation
framework. The framework consists of three
main sub-systems: the IDEA system, a User
Model Refiner and the Argument Generator. The
framework assumes that a model of the user’s
preferences (an AMVF) has been previously
acquired from the user, to assure a reliable initial
model.
At the onset, the user is assigned the task to
select from the dataset the four most preferred
alternatives and to place them in a Hot List (see
Figure 5, upper right corner) ordered by
preference. The IDEA system supports the user
in this task (Figure 4 (1)). As the interaction
unfolds, all user actions are monitored and
collected in the User’s Action History (Figure 4
(2a)). Whenever the user feels that the task is
accomplished, the ordered list of preferred
alternatives is saved as her Preliminary Decision
(Figure 4 (2b)). After that, this list, the User’s
Action History and the initial Model of User’s
Preferences are analysed by the User Model
Refiner (Figure 4 (3)) to produce a Refined
Model of the User’s Preferences (Figure 4 (4)).
At this point, the stage is set for argument
generation. Given the Refined Model of the
User’s Preferences, the Argument Generator
produces an evaluative argument tailored to the
model (Figure 4 (5-6)), which is presented to the
user by the IDEA system (Figure 4 (7)).The
argument goal is to introduce a new alternative
(not included in the dataset initially presented to
the user) and to persuade the user that the
alternative is worth being considered. The new
alternative is designed on the fly to be preferable
for the user given her preference model.
3-26
HotList
NewHouse 3-26
Figure 5 The IDEA environment display at the end of the interaction
All the information about the new alternative is
also presented graphically. Once the argument is
presented, the user may (a) decide immediately
to introduce the new alternative in her Hot List,
or (b) decide to further explore the dataset,
possibly making changes to the Hot List adding
the new instance to the Hot List, or (c) do
nothing. Figure 5 shows the display at the end of
the interaction, when the user, after reading the
argument, has decided to introduce the new
alternative in the Hot List first position (Figure
5, top right).
Whenever the user decides to stop exploring and
is satisfied with her final selections, measures
related to argument’s effectiveness can be
assessed (Figure 4 (8)). These measures are
obtained either from the record of the user
interaction with the system or from user self-
reports in a final questionnaire (see Figure 6 for
an example of self-report) and include:
- Measures of behavioral intentions and attitude
change: (a) whether or not the user adopts the
new proposed alternative, (b) in which position
in the Hot List she places it and (c) how much
she likes the new alternative and the other
objects in the Hot List.
- A measure of the user’s confidence that she has
selected the best for her in the set of alternatives.
- A measure of argument effectiveness derived
by explicitly questioning the user at the end of
the interaction about the rationale for her
decision (Olso and Zanna 1991). This can
provide valuable information on what aspects of
the argument were more influential (i.e., better
understood and accepted by the user).
- An additional measure of argument
effectiveness is to explicitly ask the user at the
end of the interaction to judge the argument with
respect to several dimensions of quality, such as
content, organization, writing style and
convincigness. However, evaluations based on
Figure 6 Self -report on user’s satisfaction with
houses in the HotList
Figure 7 Hypotheses on experiment outcomes
judgements along these dimensions are clearly
weaker than evaluations measuring actual
behavioural and attitudinal changes (Olso and
Zanna 1991).
To summarize, the evaluation framework just
described supports users in performing a
realistic task at their own pace by interacting
with an IDEA system. In the context of this task,
an evaluative argument is generated and
measurements related to its effectiveness can be
performed.
We now discuss an experiment that we have
performed within the evaluation framework
4 The Experiment
The argument generator has been designed to
facilitate testing the effectiveness of different
aspects of the generation process. The
experimenter can easily control whether the
generator tailors the argument to the current
user, the degree of conciseness of the argument
(by varying k as explained in Section 2.3), and
what microplanning tasks the generator
performs. In the experiment described here, we
focused on studying the influence of argument
conciseness on argument effectiveness. A
parallel experiment about the influence of
tailoring is described elsewhere.
We followed a between-subjects design with
three experimental conditions:
No-Argument - subjects are simply informed that
a new house came on the market.
Tailored-Concise - subjects are presented with
an evaluation of the new house tailored to their
preferences and at a level of conciseness that we
hypothesize to be optimal. To start our
investigation, we assume that an effective
argument (in our domain) should contain
slightly more than half of the available evidence.
By running the generator with different values
for k on the user models of the pilot subjects, we
found that this corresponds to k=-0.3. In fact,
with k=-0.3 the arguments contained on average
10 pieces of evidence out of the 19 available.
Tailored-Verbose - subjects are presented with
an evaluation of the new house tailored to their
preferences, but at a level of conciseness that we
hypothesize to be too low (k=-1, which
corresponds on average, in our analysis of the
pilot subjects, to 16 pieces of evidence out of the
possible 19).
In the three conditions, all the information about
the new house is also presented graphically, so
that no information is hidden from the subject.
Our hypotheses on the outcomes of the
experiment are summarized in Figure 7. We
expect arguments generated for the Tailored-
Concise condition to be more effective than
arguments generated for the Tailored-Verbose
condition. We also expect the Tailored-Concise
condition to be somewhat better than the No-
Argument condition, but to a lesser extent,
because subjects, in the absence of any
argument, may spend more time further
exploring the dataset, thus reaching a more
informed and balanced decision. Finally, we do
not have strong hypotheses on comparisons of
argument effectiveness between the No-
Argument and Tailored-Verbose conditions.
The experiment is organized in two phases. In
the first phase, the subject fills out a
questionnaire on the Web. The questionnaire
implements a method form decision theory to
acquire an AMVF model of the subject’s
preferences (Edwards and Barron 1994). In the
second phase of the experiment, to control for
possible confounding variables (including
subject’s argumentativeness (Infante and Rancer
1982), need for cognition (Cacioppo, Petty et al.
1983), intelligence and self-esteem), the subject
Tailored
Concise
Tailored
Verbose
No-Argument
>
>>
?
a)
How would you judge the houses in your Hot List?
The more you like the house the closer you should
put a cross to
“good choice”
1
st
house
bad choice : __:__:__:__
:
__
:
__:__:__:__: good choice
2
nd
house
bad choice
: __:__:__:__
:
__
:
__:__:__:__:
good choice
3
rd
house
bad choice
: __:__:__:__
:
__
:
__:__:__:__:
good choice
4
th
house
bad choice
: __:__:__:__
:
__
:
__:__:__:__:
good choice
Figure 8 Sample filled-out self-report on user’s
satisfaction with houses in the Hot List
3
is randomly assigned to one of the three
conditions.
Then, the subject interacts with the evaluation
framework and at the end of the interaction
measures of the argument effectiveness are
collected, as described in Section 3.1.
After running the experiment with 8 pilot
subjects to refine and improve the experimental
procedure, we ran a formal experiment involving
30 subjects, 10 in each experimental condition.
5 Experiment Results
5.1 A precise measure of satisfaction
According to literature on persuasion, the most
important measures of arguments effectiveness
are the ones of behavioral intentions and attitude
change. As explained in Section 3.1, in our
framework such measures include (a) whether or
not the user adopts the new proposed alternative,
(b) in which position in the Hot List she places
it, (c) how much she likes the proposed new
alternative and the other objects in the Hot List.
Measures (a) and (b) are obtained from the
record of the user interaction with the system,
whereas measures in (c) are obtained from user
self-reports.
A closer analysis of the above measures
indicates that the measures in (c) are simply a
more precise version of measures (a) and (b). In
fact, not only they assess the same information
as measures (a) and (b), namely a preference
ranking among the new alternative and the
objects in the Hot List, but they also offer two
additional critical advantages:
3
If the subject does not adopt the new house, she is
asked to express her satisfaction with the new house
in an additional self-report.
(i) Self-reports allow a subject to express
differences in satisfaction more precisely than
by ranking. For instance, in the self-report
shown in Figure 8, the subject was able to
specify that the first house in the Hot List was
only one space (unit of satisfaction) better then
the house preceding it in the ranking, while the
third house was two spaces better than the house
preceding it.
(ii) Self-reports do not force subjects to express
a total order between the houses. For instance, in
Figure 8 the subject was allowed to express that
the second and the third house in the Hot List
were equally good for her.
Furthermore, measures of satisfaction obtained
through self-reports can be combined in a single,
statistically sound measure that concisely
express how much the subject liked the new
house with respect to the other houses in the Hot
List. This measure is the z-score of the subject’s
self-reported satisfaction with the new house,
with respect to the self-reported satisfaction with
the houses in the Hot List. A z-score is a
normalized distance in standard deviation units
of a measure x
i
from the mean of a population X.
Formally:
x
i
∈
X; z-score( x
i
,X) = [x
i
-
µ
(X)] /
σ
(X)
For instance, the satisfaction z-score for the new
instance, given the sample self-reports shown in
Figure 8, would be:
[7 -
µ
({8,7,7,5})] /
σ
({8,7,7,5}) = 0.2
The satisfaction z-score precisely and concisely
integrates all the measures of behavioral
intentions and attitude change. We have used
satisfaction z-scores as our primary measure of
argument effectiveness.
5.2 Results
As shown in Figure 9, the satisfaction z-scores
obtained in the experiment confirmed our
hypotheses. Arguments generated for the
Tailored-Concise condition were significantly
more effective than arguments generated for
Tailored-Verbose condition. The Tailored-
Concise condition was also significantly better
than the No-Argument condition, but to a lesser
extent. Logs of the interactions suggest that this
happened because subjects in the No-Argument
condition spent significantly more time further
exploring the dataset. Finally, there was no
significant difference in argument effectiveness
a)
How would you judge the houses in your Hot List?
The more you like the house the closer you should
put a cross to
“good choice”
1
st
house
bad choice
: __:__:__:__
:
__
:
__:__:
X
:__:
good choice
2
nd
house(New house)
bad choice
: __:__:__:__
:
__
:
__:
X
:__:__:
good choice
3
rd
house
bad choice
: __:__:__:__
:
__
:
__:
X
:__:__:
good choice
4
th
house
bad choice
: __:__:__:__
:X
:
__:__:__:__:
good choice
Figure 9
Results for satisfaction z-scores. The
average z-scores for the three conditions are
shown in the grey boxes and the p-values are
reported beside the links
between the No-Argument and Tailored-
Verbose conditions.
With respect to the other measures of argument
effectiveness mentioned in Section 3.1, we have
not found any significant differences among the
experimental conditions.
6 Conclusions and Future Work
Argumentation theory indicates that effective
arguments should be concise, presenting only
pertinent and cogent information. However,
argumentation theory does not tell us what is the
most effective degree of conciseness. As a
preliminary attempt to answer this question for
evaluative arguments, we have compared in a
formal experiment the effectiveness of
arguments generated by our argument generator
at two different levels of conciseness. The
experiment results show that arguments
generated at the more concise level are
significantly better than arguments generated at
the more verbose level. However, further
experiments are needed to determine what is the
optimal level of conciseness.
Acknowledgements
Our thanks go to the members of the Autobrief
project: S. Roth, N. Green, S. Kerpedjiev and J.
Mattis. We also thank C. Conati for comments
on drafts of this paper. This work was supported
by grant number DAA-1593K0005 from the
Advanced Research Projects Agency (ARPA).
References
Cacioppo, J. T., R. E. Petty, et al. (1983). “Effects of
Need for Cognition on Message Evaluation, Recall,
and Persuasion.”
Journal of Personality and Social
Psychology
45
(4): 805-818.
Carenini, G. and J. Moore (2000). A Strategy for
Generating Evaluative Arguments. International
Conference on Natural Language Generation,
Mitzpe Ramon, Israel.
Clemen, R. T. (1996).
Making Hard Decisions: an
introduction to decision analysis.
Belmont,
California, Duxbury Press.
Dale, R., B. d. Eugenio, et al. (1998). “Introduction to
the Special Issue on Natural Language
Generation.”
Computational Linguistics
24
(3):
345-353.
Edwards, W. and F. H. Barron (1994). “SMARTS
and SMARTER: Improved Simple Methods for
Multi-attribute Utility Measurements.”
Organizational Behavior and Human Decision
Processes
60
: 306-325.
Elhadad, M. (1995). “Using argumentation in text
generation.”
Journal of Pragmatics
24
: 189-220.
Infante, D. A. and A. S. Rancer (1982). “A
Conceptualization and Measure of
Argumentativeness.”
Journal of Personality
Assessment
46
: 72-80.
Klein, D. (1994).
Decision Analytic Intelligent
Systems: Automated Explanation and Knowledge
Acquisition
, Lawrence Erlbaum Associates.
Lester, J. C. and B. W. Porter (March 1997).
“Developing and Empirically Evaluating Robust
Explanation Generators: The KNIGHT
Experiments.”
Computational Linguistics
23
(1):
65-101.
Mayberry, K. J. and R. E. Golden (1996).
For
Argument's Sake: A Guide to Writing Effective
Arguments
, Harper Collins, College Publisher.
McConachy, R., K. B. Korb, et al. (1998). Deciding
What Not to Say: An Attentional-Probabilistic
Approach to Argument Presentation. Cognitive
Science Conference.
Olso, J. M. and M. P. Zanna (1991). Attitudes and
beliefs ; Attitude change and attitude-behavior
consistency.
Social Psychology
. R. M. Baron and
W. G. Graziano.
Robin, J. and K. McKeown (1996). “Empirically
Designing and Evaluating a New Revision-Based
Model for Summary Generation.”
Artificial
Intelligence journal
85
: 135-179.
Roth, S. F., M. C. Chuah, et al. (1997). Towards an
Information Visualization Workspace: Combining
Multiple Means of Expression.
Human-Computer
Interaction Journal
.
Young, M. R. “Using Grice's Maxim of Quantity to
Select the Content of Plan Descriptions.”
Artificial
Intelligence Journal,
to appear
.
Tailored
Concise
Tailored
Verbose
No-Argument
>
?
0.88
0.05
0.25
0.02
>>
0.03
0.31