Tải bản đầy đủ (.pdf) (24 trang)

The economic Value of citizenship for immigrants in The united states ppt

Bạn đang xem bản rút gọn của tài liệu. Xem và tải ngay bản đầy đủ của tài liệu tại đây (3.03 MB, 24 trang )

The economic Value of ciTizenship
for immigranTs in The uniTed sTaTes
By Madeleine Sumption and Sarah Flamm
P
Q
(S)
(D)
NATIONAL CENTER ON IMMIGRANT INTEGRATION POLICY
US IMMIGRATION POLICY PROGRAM
THE ECONOMIC VALUE OF CITIZENSHIP
FOR IMMIGRANTS IN THE UNITED STATES
Madeleine Sumption and Sarah Flamm
Migration Policy Institute
September 2012
© 2012 Migration Policy Institute.
All Rights Reserved.









.

.


th





Suggested citation: 
2012. The Economic Value of Citizenship for Immigrants in the
United States. 
Acknowledgments

the John S. and James L. Knight Foundation






Table of Contents
Executive Summary 1
I. Introduction 2
II. Who Naturalizes, and Why? 
 
III. What Is the Economic Value of Naturalization? 11
IV. Conclusion 
Appendix: Changes in the Naturalized Population over Time 15
Works Cited 
About the Authors 
1


Executive Summary

Citizenship is widely recognized as an important symbol of full membership and participation in
society. By naturalizing, immigrants receive a range of rights and prerogatives available only to citizens.



Surveys suggest that political and social rights — particularly the right to vote — are the primary
motivation for naturalizing, alongside the desire for a sense of belonging. However, citizenship is



signal of good integration into US society or otherwise discriminate against noncitizens when hiring.
This report analyzes the impact of naturalization on immigrants, as well as the motivations for seeking

 For a variety of reasons, naturalized citizens earn more than their noncitizen counterparts,

citizens also appear to have weathered the effects of the economic crisis more successfully,
experiencing a decline in median annual earnings of 5 percent from 2006 to 2010, compared to

naturalized and noncitizen immigrants increased from 46 percent to 67 percent over the same
period.
 Most of the gap between citizens’ and noncitizens’ outcomes is explained by the fact that
naturalized immigrants have higher levels of education, better language skills, and more work
experience in the United States than noncitizens. Even after accounting for these differences,
however, there is some evidence that the naturalized may earn a wage premium of at least 5
percent. This premium is thought to be larger for Latino immigrants and for women.
 


born population — are eligible to apply.
 Immigrants are more likely to naturalize if they have high levels of education, speak English






 Naturalization rates in the United States are lower than in most other countries in the


The share of eligible immigrants who have naturalized is higher than most OECD member

Canada, which have made more active attempts to promote naturalization.
 
the application process, and the cost of applying, which at $680 is higher than in most other
OECD countries.
2


I. Introduction


to the native born, most notably the right to vote in national elections. By naturalizing, immigrants also

and the ability to travel abroad on a US passport.

citizens through naturalization. During the naturalization process, aspiring citizens must typically
demonstrate that they have achieved a certain level of integration into the host society by meeting
eligibility criteria or taking tests. However, naturalization is also a tool that can be used to encourage and
facilitate further
process.



1



long enough to be eligible. However, a substantial share of the noncitizen population — about 8 million,


Figure 1. Estimation of Legal Status among Foreign Born in United States, 2010
0
2,000,000
4,000,000
6,000,000
8,000,000
10,000,000
12,000,000
14,000,000
16,000,000
Naturalized Citizens LPRs Eligible to
Naturalize
LPRs Not Eligible Temporary Visa
Holders
Unauthorized
Noncitizens
Foreign Born in US by Category
Note: Department of Homeland Security estimates of the legal permanent resident (LPR) population in 2010 are 200,000
higher than Pew Hispanic Center estimates, which do not include a breakdown by eligibility status.
Sources: LPR gures from Nancy Rytina, Estimates of the Legal Permanent Resident Population in 2010 (Washington, DC:
Department of Homeland Security, 2011), www.dhs.gov/xlibrary/assets/statistics/publications/ois_lpr_pe_2010.pdf; citizens,
temporary visa holders, and unauthorized immigrant gures from Jeffrey S. Passel and D’Vera Cohn, Unauthorized

Immigrant Population: National and State Trends, 2010 (Washington DC: Pew Hispanic Center, 2011),
www.pewhispanic.org/les/reports/133.pdf.
1 




 Integrated Public Use Microdata Series: Version 5.0 




The total share of naturalized citizens in the US immigrant population is low in comparison with

respectively, as of 2006 were naturalized.
2

eligible to take US



Higher naturalization rates in these
countries are thought to result at least in part from more active efforts to promote citizenship, as well as

4







immigrant integration.
This report examines the role of naturalization as both an indicator and facilitator of successful

result, and why a substantial share of immigrants who appear to be eligible to naturalize are unable or

receive in the US labor market.
2 



Divergent Trends in Citizenship Rates among Immigrants in Canada and the
United States
Population Flows: Immigration Aspects 2009-2010 Edition
Naturalization: A Passport for
the Better Integration of Immigrants? 
.
 Population Flows, 166. Canadian data refer to all immigrants in the country for ten
years or longer in 2006 and are taken from OECD, Naturalization: A Passport for Better Integration.
4 Irene Bloemraad, Becoming a Citizen: Incorporating Immigrants and Refugees in the United States and Canada 
Divergent Trends in Citizenship Rates.
Citizenship is an important milestone along immigrants’ journey
toward full political and economic membership in their host society.



II. Who Naturalizes, and Why?

social considerations. Citizenship offers more security than permanent resident status, which can be lost
or revoked, and thus guarantees the permanent right to remain part of US society.

5
Naturalized citizens

able to sponsor a wider range of family members for immigration and to bring certain family members —

6

In surveys, immigrants have primarily emphasized political rights and the sense of belonging that

7

However, immigrants have also cited better economic opportunities as a reason for seeking citizenship.
8

Citizenship might be expected to improve employment prospects in a number of possible ways. First,


in the public sector than either naturalized citizens or the US born, according to labor force data.
9
Since


federal contractors in work requiring a security clearance may prefer to hire citizens. Finally, access to
certain licensed professions requires citizenship, although their number has declined over time and the
requirement is not always enforced.
10
Outside of these occupations, some employers may simply prefer to hire citizens over noncitizens.
For example, they might perceive the administrative costs of hiring a citizen to be lower than hiring a



US passport as a guarantee that the worker is not unauthorized.
11
Employers may also view citizenship
5 
spend substantial periods outside of the country and are deemed by US authorities to have abandoned their permanent
residence.
6 In particular, US citizens can sponsor their spouses, parents, and unmarried minor children without numerical limits, while
permanent residents must wait longer for visas to become available.
7 
A Place to Call Home:
What Immigrants Say Now About Life In America

application workshop in 2010 found that the right to vote was the most important factor, as did an earlier poll of recently
Catalysts and Barriers to Attaining Citizenship: An Analy-
sis of ya es hora Ciudadania! www.nclr.org/images/uploads/publica



The Making of Americans: Results of the Texas
Naturalization Survey
8 

opportunities. These surveys allowed respondents to cite multiple reasons. By contrast, the survey of citizenship workshop
most important reason
A Place to Call HomeThe Making of Americans; 
Catalysts and Barriers to Attaining Citizenship.
9 

10 
International Migration Review 

11 Employers are required to accept a number of other documents demonstrating lawful residence, including a green card, but


5


as a signal of better social and cultural integration, motivation, or a commitment to stay in the country
permanently — discrimination that is legal in many circumstances.
12
Indeed, naturalized citizens do tend


networks and cultural knowledge.



The 1996 reforms sharply reduced welfare


of work with legal status.
14

eligibility requirements.



15
It is not clear to what extent access
to welfare may have motivated further applications, since immigrants’ welfare use is not thought to
increase after naturalization.

16
Increased citizenship applications may also have resulted from the

immigrant sentiment and a desire among immigrants to secure their status, as well as various campaigns
encouraging immigrants to naturalize.
17


12 Employers are allowed to prefer a US citizen over a permanent resident on the basis of citizenship status if the two individu

residents who have been eligible for naturalization for at least six months but have not applied for it and in cases where the
.
 The Impact of Welfare Reform on Immigrant Welfare Use
.
14 
sponsored for permanent residence by a working family member.
15 The number of green cards issued exceeded 1 million per year from 1989 to 1991, reaching the historic peak of more than
1,800,000 in 1991. The 1986 Immigration Reform and Control Act 
Yearbook of Immigration Statistics: 2011
.
16 Trends in Naturalization




.
17 Immigrants to Citizens
.
Naturalized citizens do tend to have higher levels of


6
MIGRATION POLICY INSTITUTE
The Economic Value of Citizenship for Immigrants in the United States
Figure 2. Naturalization Applications Filed, 1980-2011
0
200,000
400,000
600,000
800,000
1,000,000
1,200,000
1,400,000
1980
1981
1982
1983
1984
1985
1986
1987
1988
1989
1990
1991
1992
1993
1994
1995
1996
1997

1998
1999
2000
2001
2002
2003
2004
2005
2006
2007
2008
2009
2010
2011
Naturalization Application Filings
Year
Source: DHS, Yearbook of Immigration Statistics: 2011, Table 20 (Washington, DC: DHS, 2012)
www.dhs.gov/les/statistics/publications/YrBk11Na.shtm.
Determinants of Naturalization and Barriers to Citizenship
Naturalization rates depend on a complex range of factors that shape immigrants’ ability to meet
eligibility criteria on the one hand, and their motivation to naturalize on the other. To naturalize,
immigrants must already hold lawful permanent residence,
18
demonstrate their English language

19
pass a

20
and pay an application fee of $680.

21


delaying or discouraging applications, especially among low-income immigrants.
22
Immigrants living on
very low incomes can apply for a fee waiver,
23
but the threshold is quite low and applicants still face other
18 -


receiving a green card, the effective residency requirement for most employment-based immigrants is longer. The waiting

Trends,” Migration Information Source, August 2009, www.migrationinformation.org/Feature/display.cfm?id=737.
19 Exceptions to the English language test are in place for immigrants over the age of 55 who have been in the country for at
least 15 years, those over the age of 50 who have been in the country for at least 20 years, and those with disabilities.
20 Immigrants may become ineligible if convicted of an aggravated felony, controlled substance violation, prostitution, earning
-

0-23319/0-0-0-24712.html.
21 This includes a fee for the collection of biometric data. For a detailed description of eligibility requirements and the natural-
.
22 


;

Naturalisation Policies in Europe: Exploring Patterns of Inclusion and Exclusion 
.

23 Fee waivers are available for a wide range of immigration applications, but are granted most often for naturalization.



costs such as transportation and the value of the time spent preparing their application and studying
for the language and civics tests.
24
In a survey of Latino immigrants who had attended one of a series


as the reason for doing so.
25
The surge in naturalization applications in advance of an announced fee


previous year.
26

Figure 3. Base Application Fee, Excluding Biometrics, (2012 dollars), 1989-2012
$0
$100
$200
$300
$400
$500
$600
$700
1989
1990
1991

1992
1993
1994
1995
1996
1997
1998
1999
2000
2001
2002
2003
2004
2005
2006
2007
2008
2009
2010
2011
2012
Naturalization Application Base Fee (2012 dollars)
Year
indicates a fee change
Source: Laureen Laglagaron and Bhavna Devani, “High Stakes, More Meaning: An Overview of the Process of
Redesigning the US Citizenship Test” (Migration Policy Institute Backgrounder No. 6, September 29, 2008),
www.migrationpolicy.org/pubs/BR6_NatzTest_092908.pdf, updated using BLS Consumer Price Index.

www.ilw.com/immigrationdaily/
.

24 


.
25 The survey was administered to immigrants who had attended workshops organized through the Ya es hora citizenship
Catalysts and Barriers to Attaining Citizenship. For a broader discussion of naturalization

.
26 
.
The cost of naturalizing in the United States is high
compared with other OECD countries.




naturalization tests between October 2009 and December 2011 passed.
27
However, many immigrants


the administrative process.
28

naturalized counterparts. Noncitizens are about four times as likely as citizens to report not speaking






among legal Mexican immigrants.
29

Lack of knowledge about the application process represents another barrier. While information on
immigrants’ reasons for not naturalizing is limited, a survey conducted in the late 1990s found that the
most commonly cited obstacles aside from not meeting residence or English language requirements were





that family members’ prior knowledge of the application process may help in encouraging immigrants to
naturalize and in meeting administrative requirements.

More broadly, the extent to which immigrants’
27 www.uscis.gov/testpassrate. For more on the naturalization test,


.
28 Bloemraad, Becoming a Citizen.
29 Growing Share of Immigrants Choosing Naturalization 

.
 
The Making of Americans. Cost also emerged as an important reason for postponing citizenship applications according to the
Ya es hora survey.
 

Figure 4. English Language Ability among the Foreign Born, (%), 2010


0
5
10
15
20
25
30
35
40
45
Does not
speak English
Yes,
but not well
Yes,
speaks well
Yes,
speaks very well
Yes,
speaks only English
English Ability Among Foreign Born (%)
Noncitizen Naturalized
Note: Excludes individuals who have been in the United States for fewer than ten years.
Source: MPI calculations from the American Community Survey (ACS), 2010.



friends, families, and local communities promote and support citizenship acquisition is likely to shape
the motivation to naturalize, overcoming barriers such as the time and effort of completing the process.



Over time, immigrants should be able to overcome some of the barriers to naturalization as they learn
English, improve their earning potential, and learn how to apply. One indication that this is the case in



Figure 5. Share of Naturalized Immigrants among Foreign Born, by Decade of Arrival, (%), 1950-2010
0 20 40 60 80 100
1950s
1960s
1970s
1980s
1990s
2000s
Share Naturalized Within Decade Cohort (%)
Decade of Arrival
Source: MPI analysis of 2008-10 ACS microdata.


research examining variations in naturalization rates by country of origin can provide some insights.


a trend
attributed to the fact that they are much less likely to want to return to their home country and may have
a greater sense of gratitude or attachment to the country that offered them refuge.

Naturalization rates
are also estimated to be higher among immigrants from countries that are socially and politically less
attractive — for example, those with poor records on civil liberties.




Research in Labor Economicswww.econstor.eu/dspace/bit
Growing Share of Immigrants Choosing Naturalization. One reason for this
may be that immigrants who received their green card through marriage to a US citizen can apply for citizenship after three

 
institutions and communities. See Bloemraad, Becoming a Citizen.
 Note that immigrants who arrived in the 2000s have particularly low naturalization rates because many are not yet eligible
based on residency requirements. In addition, the 1990s and 2000s cohorts have larger shares of unauthorized immigrants
than other groups, reducing the numbers who are eligible to naturalize.
 Trends in Naturalization

Population Research and Policy Review
 The fact that refugees receive more targeted support for learning English and integrating into social and civic life probably
also plays a role.
 

Demography International Migration
Review
10




One explanation for this is that they perceive US citizenship



or because the

prestige of US citizenship is not as great in their home countries.
Figure 6 shows the share of naturalized citizens among a cohort of immigrants that arrived in the early


striking differences



Figure 6. Share Naturalized Citizens among 1990-95 Immigrant Cohorts in 2008-10, (%)
0
10
20
30
40
50
60
70
80
90
Share Naturalized Among 1990-95 Cohort (%)
Country of Origin
Source: MPI analysis of 2008-10 ACS microdata.
Immigrants’ desire to naturalize may also depend on whether their home country permits or tolerates
dual citizenship. While restrictions on dual citizenship are often not enforced in practice, immigrants
who are aware of the restrictions may still prefer not to take the risk of losing their original citizenship


to be relatively small in comparison with other factors that shape naturalization rates.
40
 

See OECD, Naturalization: A Passport for Better Integration.
 OECD, International Migration Outlook: SOPEMI 2008 Edition .
 


40 
during the 1990s increased the propensity of immigrants from these countries to naturalize in the United States, and that
immigrants from countries that permit dual citizenship have higher naturalization rates, other individual characteristics held

11


III. What Is the Economic Value of Naturalization?

further integration, it is perhaps no surprise that naturalized immigrants fare better in the labor market
than noncitizens. On the one hand, naturalized immigrants have characteristics associated with economic
success, such as higher levels of education and English language ability, and longer tenure in the US labor
market — characteristics that are in part responsible for their ability to obtain citizenship. On the other

signal social and cultural integration to prospective employers.



41
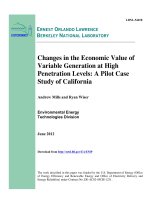
Naturalized citizens also appear to have weathered the effects of the economic crisis more
successfully.
42





naturalized and noncitizen immigrants increased from 46 percent to 67 percent over the same period

Figure 7. Annual Earnings by Citizenship Status, (2010 dollars), 1993-2010
$10,000
$15,000
$20,000
$25,000
$30,000
$35,000
$40,000
1993
1994
1995
1996
1997
1998
1999
2000
2001
2002
2003
2004
2005
2006
2007
2008
2009
2010
Annual Earnings by Citizenship Status

(2010 dollars)
Year
Naturalized Citizens
US Born
Noncitizens
67%
46%
Note: Arrows indicate the percentage gap between naturalized and noncitizen immigrants.
Excludes immigrants who have been in the United States for fewer than ten years.
Source: MPI analysis of CPS data, 1994-2011, adjusted for ination using the BLS Consumer Price Index.
www.drclas.harvard.edu/up



41 
42 Migration and the Great Recession: The Transat-
lantic Experiencewww.migrationpolicy.org/bookstore/migrationandre
cession.php.
 Figures apply to all immigrants with at least ten years of residence in the United States.
12





the impact of citizenship itself by comparing naturalized and noncitizen populations while statistically
controlling for observable differences between them, such as higher education levels and US work

of residence and potential work experience in the United States, and are twice as likely to have a college


44


for these characteristics
has typically found that
citizenship has a positive
impact on immigrants’
incomes even if most of
the wage gap between
the citizen and noncitizen
populations results from
differences in individual
characteristics. Manuel


2010 naturalized citizens
earned 8 percent more
than noncitizens, after

in variables that included
industry and occupation,
language ability, country
of origin, and duration of
residence in the United
States. This compares to

between naturalized and


boost within two years of gaining citizenship, and faster earnings growth in subsequent years.

45

family incomes 15 percent higher than noncitizens, although the data do not allow controls for language
ability and thus are likely to overstate the true impact of citizenship.
46


for Hispanic immigrants than other ethnoracial groups, and for immigrants with at least a high school

among noncitizens who lack a high school diploma. Citizenship was also associated with lower poverty

percentage points lower than among noncitizens, after controlling for observable differences compared to
noncitizens.
47

44 
45 

46 
area. Heidi Shierholz, The Effects of Citizenship on Family Income and Poverty
.
47 Ibid.
Figure 8. Foreign-Born Poverty, Unemployment, and Employment by Status,
2010-11
0
10
20
30
40
50

60
70
80
Poverty Rate,
2010
Unemployment Rate,
2011
Employment Rate,
2011
Poverty, Employment Rates by Status (%)
Noncitizens Naturalized Citizens
Note: Excludes immigrants who have been in the United States for fewer than ten years.
Source: MPI calculations from CPS.



Studies such as this can control for immigrants’ observable characteristics, but they cannot account for
the unobservable factors that explain why apparently comparable individuals make different choices
about whether to naturalize. These include characteristics such as motivation or a sense of commitment

boosting activities such as locally relevant training or language learning.
48
The studies also cannot



individuals over time and identify the labor market performance of the same individuals before and after
naturalization. But because only limited data of this kind are available, only one US study has taken this





49
One
of the reasons for this faster wage growth was that naturalization led to an immediate increase in

50
The study shows that without longitudinal data to
account for unobserved differences between individuals, the estimated impact of naturalization on
earnings would have been slightly higher, although not dramatically so, at about 5.9 percent.
51

Taken together, these studies suggest that while most of the difference between citizens and noncitizens


motivation, ability, or better social and cultural integration, a meaningful citizenship premium remains.
While the magnitude of the estimated wage premium varies by study, all of them have found an impact


52

48 Note also that since naturalization involves nontrivial costs, immigrants with higher incomes are better able to afford it and
hence will be represented in higher numbers among the naturalized population.
49 
Journal of Labor Economics 
50 
gain most from naturalization — for example, because they are seeking work in highly skilled occupations where US citizen
ship is a requirement for entry — may be most likely to naturalize.
51 The paper also presents results using a similar methodology to Heidi Shierholz’s study, and comes to consistent conclusions.


income countries.
52 OECD, Naturalization: A Passport to Better Integration.
Naturalized citizens appear to have weathered the
effects of the economic crisis more successfully.
14
MIGRATION POLICY INSTITUTE
The Economic Value of Citizenship for Immigrants in the United States
IV. Conclusion
Naturalized citizens have fared consistently better in the US labor market than their noncitizen
counterparts, and this gap has widened as a result of the economic crisis. Some of the gap results from
easily measurable differences between the two groups; some derives from less tangible differences such
as the commitment to the country that naturalization both symbolizes and enables; and some appears to
result directly from the acquisition of citizenship itself. Even after controlling for the fact that naturalized
immigrants have higher levels of education, better language skills, and more work experience in the
United States, there is some evidence that the naturalized may earn a wage premium that different
studies have estimated at 5 percent or more. The citizenship premium appears to be larger for Latino
immigrants and for women.

combination of factors such as the ability to signal successful integration to employers and to garner

naturalization on immigrants’ labor market prospects is closer to the lower end of the estimates

if taken as part of a broader strategy to improve immigrants’ outcomes through access to language
learning and skills development.


to improve immigrants’ outcomes through access

15



Appendix: Changes in the Naturalized Population over
Time


of the recently arrived and unauthorized immigrant populations not eligible for naturalization. The share
of naturalized citizens has risen gradually ever since.

Since 2007 the number of naturalized citizens has
continued to grow while the number of noncitizens remained stable — a trend in large part attributable

54
Figure A-1. Number of Naturalized and Noncitizen Immigrants, 1994-2011
0
5,000,000
10,000,000
15,000,000
20,000,000
25,000,000
Foreign Born by Status
Year
Noncitizen
Naturalized
Note: Percentages refer to the share of naturalized citizens in the total foreign-born population.
Source: CPS March Supplements, made available by IPUMS.
 
54 


DHS, Yearbook of Immigration Statistics: 2010, 

.



Works Cited
.
Migration Information Source
.


.
A Place to Call Home: What Immigrants Say Now About Life In America.
.
Bloemraad, Irene. 2006. Becoming a Citizen: Incorporating Immigrants and Refugees in the United States and
Canada
The Impact of Welfare Reform on Immigrant Welfare Use
Immigration Studies. .

Journal of Labor Economics

tics and Country of Origin. Research in Labor Economics
.

www.utexas.edu/cola/centers/eu
.
Population Flows: Immigration Aspects 2009-2010 Edi-
tion..
Trends in Naturalization. 
tute. .


Sheet 15, February 2007. .
he Making of Americans: Results
of the Texas Naturalization Survey.
Naturalisation Policies in Europe: Exploring Patterns of Inclusion and Exclusion.

.

.

Demography



.





.

.
Immigrants to Citizens. 
.
International Migration Outlook: SOPEMI 2008
Edition. .
 Naturalisation: A Passport for the Better Integration of Immigrants?

.
Migration and the Great

Recession: The Transatlantic Experience.
Growing Share of Immigrants Choosing Naturalization.
Center. .
Unauthorized Immigrant Population: National and State Trends, 2010. Washington,
.


Divergent Trends in Citizenship Rates among Immigrants in Canada and the United States.
.

International Migration Review
Catalysts and Barriers to Attaining Citizenship: An Analysis of ya es hora Ciudada

.
Estimates of the Legal Permanent Resident Population in 2010.
land Security. .
Shierholz, Heidi. 2010. The Effects of Citizenship on Family Income and Poverty. 
.

.

Integrated Public
Use Microdata Series: Ver sion 5.0 


Integrated Public Use Microdata Series:
Ver sion 5.0 





.
Yearbook of Immigration Statistics: 2011.
.
Yearbook of Immigration Statistics: 2010. Table 20.
.

Engagement. .
www.uscis.gov/testpassrate.
.

.


.

Highlights from Ten Countries. Population Research and Policy Review
International Migration Review
19
MIGRATION POLICY INSTITUTE
The Economic Value of Citizenship for Immigrants in the United States
About the Authors
Madeleine Sumption is a Senior Policy Analyst at the Migration Policy
Institute (MPI), where she oversees the research agenda of the International
Program. Her work focuses on labor migration, the role of immigrants
in the labor market, and the impact of immigration policies in Europe,
North America, and other Organization for Economic Cooperation and
Development (OECD) countries.
Ms. Sumption’s recent publications include Rethinking Points Systems and
Employer-Selected Immigration (co-author); Policies to Curb Illegal Employment; Projecting

Human Mobility in the United States and Europe for 2020 (Johns Hopkins, co-author); Migration
and Immigrants Two Years After the Financial Collapse (BBC World Service and MPI, co-editor
and author), Immigration and the Labor Market: Theory, Evidence and Policy (Equality and
Human Rights Commission, co-author), and Social Networks and Polish Immigration to the UK
(Institute for Public Policy Research).
She holds a master’s degree with honors from the University of Chicago’s school of public

Sarah Flamm is a Research Assistant at MPI, where she works on the
International Program and the Labor Markets Initiative.
 at the UN




Voting Section in the Department of Justice.

Spanish minor, from Stanford University.
For more on MPI's National Center on Immigrant Integration, please visit:
www.migrationpolicy.org/integration
1400 16
th
Street NW
Suite 300
Washington, DC 20036
Tel: 001 202-266-1940
Fax: 001 202-266-1900
The Migration Policy Institute is a nonprofit, nonpartisan think tank
dedicated to the study of the movement of people worldwide. MPI provides
analysis, development, and evaluation of migration and refugee policies at the local,
national, and international levels. It aims to meet the rising demand for

pragmatic and thoughtful responses to the challenges and opportunities that
large-scale migration, whether voluntary or forced, presents to communities
and institutions in an increasingly integrated world.
www.migrationpolicy.org

×