Báo cáo khoa học: "TOWARDS THE AUTOMATIC IDENTIFICATION OF ADJECTIVAL SCALES: CLUSTERING ADJECTIVES ACCORDING TO MEANING" ppt
Bạn đang xem bản rút gọn của tài liệu. Xem và tải ngay bản đầy đủ của tài liệu tại đây (1010.73 KB, 11 trang )
TOWARDS THE AUTOMATIC IDENTIFICATION OF ADJECTIVAL
SCALES: CLUSTERING ADJECTIVES ACCORDING TO MEANING
Vasileios Hatzivassiloglou
Kathleen R. McKeown
Department of Computer Science
450 Computer Science Building
Columbia University
New York, N.Y. 10027
Internet:
kathy @ cs.columbia.edu
ABSTRACT
In this paper we present a method to group adjectives
according to their meaning, as a first step towards the
automatic identification of adjectival scales. We discuss the
properties of adjectival scales and of groups of semantically
related adjectives and how they imply sources of linguistic
knowledge in text corpora. We describe how our system
exploits this linguistic knowledge to compute a measure of
similarity between two adjectives, using statistical tech-
niques and without having access to any semantic infor-
mation about the adjectives. We also show how a clustering
algorithm can use these similarities to produce the groups
of adjectives, and we present results produced by our sys-
tem for a sample set of adjectives. We conclude by present-
ing evaluation methods for the task at hand, and analyzing
the significance of the results obtained.
1.
INTRODUCTION
As natural language processing systems become
more oriented towards solving real-world problems
like machine translation or spoken language under-
standing in a limited domain, their need for access to
vast amounts of knowledge increases. While a model
of the general rules of the language at various levels
(morphological, syntactic, etc.) can be hand-encoded,
knowledge which pertains to each specific word is
harder to encode manually, if only because of the size
of the lexicon. Most systems currently rely on human
linguists or lexicographers who compile lexicon
entries by hand. This approach requires significant
amounts of time and effort for expanding the
system's lexicon. Furthermore, if the compiled infor-
mation depends in any way on the domain of the
application, the acquisition of lexical knowledge
must be repeated whenever the system is transported
to another domain. For systems which need access to
large lexicons, some form of at least partial automa-
tion of the lexical knowledge acquisition phase is
needed.
One type of lexical knowledge which is useful for
many natural language (NL) tasks is the semantic re-
latedness between words of the same or different syn-
tactic categories. Semantic relatedness subsumes
hyponymy, synonymy, and antonymy-
incompatibility. Special forms of relatedness are
represented in the lexical entries of the WordNet lex-
ical database (Miller
et al.,
1990). Paradigmatic
semantic relations in WordNet have been used for
diverse NL problems, including disambiguation of
syntactic structure (Resnik, 1993) and semi-
automatic construction of a large-scale ontology for
machine translation (Knight, 1993).
In this paper, we focus on a particular case of
semantic relatedness: relatedness between adjectives
which describe the same property. We describe a
technique for automatically grouping adjectives ac-
cording to their meaning based on a given text cor-
pus, so that all adjectives placed in one group
describe different values of the same property. Our
method is based on statistical techniques, augmented
with linguistic information derived from the corpus,
and is completely domain independent. It
demonstrates how high-level semantic knowledge
can be computed from large amounts of low-level
knowledge (essentially plain text, part-of-speech
rules, and optionally syntactic relations).
The problem of identifying semantically related
words has received considerable attention, both in
computational linguistics (e.g. in connection with
thesaurus or dictionary construction (Sparck-Jones,
1986)) and in psychology (Osgood
et al.,
1957).
However, only recently has work been done on the
automatic computation of such relationships from
text, quantifying similarity between words and
clustering them ( (Brown
et aL,
1992), (Pereira
et al.,
1993)). In comparison, our work emphasizes the use
of shallow linguistic knowledge in addition to a
statistical model and is original in the use of negative
knowledge to constrain the search space. Further-
more, we use a flexible architecture which will allow
us to easily incorporate additional knowledge sources
for computing similarity.
172
While our current system does not distinguish be-
tween scalar and non-scalar adjectives, it is a first
step in the automatic identification of adjectival
scales, since the scales can be subsequently ordered
and the non-scalar adjectives filtered on the basis of
independent tests, done in part automatically and in
part by hand in a post-editing phase. The result is a
semi-automated system for the compilation of adjec-
tival scales.
In the following sections, we first provide back-
ground on scales, then describe our algorithm in
detail, present the results obtained, and finally
provide a formal evaluation of the results.
2. BACKGROUND
A linguistic scale is a set of words, of the same
grammatical category, which can be ordered by their
semantic strength or degree of informativeness
(Levinson, 1983). For example, lukewarm, warm,
and hot fall along a single adjectival scale since they
indicate a variation in the intensity of temperature of
the modified noun (at least when used in their non-
metaphorical senses; metaphorical usage of scalar
words normally also follows the order of the scale by
analogy). Scales are not limited to adjectives; for ex-
ample, {may, should, must} and {sometimes, often,
always} (Horn, 1972) are linguistic scales consisting
of auxiliary verbs expressing obligation and of ad-
verbs expressing frequency respectively.
In the case of adjectives, the above definition is
commonly relaxed to replace the total order among
the elements of the scale by a partial one, so that the
elements of the scale may be partitioned into two
groups (sub-scales), within each of which the order is
total. The two sub-groups correspond to positive and
negative degrees of the common property that the
scale describes. For example, the set of adjectives
{ cold, lukewarm, warm, hot} are normally considered
part of one scale, even though no direct ordering of
semantic strength exists between cold and hot.
Linguistic scales are known to possess interesting
properties, derived from conventional logical entail-
ment on the linear ordering of their elements and
from Gricean scalar implicature (Levinson, 1983).
Despite these properties and their potential usefulness
in both understanding and generating natural lan-
guage text, dictionary entries are largely incomplete
for adjectives in this regard. Yet, if systems are to use
the information encoded in adjectival scales for
generation or interpretation (e.g. for selecting an ad-
jective with a particular degree of semantic strength
(Elhadad, 1991, Elhadad, 1993), or for handling
negation), they must have access to the sets of words
comprising a scale.
Linguists have presented various tests for accept-
ing or rejecting a particular scalar relationship be-
tween any two adjectives. For example, Horn (1969)
proposed a test using the phrase "x even y" for two
elements x and y of a totally ordered scale. More
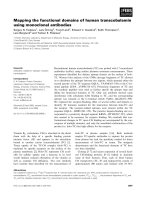
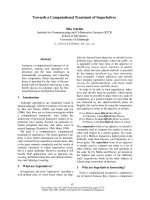
I EXTRACT WORD J
PATTERNS
I
MODULE 1 MODULE 2 MODULE n
SIMILARITIES
WORDS
Figure 1: System architecture.
refined tests locate the position of an adjective in a
scale relative to the neutral element or to the ex-
tremes of the scale (Bolinger, 1977). The common
problem with these methods is that they are designed
to be applied by a human who incorporates the two
adjectives in specific sentential frames (e.g. "X is
warm, even hot") and assesses the semantic validity
of the resulting sentences. Such tests cannot be used
computationally to identify scales in a domain, since
the specific sentences do not occur frequently enough
in a corpus to produce an adequate description of the
adjectival scales in the domain (Smadja, 1991). As
scales vary across domains, the task of compiling
such information is compounded.
3. ALGORITHM
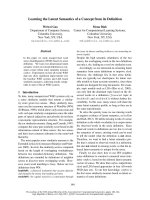
Our algorithm, whose overall architecture is
depicted in Figure 1, operates in four stages. First, we
extract linguistic data from the parsed corpus in the
form of syntactically related word pairs, or, more
generally, sequences of syntactically related words;
this co-occurrence information is processed by a mor-
phology component and tabulated. In the second
stage, the various types of co-occurrence relations
which have been identified in the text are forwarded
173
to a set of independent similarity modules, which
operate in parallel. Each similarity module uses some
linguistic criterion to judge the similarity or dis-
similarity between any two adjectives, producing a
real number between 0 and l; a module may also
refrain from making any judgement. The third stage
combines the opinions of the various similarity
modules in a single dissimilarity measure for any pair
of adjectives. Finally, the fourth stage clusters the
adjectives into groups according to the dissimilarity
measure, so that adjectives with a high degree of
pairwise similarity fall in the same cluster (and, con-
sequently, adjectives with a low degree of similarity
fall in different clusters).
The algorithm currently uses two similarity
modules based on two sources of linguistic data: data
that help establish that two adjectives are related, and
data that indicate that two adjectives are unrelated.
First, we extract adjective-noun pairs that occur in a
modification relation in order to identify the distribu-
tion of nouns an adjective modifies and, ultimately,
determine which adjectives it is related to. This is
based on the expectation that adjectives describing
the same property tend to modify approximately the
same set of nouns. For example, temperature is nor-
mally defined for physical objects and we can expect
to find that adjectives conveying different values of
temperature will all modify physical objects. There-
fore, our algorithm finds the distribution of nouns
that each adjective modifies and categorizes adjec-
tives as similar if they have similar distributions.
Second, we use adjective-adjective pairs occur-
ring as pre-modifiers within the same NP as a strong
indication that the two adjectives do not belong in the
same group. There are three cases:
1. If both adjectives modify the head noun
and the two adjectives are antithetical,
the NP would be self-contradictory, as
in the scalar sequence hot cold or the
non-scalar red black.
2. For non-antithetical scalar adjectives
which both modify the head noun, the
NP would violate the Gricean maxim of
Manner (Levinson, 1983) since the
same information is conveyed by the
strongest of the two adjectives (e.g. hot
warm).
3. Finally, if one adjective modifies the
other, the modifying adjective has to
qualify the modified one in a different
dimension. For example, in light blue
shirt, blue is a value of the property
color, while light indicates the shade 1.
The use of multiple types of linguistic data, in
INote that sequences such as
blue-green are
usually hyphenated
and thus better considered as a compound.
addition to statistical measures, is a unique property
of our work and significantly improves the accuracy
of our results. One other published model for group-
ing semantically related words (Brown et al., 1992),
is based on a statistical model of bigrams and
trigrams and produces word groups using no linguis-
tic knowledge, but no evaluation of the results is
reported.
3.1. Stage One: Extracting Word Pairs
During the first stage, the system extracts
adjective-noun and adjective-adjective pairs from the
corpus. To determine the syntactic category of each
word, and identify the NP boundaries and the syntac-
tic relations among the words, we used the Fidditch
parser (Hindle, 1989). For each NP, we then deter-
mine its minimal NP, that part of an NP consisting of
the head noun and its adjectival pre-modifiers 2. We
match a set of regular expressions, consisting of syn-
tactic categories and representing the different forms
a minimal NP can take, against the NPs. From the
minimal NP, we produce the different pairs of adjec-
tives and nouns, assuming that all adjectives modify
the head noun 3. This assumption is rarely invalid,
because a minimal NP with multiple adjectives all
modifying the head noun is far more common than a
minimal NP with multiple adjectives where one of
them modifies another. Furthermore, minimal NPs
with multiple adjectives are relatively rare in the first
place; most minimal NPs consist simply of a noun or
an adjective and a noun.
The resulting adjective-adjective and adjective-
noun pairs are filtered by a morphology component,
which removes pairs that contain erroneous infor-
mation (such as mistyped words, proper names, and
closed-class words which may be mistakenly classi-
fied as adjectives (e.g. possessive pronouns)). This
component also reduces the number of different pairs
without losing information by transforming words to
an equivalent, base form (e.g. plural nouns are con-
verted to singular) so that the expected and actual
frequencies of each pair are higher. Stage one then
produces as output a simple list of adjective-adjective
pairs that occurred within the same minimal NP and a
table with the observed frequencies of every
adjective-noun combination. Each row in the table
contains the frequencies of modified nouns for a
given adjective.
2This part of an NP has been used by many researchers (e.g.
(Hobbs
et aL,
1993) who call it a
noun group),
mostly because of
the relative ease with which it can be identified.
3We take into account possessives however and correct the
result, so that the minimal NP
(the) tall man's wife
will correctly
produce the pair
(tall, man)
instead of
(tall, wife).
174
3.2. Stage Two: Computing Similarities
Between Adjectives
This stage currently employs two similarity
modules, each of which processes a part of the output
of stage one and produces a measure of similarity for
each possible pair of adjectives.
The first module processes the adjective-noun
frequency table; for each possible pair in the table we
compare the two distributions of nouns. We use a
robust non-parametric method to compute the
similarity between the modified noun distributions
for any two adjectives, namely Kendall's x coef-
ficient (Kendall, 1938) for two random variables with
paired observations. In our case, the two random
variables are the two adjectives we are comparing,
and each paired observation is their frequency of co-
occurrence with a given noun. Kendall's x coef-
ficient compares the two variables by repeatedly
comparing two pairs of their corresponding obser-
vations. Formally, if (Xi,Yi) and (Xj,Yj) are two
pairs of observations for the adjectives X and Y on
the nouns i and j respectively, we call these pairs
concordant if Xi>Xj and Yi>Y. or if Xi<X. and
Yi<Yj; otherwise these pairs are ~iscordant. W/e dis-
card ties, that is pairs of observations where Xi=Xj.or
Yi=Yj. For example, Table 1 shows the frequencies
observed for the co-occurrences of the nouns
coordination
and
market
and the adjectives
global
and
international
in the test corpus which is
described in Section 4. From the table we observe
that for
i=coordination, j=market, X=global,
and
Y=international,
we have Xi=16 < 24=X: and
Yi=I9 < 33=Yj, so this particular pair of paired/obser -
vations is concordant and contributes positively to the
similarity between
global
and
international.
In general, if the distributions for the two adjec-
tives are similar, we expect a large number of concor-
dances, and a small number of discordances.
Kendall's I: is defined as
"c = Pc-Pd
where
Pc
and
Pd
are the probabilities of observing a
concordance or discordance respectively. ~ ranges
from -1 to +1, with +1 indicating complete concor-
dance, -1 complete discordance, and 0 no correlation
between X and Y.
An unbiased estimator of x is the statistic
C-Q
T=
where n is the number of paired observations in the
sample and C and Q are the numbers of observed
concordances and discordances respectively (Wayne,
1990). We compute T for each pair of adjectives, ad-
justing for possible ties in the values of each variable,
so that our statistic remains an unbiased estimator of
x. We determine concordances and discordances by
global international
coordination 16 19
market 24 33
Table 1: Example adjective-noun frequencies.
sorting the pairs of observations (noun frequencies)
on one of the variables (adjectives), and computing
how many of the (2) pairs of paired observations
agree or disagree with the expected order on the other
adjective. We normalize the result to the range 0 to 1
using a simple linear transformation.
The second similarity module utilizes the
knowledge offered by the observed adjective-
adjective pairs. We know that the adjectives which
appear in any such pair cannot be part of the same
group, so the module produces zero similarity for all
such pairs. The module does not output any similarity
value for pairs of adjectives which have not been ob-
served together in the same minimal NP.
The two modules produce results of a sig-
nificantly different character. The adjective-noun
module always outputs a similarity value for any pair
of adjectives, but these values tend to be around the
middle of the range of possible values; rarely will the
pattern of similarity or dissimilarity be strong enough
to produce a value which has a large deviation from
0.5. This compression of the range of the similarity
values can be attributed to the existence of many ties
and many adjective-noun pairs with low frequencies,
as would be expected by Zipf's law (Zipf, 1949).
However, the expected number of concordances and
discordances which can be attributed to chance will
be the same (a random pair can produce a concor-
dance or discordance with probability 0.5 for each),
so the effect of chance fluctuations on T is not very
significant. Furthermore, the robustness of the
method guarantees that it will not be significantly
influenced by any outliers (this is true for all rank
based methods). Therefore, although we cannot have
complete confidence in a statistical estimate like T,
we expect the module to produce useful estimates of
similarity.
On the other hand, the adjective-adjective module
produces similarity values with absolute certainty,
since once two adjectives have been seen in the same
NP even once, we can deduce that they do not belong
in the same group. However, this negative knowledge
is computed only for a few of the possible pairs of
adjectives, and it cannot be propagated to more pairs
as dissimilarity is not a transitive relation. As a result
we can make some inferences with very high con-
fidence, but we cannot make very many of them.
175
3.3. Stage Three: Combining The
Similarity Estimates
In stage three we combine the values produced by
the various similarity modules in stage two using a
pre-specified algorithm. The output of this stage is a
single table of dissimilarity values (as required by the
next stage) having one entry for each adjective pair.
Currently we have only the two similarity modules
described in the previous subsection, so we employ
the following simple algorithm:
for any pair of adjectives (x,y) do
if the adjective-adjective module has no opinion
on
(x,y)
then
dissimilarity = 1 - (the similarity reported by the
adjective-noun module)
else
dissimilarity = some constant k> 1
As can be easily seen, the algorithm has complete
confidence in the results of the adjective-adjective
module whenever that module has an opinion; when
it does not, the algorithm uses the similarity value
produced by the adjective-noun module, after a
simple linear transformation is applied to convert it to
a dissimilarity. The choice of the constant k reflects
how undesirable it is to place in the same group two
adjectives which have been observed in the same
minimal NP. Since we consider the results of the
adjective-adjective module more reliable than the
adjective-noun module, we use a high value for k,
k=10; this practically guarantees that a suggestion by
the adjective-adjective module will be respected by
the clustering algorithm unless the evidence for the
contrary is overwhelming.
Note that by placing complete confidence in the
output of the adjective-adjective module, the algo-
rithm of stage three is sensitive to small errors that
this module may perform. An incorrect suggestion
would make possibly related adjectives be kept
separate. However, this problem looks more severe
than it really is. An erroneous opinion produced by
that module must correspond to a violation of one of
the three linguistic principles listed at the start of this
section; such violations do not occur in carefully
written English (as is our test corpus of Associated
Press news reports). In fact, during the analysis of the
corpus for our test set of adjectives we found no er-
roneously identified pairs of adjectives; however, if
the system is used with a less well written, or even
spoken, corpus, the complete confidence in the
adjective-adjective module may need to be reduced.
This can be accomplished by taking into account the
frequency of an adjective-adjective pair, and making
our confidence an increasing function of this fre-
quency.
When new similarity modules, such as the ones
discussed in Section 6, are added to the system, the
above algorithm will be inadequate for combining
their suggestions. We plan to extend the algorithm to
compute an extended weighted average of the
similarities and/or dissimilarities produced by these
modules, and add a separate training component
which will determine the appropriate value for the
weight of each module.
3.4. Stage Four: Clustering The
Adjectives
In stage four we form groups of adjectives (a par-
tition) according to the combined dissimilarity values
computed in the previous stage. We want to find a
partition which is optimal, in the sense that adjectives
with high dissimilarity are placed in different groups.
We use a non-hierarchical clustering algorithm, since
such algorithms are in general stronger than hierar-
chical methods (Kaufman and Rousseeuw, 1990).
The number of clusters produced is an input
parameter. The algorithm uses the exchange method
(Spath, 1985) since the more commonly used K-
means method (Kaufman and Rousseeuw, 1990) is
not applicable; the K-means method, like all centroid
methods, requires the measure d between the clus-
tered objects to be a distance; this means, among
other conditions, that for any three objects x, y, and z
the triangle inequality applies. However, this in-
equality does not necessarily hold for our dis-
similarity measure. If the adjectives x and y were ob-
served in the same minimal NP, their dissimilarity is
quite large. If neither z and x nor z and y were found
in the same minimal NP, then it is quite possible that
the sum of their dissimilarities could be less than the
dissimilarity between x and y.
The algorithm tries to produce a partition of the
set of adjectives as close as possible to the optimal
one. This is accomplished by minimizing an
objective function
• which scores a partition P. The
objective function we use is
dp(~
=
E [ 1__~ E d(x,y) ]
c~ P I CIx,y~C
The algorithm starts by producing a random par-
tition of the adjectives, computing its • value and
then for each adjective computing the improvement
in • for every cluster where it can be moved; the
adjective is moved to the cluster that yields the best
improvement of • if there is such a cluster and the
next adjective is considered. This procedure is
repeated until no more moves lead to an improve-
ment of ~.
This is a hill-climbing method and therefore is
guaranteed to converge, but it may lead to a local
minimum of ~, inferior to the global minimum that
corresponds to the optimal solution. To alleviate this
problem, the partitioning algorithm is called
repeatedly with different random starting partitions
and the best solution in these runs is kept. As with
many practical optimization problems, computing the
optimal solution is NP-complete (Brucker, 1978).
176
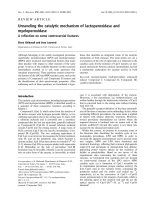
antitrust new
big old
economic political
financial potential
foreign real
global serious
international severe
legal staggering
little technical
major unexpected
mechanical
Figure 2:
Adjectives to be grouped.
Note that if the problem' s search space had been rela-
tively small, then we could have computed the op-
timal partition by enumerating all possible solutions
and keeping the best one. However, again as with
many other practical optimization problems, the
search space turns out to be intractably large. The
number of possible partitions of n objects to m non-
empty subsets with
m<n
is equal to the correspond-
ing Stifling number of the second kind (Knuth,
1973), and this number grows exponentially with n
for all but trivial values of m. For example, for our
test set of adjectives presented in the next section, we
have n=21 and m=9; the corresponding number of
possible partitions is roughly 1.23 × 10¹⁴.
4. RESULTS
We tested our system on a 8.2 million word cor-
pus of stock market reports from the Associated Press
news wire. A subset of 21 of the adjectives in the
corpus (Figure 2) was selected for practical reasons
(mainly for keeping the evaluation task tractable).
We selected adjectives that have one modified noun
in common
(problem)
to ensure some semantic re-
latedness, and we included only adjectives that oc-
curred frequently so that our similarity measure
would be meaningful.
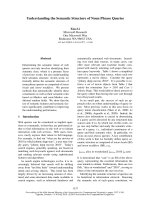
The partition produced by the system for 9
clusters appears in Figure 3. Before presenting a for-
mal evaluation of the results, we note that this par-
tition contains interesting data. First, the results con-
tain two clusters of gradable adjectives which fall in
the same scale. Groups 5 and 8 contain adjectives
that indicate the size, or scope, of a problem; by aug-
menting the system with tests to identify when an
adjective is gradable, we could separate out these two
groups from other potential scales, and perhaps con-
sider combining them. Second, groups 1 and 6 clearly
identify separate sets of non-gradable adjectives. The
first contains adjectives that describe the geographi-
cal scope of the problem. Although at first sight we
would classify these adjectives as non-scalar, we ob-
served that the phrase
international even global
problem
is acceptable while the phrase
*global even
international problem
is not. These patterns seem to
1. foreign global international
2. old
3. potential
4. new real unexpected
5. little staggering
6. economic financial mechanical political
technical
7. antitrust
8. big major serious severe
9. legal
Figure
3: Partition found for 9 clusters.
suggest at least some degree of scalability. On the
other hand, group 6 contains non-scalar relational ad-
jectives that specify the nature of the problem. It is
interesting to note here that the clustering algorithm
discourages long groups, with the expected number
adjectives per cluster being 9 2.33; nevertheless, of
the evidence for the adjectives in group 6 is strong
enough to allow the creation of a group with more
than twice the expected number of members. Finally,
note that even in group 4 which is the weakest group
produced, there is a positive semantic correlation be-
tween the adjectives
new
and
unexpected.
To sum-
marize, the system seems to be able to identify many
of the existent semantic relationships among the ad-
jectives, while its mistakes are limited to creating
singleton groups containing adjectives that are related
to other adjectives in the test set (e.g., missing the
semantic associations between
new-old
and
potential-real)
and "recognizing" a non-significant
relationship between
real
and
new-unexpected
in
group 4.
We produced good results with a relatively small
corpus of 8.2 million words 4, out of which only
34,359 total / 3,073 distinct adjective-noun pairs in-
volving 1,509 distinct nouns were relevant to our test
set of 21 adjectives (Figure 2). The accuracy of the
results can be improved if a larger, homogeneous cor-
pus is used to provide the raw data. Also, we can
increase the size of the adjective-noun and adjective-
adjective data that we are using if we introduce more
syntactic patterns in stage one to extract more com-
plex cases of pairs. Furthermore, some of the associa-
tions between adjectives that the system reports ap-
pear to be more stable than others; these associations
remain in the same group when we vary the number
of clusters in the partition. We have noticed that ad-
jectives with a higher degree of semantic content
(e.g.
international
or
severe)
appear to form more
4Corpora up to 366 million words have been used for similar
classification tasks.
177
Answer should be Yes Answer should be No
The system says Yes a b
The system says No c d
Table 2: Contingency table model for evaluation.
stable associations than relatively semantically empty
adjectives (e.g.
little
or
real).
This observation can be
used to filter out adjectives which are too general to
be meaningfully clustered in groups.
5. EVALUATION
To evaluate the performance of our system we
compared its output to a model solution for the
problem designed by humans. Nine human judges
were presented with the set of adjectives to be par-
titioned, a description of the domain, and a simple
example. They were told that clusters should not
overlap but they could select any number of clusters
(the judges used from 6 to 11 clusters, with an
average of 8.565 and a sample standard deviation of
1.74). Note that this evaluation method differs sig-
nificantly from the alternative method of asking the
humans to directly estimate the goodness of the
system's results (e.g. (Matsukawa, 1993)). It requires
an explicit construction of a model from the human
judge and places the burden of the comparison be-
tween the model and the system's output on the sys-
tem instead of the judge. It has been repeatedly
demonstrated that in complex evaluation tasks
humans can easily find arguments to support ob-
served data, leading to biased results and to an infla-
tion of the evaluation scores.
To score our results, we converted the com-
parison of two partitions to a series of yes-no ques-
tions, each of which has a correct answer (as dictated
by the model) and an answer assigned by the system.
For each pair of adjectives, we asked if they fell in
the same cluster ("yes") or not ("no"). Since human
judges did not always agree, we used fractional
values for the correctness of each answer instead of 0
("incorrect") and 1 ("correct"). We defined the cor-
rectness of each answer as the relative frequency of
the association between the two adjectives among the
human models and the incorrectness of each answer
as 1 - correctness; in this way, associations receive a
correctness value proportional to their popularity
among the human judges. For example, in the sample
set of adjectives discussed in the previous section, the
association
(foreign, international)
received a cor-
rectness value of 1, since all the humans placed these
two adjectives in the same group, while the associa-
tion
(legal, severe)
received a correctness value of 0.
The pair
(economic, political)
on the other hand
received a correctness value of 0.67, since two thirds
of the judges placed the two adjectives in the same
group. Once correctness and incorrectness values
have been defined, we can generalize measures such
as "the number of correct associations retrieved by
the system" by using summation of those values in-
stead of counting. Then the contingency table model
(Swets, 1969), widely used in Information Retrieval
and Psychology, is applicable. Referring to the clas-
sification of the yes-no answers in Table 2, the fol-
lowing measures are defined :
a
• Recall = • 100%
a+c
a
• Precision = • 100%
a+b
b
• Fallout = b~ d" 100%
In other words, recall is the percentage of correct
"yes" answers that the system found among the
model "yes" answers, precision is the percentage of
correct "yes" answers among the total of "yes"
answers that the system reported, and fallout is the
percentage of incorrect "yes" answers relative to the
total number of "no" answers 6. Note that in our
generalized contingency table model, the symbols a,
b, c, and d do not represent numbers of observed
associations but rather sums of correctness or incor-
rectness values. These sums use correctness values
for the quantities in the first column of Table 2 and
incorrectness values for the quantities in the second
column of Table 2. Furthermore, the summation is
performed over all pairs reported or not reported by
the system for quantities in the first or second row of
Table 2 respectively. Consequently, the information
theoretic measures represent the generalized counter-
parts of their original definitions. In the case of per-
fect agreement between the models, or of only one
model, the generalized measures reduce to their
original definitions.
We also compute a combined measure for recall
and precision, the F-measure (Van Rijsbergen, 1979),
which always takes a value between the values of
recall and precision, and is higher when recall and
precision are closer; it is defined as
F - (132+1)x Precision x Recall
132 x Precision + Recall
5This is the reason that we presented the partition with 9
clusters, as this is the closest integer to the average number of
clusters used by the humans.
6Another measure used in information retrieval,
overgeneration,
is in our case always equal to (100 - precision)%.
178
Recall Precision Fallout F-measure (13=1)
7 clusters 50.78% 43.56% 7.48% 46.89%
8 clusters 37.31% 38.10% 6.89% 37.70%
9 clusters 49.74% 46.38% 6.54% 48.00%
10 clusters 35.23% 41.98% 5.54% 38.31%
Table 3: Evaluation results.
where 13 is the weight of recall relative to precision;
we use 13=1.0, which corresponds to equal weighting
of the two measures.
The results of applying our evaluation method to
the system output (Figure 3) are shown in Table 3,
which also includes the scores obtained for several
other sub-optimal choices of the number of clusters.
We have made these observations related to the
evaluation mechanism:
1. Recall is inversely related to fallout and
precision. Decreasing the number of
clusters generally increases the recall
and fallout and simultaneously
decreases precision.
2. We have found fallout to be a better
measure overall than precision, since, in
addition to its decision-theoretic ad-
vantages (Swets, 1969), it appears to be
more consistent across evaluations of
partitions with different numbers of
clusters. This has also been reported by
other researchers in different evaluation
problems (Lewis and Tong, 1992).
3. The problem of assessing the meaning
of the evaluation scores in an absolute
sense is a non-trivial one. For example,
there has been increasing concern that
the scoring methods used for evaluating
the goodness of parsers are producing
values which seem extremely good (in
the >90% range), while in fact the parse
trees produced are not so satisfactory;
the blame for this inflation of the scores
can be assigned to an inadequate com-
parison technique, which essentially
considers a tree fragment correct when
it is a part of (although not exactly
matching) the corresponding fragment
in the model. For other tasks, such as
part-of-speech assignment to free text,
the comparison techniques are sound,
but very high levels of performance
(e.g, 90%) can be obtained by a zero-
parameter model which operates at ran-
dom; clearly this makes the assessment
of the significance of an improvement
over the base line of the random algo-
rithm much harder.
As a consequence of point (3) made above, we
need to understand the significance of the scores
produced by our evaluation methods (for example,
the limits of their ranges) before trying to interpret
them. There are theoretical principles which indicate
that the evaluation metrics will produce lower values
much more easily than higher ones. Because of the
multiple models used, perfect scores are not attain-
able. Also, because each pair of adjectives in a cluster
is considered an observed association, the relation-
ship between the number of associations produced by
a cluster and the number of adjectives in the cluster is
not linear (a cluster with k adjectives will produce
(k) =O (k 2) associations). This leads to lower values
of recall, since moving a single adjective out of a
cluster with k elements in the model will cause the
system to miss k-1 associations. As an example of
this phenomenon, consider the hypothetical (single)
model and partition of Figure 4; while the partition
differs from the model only in that the first cluster
has been split into two, the recall score abruptly falls
to 50%.
In order to provide empirical evidence in addition
to the theoretical discussion above, and be able to
estimate an upper bound on the values of the evalua-
tion metrics, we evaluated each human model against
all the other human models, using the same evalua-
tion method which was used for the system; the
results ranged from 38 to 72% for recall, 1 to 12% for
fallout, 38 to 81% for precision, and, covering a
Model:
1. ABCDE
2. FG
3. HI
Partition:
1. ABC
2. DE
3. FG
4. HI
Figure 4: A hypothetical model where a small
perturbation leads to a recall score
of 50%.
179
Recall Precision Fallout F-measure (13=1)
Without negative knowledge 33.16% 32.32% 7.90% 32.74%
With both modules 49.74% 46.38% 6.54% 48.00%
Table 4: Comparison of the system's performance (9 clusters) with and without the negative knowledge module.
remarkably short range, 49 to 59% for F-measure 7,
indicating that the performance of the system is not
far behind human performance.
In order to provide a lower bound for the evalua-
tion metrics and thus show that the system's scores
are not close to the scores of the human judges
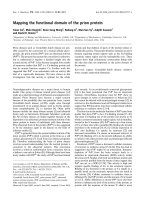
simply by chance, we performed a Monte Carlo
analysis (Rubinstein, 1981) for the evaluation
metrics, by repeatedly creating random partitions of
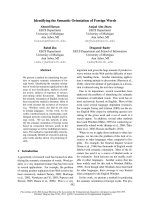
the sample adjectives and evaluating the results. Then
we estimated a smoothed probability density function
for each metric from the resulting histograms; the
results obtained are shown in Figure 5 for F-measure
and fallout using 9 clusters. We observed that the
system's performance (indicated by a square in the
diagrams) was significantly better than what we
would expect under the null hypothesis of random
performance; the probability of getting a better par-
tition than the system's is extremely small for all
metrics (no occurrence in 20,000 trials) except for
fallout, for which a random system may be better
4.9% of the time. The estimated density functions
also show that the metrics are severely constrained by
the structure imposed by the clustering as they tend to
peak at some point and then fall rapidly.
Finally, we performed another study to quantify
the impact of using negative knowledge obtained
from adjective-adjective pairs. We ran our system in
a mode where the suggestions of the adjective-
adjective module were ignored (i.e. stage three
simply passed to the output the similarities computed
by the adjective-noun module, after converting them
to dissimilarities), and evaluated the results produced.
The values of the metrics for the partition with 9
clusters appear in Table 4, alongside the correspond-
ing values produced when the system uses both
modules. When both modules are used, we can see a
significant improvement of about 15 points, which is
a 43% to 50% improvement for all metrics (except
for fallout where the improvement is about 17%).
This represents a definite improvement even though
for our test set of 21 adjectives (Figure 2) we ob-
served in our corpus only 41 distinct adjective-
adjective pairs, out of a possible (221)=210 pairs. AI-
7Thus indicating that human models which fared well on the
precision metric tended to perform badly on recall, and vice versa;
remember that the values of the metrics are related to the number
of clusters used, and that the human judges were allowed to select
the number of clusters they considered most appropriate; con-
sequently, the models with high recall/low precision are the ones
with a small number of clusters, while the opposite pattern of
scores characterizes the models with a large number of clusters.
though the observed pairs represent only 19.52% of
the possible pairs, their importance is considerable.
Note that the sparsity of the adjective-adjective
pairs does not allow us to perform a comparable
study for the partition produced using the adjective-
adjective module alone, since such a partition would
be largely determined by chance.
6. CONCLUSIONS AND
FUTURE WORK
We have described a system for extracting groups
of semantically related adjectives from large text cor-
pora, with a flexible architecture which allows for
multiple knowledge sources influencing similarity to
0 10 20 ~tO 40 50
F-me.urn (9 durum)
0 S 10 15 20
Falo~ {9 ctu~m)
Figure 5: Estimated probability densities for
F-measure and fallout with 9 clusters.
180
be easily incorporated into the system. Our evalua-
tion reveals that it has significantly high performance
levels, comparable to humans, using only a relatively
small amount of input data; in addition, it shows the
usefulness of negative knowledge, an original feature
of our approach. The system's results can be filtered
to produce scalar adjectives that are applicable in any
given domain. Furthermore, while we have
demonstrated the algorithm on adjectives, it can be
directly applied to other word classes once sources of
linguistic information for judging their similarity
have been identified.
Our immediate plans are to incorporate more
similarity modules into stage two of the system and
add a training component to stage three so that the
relative weights of the various modules can be es-
timated. We have identified several additional
sources of linguistic knowledge which look promis-
ing, namely pairs of adjectives separated by connec-
tives and adverb-adjective pairs. We also plan to ex-
tend the adjective-noun module to cover adjectives in
predicative positions, in addition to our current use of
attributive adjectives. These extensions not only will
provide us with a better way of exploiting the infor-
mation in the corpus but may also help us categorize
the adjectives as relational or attributive (Levi, 1978);
such a categorization may be useful in classifying
them as either scalar or non-scalar. For determining
whether a group of adjectives is scalar, we also plan
to use the gradability of the adjectives as observed in
the corpus. In addition, we are exploring tests for
determining whether two adjectives are antonymous,
essentially in the opposite direction of the work by
Justeson and Katz (1991) , and tests for comparing
the relative semantic strength of two adjectives.
Furthermore, we plan to consider alternative
evaluation methods and test our system on a much
larger set of adjectives. That was not done for the
current evaluation because of the difficulty for
humans of constructing large models. We are con-
sidering an evaluation method which would use a
thesaurus to judge similarity, as well as a supplemen-
tary method based on mathematical properties of the
clustering. Neither of these methods would access
any human models. The mathematical method, which
uses cluster silhouettes and the silhouette coefficient
(Kaufman and Rousseeuw, 1990), can also be used to
automatically determine the proper number of
clusters, one of the hardest problems in cluster
analysis. We also plan a formal study to evaluate the
appropriateness of the clustering method used, by
computing and evaluating the results when a hierar-
chical algorithm is employed instead in stage four.
Eventually, we plan to evaluate the system's output
by using it to augment adjective entries in a lexicon
and test the augmented lexicon in an application such
as language generation.
ACKNOWLEDGEMENTS
This work was supported jointly by DARPA and
ONR under contract N00014-89-J-1782, by NSF
GER-90-24069, and by New York State Center for
Advanced Technology Contract NYSSTF-
CAT(91)-053. We wish to thank Diane Litman and
Donald Hindle for providing us with access to the
Fidditch parser at AT&T Bell Labs, and Karen
Kukich and Frank Smadja for providing us with ac-
cess to the Associated Press news wire corpus.
Finally, we thank Rebecca Passonneau and the
anonymous reviewers for providing us with useful
comments on earlier versions of the paper.
REFERENCES
Bolinger, D. (1977). Neutrality, Norm, and Bias.
Bloomington, IN: Indiana University Linguistics
Club.
Brown P., Della Pietra V., deSouza P., Lai J., and Mercer
R. (1992). Class-based n-gram Models of Natural
Language. Computational Linguistics, 18:4,467-479.
Brucker, P. (1978). On the complexity of clustering
problems. In Henn, R., Korte, B., and Oletti,
W. (Eds.), Lecture Notes in Economics and Math-
ematical Systems. Optimierung und Operations
Research. Berlin: Springer. Quoted in (Garey and
Johnson, 1979).
Elhadad, Michael. (1991). Generating Adjectives to Ex-
press the Speaker' s Argumentative Intent.
Proceedings of 9th National Conference on Artificial
Intelligence (AAA191). Anaheim.
Elhadad, Michael. (1993). Using Argumentation to Control
Lexical Choice: A Unification-Based
Implementation. Doctoral dissertation, Computer
Science Department, Columbia University.
Garey, M.R., and Johnson, D.S. (1979). Computers and
Intractability: A Guide to the Theory of
NP-Completeness. W.H. Freeman.
Hindle, D. M. (1989). Acquiring Disambiguation Rules
from Text. Proceedings of the 27th meeting of the
Association for Computational Linguistics. Van-
couver, B.C
Hobbs J.R., Appelt D., Bear J., Israel D., Kameyama M.,
and Tyson M. (1993). FASTUS: A System for Extract-
ing Information from Text. Proceedings of the
ARPA Workshop on Human Language Technology.
ARPA Information Science and Technology Office.
Horn, L. (1969). A Presuppositional Analysis of Only and
Even. Papers from the Fifth Regional Meeting.
Chicago Linguistics Society.
Hom, LR. (1972). On the Semantic Properties of the
Logical Operators in English. Bloomington, IN: In-
diana University Linguistics Club.
Justeson, J.S. and Katz, S.M. (1991). Co-occurences of
181
Antonymous Adjectives and Their Contexts.
Computational Linguistics, 17:1,
1-19.
Kaufman, L. and Rousseeuw, P.J. (1990).
Wiley Series in
Probability and Mathematical Statistics. Finding
Groups in Data: An Introduction to Cluster Analysis.
New York: Wiley.
Kendall, M.G. (1938). A New Measure of Rank Correla-
tion.
Biometrika, 30,
81-93.
Knight, Kevin. (1993). Building a Large Ontology for
Machine Translation.
Proceedings of the ARPA
Workshop on Human Language Technology.
ARPA
Information Science and Technology Office.
Knuth, D.E. (1973).
The Art of Computer Programming.
Vol. 1:
FundamentalAlgorithms
(2nd ed.). Reading,
Mass.: Addison-Wesley.
Levi, Judith N. (1978).
The Syntax and Semantics of Com-
plex Nominals.
New York: Academic Press.
Levinson, S.C. (1983).
Pragmatics.
Cambridge, England:
Cambridge University Press.
Lewis, D. and Tong, R. (1992). Text Filtering in MUC-3
and MUC-4.
Proceedings of the Fourth Message
Understanding Conference (MUC-4).
DARPA
Software and Intelligent Systems Technology Office.
Matsukawa, Tomoyoshi. (1993). Hypothesizing Word As-
sociation From Untagged Text.
Proceedings of the
ARPA Workshop on Human Language Technology.
ARPA Information Science and Technology Office.
Miller, G.A. (ed.). (1990). WordNet: An On-Line Lexical
Database.
International Journal of Lexicography
(special issue), 3:4,
235-312.
Osgood, C.E., Suci, G.S. and Tannenbaum, P.H. (1957).
The measurement of meaning.
Urbana, Illinois:
University of Illinois Press.
Pereira F., Tishby N., and Lee L. (1993). Distributional
Clustering of English Words.
Proceedings of the
31st Conference of the ACL.
Columbus, Ohio: As-
sociation for Computational Linguistics.
Resnik, Philip. (1993). Semantic Classes and Syntactic
Ambiguity.
Proceedings of the ARPA Workshop on
Human Language Technology.
ARPA Information
Science and Technology Office.
Rubinstein, R.Y. (1981).
Wiley Series in Probability and
Mathematical Statistics. Simulation and the Monte
Carlo method.
New York: Wiley.
Smadja, F. (1991).
Retrieving Collocational Knowledge
from Textual Corpora. An Application: Language
Generation.
Doctoral dissertation, Department of
Computer Science, Columbia University.
Sparck-Jones, Karen. (1986).
Synonymy and Semantic
Classification.
Edinburgh, Great Britain: Edinburgh
University Press. Based on the author's Ph.D. thesis,
University of Cambridge, 1964.
Spath, Helmuth. (1985).
Ellis Horwood Series in Com-
puters and their Applications. Cluster Dissection
and Analysis: Theory, FORTRAN Programs,
Examples.
Chichester, West Sussex, England: Ellis
Horwood.
Swets, J.A. (January 1969). Effectiveness of Information
Retrieval Methods.
American Documentation, 20,
72-89.
Van Rijsbergen, C.J. (1979).
Information Retrieval
(2nd
ed.). London: Butterwoths.
Wayne, D.W. (1990).
The Duxbury Advanced Series in
Statistics and Decision Sciences. Applied Non-
parametric Statistics
(2nd ed.). Boston: PWS-
KENT Publishing Company.
Zipf, G.K. (1949).
Human Behavior and the Principle of
Least Effort: An Introduction to Human Ecology.
Reading, Mass.: Addison-Wesley.
182