Báo cáo khoa học: Systematic quantification of complex metabolic flux networks using stable isotopes and mass spectrometry pptx
Bạn đang xem bản rút gọn của tài liệu. Xem và tải ngay bản đầy đủ của tài liệu tại đây (440.4 KB, 18 trang )
Systematic quantification of complex metabolic flux networks using
stable isotopes and mass spectrometry
Maria I. Klapa*, Juan-Carlos Aon† and Gregory Stephanopoulos
Department of Chemical Engineering, Massachusetts Institute of Technology, Cambridge, MA, USA
Metabolic fluxes provide a detailed metric of the cellular
metabolic phenotype. Fluxes are estimated indirectly from
available measurements and various methods have been
developed for this purpose. Of particular interest are meth-
ods making use of stable isotopic tracers as they enable the
estimation of fluxes at a high resolution. In this paper, we
present data validating the use of mass spectrometry (MS)
for the quantification of complex metabolic flux networks.
In the context of the lysine biosynthesis flux network of
Corynebacterium glutamicum (ATCC 21799) under glucose
limitation in continuous culture, operating at 0.1Æh
)1
after
the introduction of 50% [1-
13
C]glucose, we deploy a bio-
reaction network analysis methodology for flux determin-
ation from mass isotopomer measurements of biomass
hydrolysates, while thoroughly addressing the issues of
measurement accuracy, flux observability and data recon-
ciliation. The analysis enabled the resolution of the involved
anaplerotic activity of the microorganism using only one
labeled substrate, the determination of the range of most of
the exchange fluxes and the validation of the flux estimates
through satisfaction of redundancies. Specifically, we deter-
mined that phosphoenolpyruvate carboxykinase and syn-
thase do not carry flux at these experimental conditions and
identified a high futile cycle between oxaloacetate and
pyruvate, indicating a highly active in vivo oxaloacetate
decarboxylase. Both results validated previous in vitro
activity measurements. The flux estimates obtained passed
the v
2
statistical test. This is a very important result consid-
ering that prior flux analyses of extensive metabolic net-
works from isotopic measurements have failed criteria of
statistical consistency.
Keywords: Corynebacterium glutamicum; data reconciliation;
GC-MS; metabolic flux determination; observability
analysis.
Defining flux as the rate at which material is processed
through a metabolic pathway in a conversion process [1],
the fluxes of a metabolic bioreaction network emerge as
fundamental metric of the cellular metabolic phenotype in
the absence of in vivo kinetic information [1–3]. In this
context, it becomes obvious why accurate and complete flux
maps are essential in bioreaction network analysis, meta-
bolic engineering, diagnosis of medical problems and drug
development [1]. In light of the inability to measure
metabolic fluxes directly, various methods have been
developed for their estimation from available measure-
ments, based on the fact that mass is conserved in a
metabolic network. Among these, the methods that use only
extracellular metabolite net excretion rate measurements are
limited to the estimation of net fluxes [4–6]. However,
methods that make use of stable isotopic tracers, and
measure the fate of the isotopic label in various metabolite
pools, can enhance the resolution of a metabolic flux
network in two ways: by increasing the number of estimable
fluxes and by improving the accuracy of flux estimates
through measurement redundancy [4,7,8]. In this paper, we
use the stable isotope of carbon (
13
C) and ion-trap MS
of biomass hydrolysates [9] for flux quantification. If
13
Cis
used as tracer, MS can, in principle, measure the fractions of
a metabolite pool that are labeled at the same number of
carbon atoms. These are the
13
C mass isotopomer fractions
of the metabolite and provide a measure of the tracer
distribution in this metabolite pool. MS combined with the
separation ability of GC has been used for many years to
measure the mass isotopomer distribution of intracellular
metabolites in cell lysates for flux quantification in the
context of disease diagnosis (e.g. [10–13]). Wittmann and
Correspondence to G. Stephanopoulos, Bayer Professor of Chemical
Engineering and Biotechnology, Department of Chemical Engine-
ering, MIT, Room 56-469, Cambridge, MA 02139, USA.
Fax: +1 617 253 3122, Tel.: +1 617 253 4583,
E-mail:
Abbreviations: 1,3-BPG, 1,3-bis-phosphoglycerate; 2-PG, 2-phospho-
glycerate; aKG, a-ketoglutarate; CER, carbon dioxide evolution rate;
DHAP, dihydroxyacetone phosphate; E4P, erythrose 4-phosphate;
FRU1,6bisP, fructose-1,6-bis-phosphate; FRU6P, fructose 6-phos-
phate; FUM, fumarate; G3P, 3-phosphoglycerate; G6P, glucose
6-phosphate; GAMS, General Algebraic Modelling System; GAP,
glyceraldehyde-3-phosphate; H4D, tetrahydrodipicolinate; ISOCIT,
isocitrate; Lys
EXTRA
, lysine excreted extracellularly; Lys
INTRA
,lysine
produced intracellularly; MAL, malate; meso-DAP, meso-diamino-
pimelate; OAA, oxaloacetate; OUR, oxygen uptake rate; P5P, pentose
5-phosphate; PEP, phosphoenolpyruvate; PPP, pentose phosphate
pathway; PYR, pyruvate; RQ, respiratory quotient; SED7P, sedo-
heptulose 7-phosphate; SUC, succinate; SUCCoA, succinyl coenzyme
A; SVD, singular value decomposition analysis; TBDMS, tributyl
dimethyl silyl.
*Present address: Department of Chemical Engineering, University of
Maryland, College Park, MD 20742, USA.
Present address: GlaxoSmithKline, King of Prussia, PA, USA.
(Received 16 April 2003, revised 17 June 2003, accepted 26 June 2003)
Eur. J. Biochem. 270, 3525–3542 (2003) Ó FEBS 2003 doi:10.1046/j.1432-1033.2003.03732.x
Heizle (2001) [14] used MALDI-TOF-MS to measure the
mass isotopomer distribution of extracellular metabolites
for the determination of the Corynebacterium glutamicum
metabolic flux network. Using GC-quadrupole MS, Chris-
tensen and Nielsen [15,16] reported the analysis of the
Penicillium chrysogenum flux network from the mass
isotopomer fractions of biomass hydrolysates. Various
other networks were analyzed in subsequent studies using
the same method [17–19].
In the present paper we expand on the idea of Christensen
and Nielsen [15] describing the quantification of the lysine
biosynthesis flux network of C. glutamicum ATCC 21799
under glucose limitation in continuous culture from mass
isotopomer measurements of biomass hydrolysates after the
introduction of 50% [1-
13
C] glucose. In the context of this
model system, we thoroughly discuss all issues concerning
the use of stable isotopes, MS and bioreaction network
analysis for flux quantification of complex metabolic
networks. In this sense, we provide for the first time a
complete picture of the methodology. Specifically we
address: (a) the validity of flux estimates from biomass
hydrolysate measurements in the context of metabolic and
isotopic steady-state only; (b) the accuracy of the MS
measurements and which of them can be considered reliable
to be used for flux determination (the latter question was
also raised by [20]); (c) flux observability from the available
measurements; and (d) measurement redundancy and
statistical consistency analysis.
Apart from presenting a valid methodology for flux
determination, the second objective of this work was to
apply it in the analysis of the C. glutamicum physiology.
C. glutamicum is of special industrial interest primarily for
lysine production from inexpensive carbon sources [21,22].
While this is the main reason for which C. glutamicum
metabolism has been under study for the last 40 years in
various groups [14,23–42], the C. glutamicum flux network
also constitutes a good model system to illustrate issues
concerning the application of stable isotope techniques. It
includes an involved set of anaplerotic reactions and two
parallel pathways in the lysine biosynthesis route. Both of
these groups of reactions have been shown to play an
important role in lysine biosynthesis [38,43], but the
independent quantification of their activity in vivo requires
the use of isotopic tracers [5,35,38]. The extent to which
the use of MS measurements of biomass hydrolysates
after the introduction of the
13
C tracer through the
glucose substrate enables the accurate estimation of these
fluxes was explored in this work. Moreover, because ion-
trap MS was used, the reported experimental data and
flux analysis results provide material for comparison
between ion-trap and quadrupole MS in the context of
flux quantification.
Finally, we need to underline that the flux analysis
methodology presented here in the context of a particular
microorganism is generic and it could be used for the
metabolic reconstruction of any biological system with
minor changes to adjust to its specifics. Additionally, while
the methodology is validated in the context of metabolic
and isotopic steady state, it is not per se limited to steady-
state systems. Its application, however, to transient biolo-
gical systems needs to be investigated further and validated
in the presence of a series of controls to guarantee correct
flux estimation from the isotopic tracer measurements of
biomass hydrolysates.
Materials and methods
The aspartate kinase enzyme of C. glutamicum ATCC
21799 is insensitive to feedback inhibition from threonine
and lysine [5]. An excess of threonine, methionine and
leucine was added in the preculture and reactor feed media
to inhibit their synthesis and direct the entire carbon flux
through aspartate kinase towards lysine production. Cul-
tures for chemostat inoculation started from a seed culture
in a 250-mL shake flask containing 50 mL of defined
medium. The seed culture was inoculated from a loop of
stock culture grown for 24 h on a Petri dish with complex
agar medium. The seed culture medium was modified
Luria–Bertani broth, containing: 5 gÆL
)1
glucose, 5 gÆL
)1
yeast extract, 10 gÆL
)1
tryptone, 5 gÆL
)1
NaCl [31].
The shake flask was incubated overnight at 30 °Cwith
agitation at 300 r.p.m. The preculture and chemostat feed
medium consisted of (per liter distilled water): 5 g glucose,
50 mg CaCl
2
, 400 mg MgSO
4
Æ7H
2
O, 25 mg FeSO
4
Æ7H
2
O,
0.1 g NaCl, 10 mL 100 · mineral salts solution, 3 g
K
2
HPO
4
,1gKH
2
PO
4
, 1 g threonine, 0.3 g methionine,
1 g leucine, 1 mg biotin, 1 mg thiamineÆHCl, 10 mg panto-
thenic acid, 5 g (NH
4
)
2
SO
4
and 0.1 lL antifoam. The
100 · mineral salts solution consisted of (per liter distilled
water): 200 mg FeCl
3
Æ6H
2
O, 200 mg MnSO
4
ÆH
2
O, 50 mg
ZnSO
4
Æ7H
2
O, 20 mg CuCl
2
Æ2H
2
O, 20 mg Na
2
B
4
O
7
Æ10H
2
O,
10 mg (NH
4
)
6
Mo
7
O
24
Æ4H
2
O (pH was adjusted to 2.0 by
addition of HCl to avoid precipitation). Preliminary meas-
urements from shake flask cultures (data not shown) had
indicated that cells grown at 5 gÆL
)1
glucose were under
glucose limitation. Five hundred milliliters of the preculture
were incubated at 30 °C with agitation at 300 r.p.m. When
the attenuance (D) measurement indicated exponential
growth, the microbial broth was transferred into a 1-L
chemostat (Applicon Inc., the Netherlands). A D of 1.0
corresponded to 0.265 gÆL
)1
dry cell weight. Continuous
feed was initiated at dilution rate of 0.1Æh
)1
using a
peristaltic pump. Temperature and pH were kept at 30 °C
and 7.0, respectively, the latter with external addition of 2
M
NaOH. CO
2
-free compressed air (CO
2
concentration
<1 p.p.m.) was provided at 1 LÆmin
)1
,inaneffortto
eliminate input of
13
C from sources other than glucose. The
composition of the air out of the gas cylinder was measured
for 20 h prior to the experiment using a Perkin-Elmer MGA
1600 mass spectrometer. The average concentration of
oxygen, nitrogen and carbon dioxide over this period of
time was considered the inlet air composition in the
estimation of oxygen uptake (OUR) and carbon dioxide
evolution (CER) rates [31,32]. Five milliliters samples were
withdrawn from the reactor every 10 h (residence time).
Each sample was used partly for immediate measurement of
D and the rest was processed as described in the next
paragraph for subsequent analysis. The concentration of
oxygen, carbon dioxide and nitrogen in the outlet air stream
were measured online using the mass spectrometer described
above. Outlet air composition provided an additional (to
the D) measurement, whose change over time was used to
monitor online the state of the culture. After six residence
times, i.e. 60 h, and while the online measurements were
3526 M. I. Klapa et al. (Eur. J. Biochem. 270) Ó FEBS 2003
indicating that the culture was at metabolic steady state, the
reactor was switched to labeled feed. In this, 50% of glucose
was 99.9% labeled at carbon 1 (Cambridge Isotope
Laboratories Inc.), everything else remaining the same as
in the unlabeled feed. Five-milliliter samples were with-
drawn every half-residence time (5 h) up to six residence
times (60 h); by then, the culture was expected to have
reached isotopic steady state.
All samples were kept in ice and (almost immediately
after sampling) were centrifuged for 5 min at 5040 g and
2–4 °C; the rotor of the centrifuge had been precooled to
)20 °C. The supernatant was separated from the pellet after
centrifugation. The pellet was then washed once with 50%
(v/v) methanol/water quenching solution precooled to
)20 °C and centrifuged again for 5 min at 5040 g and
2–4 °C (in a rotor precooled to )20 °C). The pellet was then
dried under a flow of nitrogen; of note, the pellet was kept in
ice and the duration of drying was the shortest possible. The
dried pellets were stored at )20 °C for subsequent MS
analysis. The MS analysis protocol followed is described in
detail in [44]. The supernatant was analyzed to determine
the concentration of glucose, trehalose, organic acids,
amino acids and ammonia in the chemostat medium. The
concentration of amino acids was measured by HPLC.
Specifically, all amino acids were analyzed as ortho-
phthaldialdehyde (OPA) derivatives using a Hewlett-Pack-
ard reverse phase Amino Quant column on a series 1050
HPLC system. The solvents used were acetonitrile, 0.1
M
sodium acetate pH 5.02 and water in a gradient mode at
40 °C and a flow rate of 0.45 mLÆmin
)1
, monitoring UV
absorbance at 338 nm. The Boehringer Mannheim enzy-
matic kits #716251, #139084, #1112732 and #148261 were
used for the measurement of the glucose (and trehalose),
lactate, ammonia, and acetate concentrations, respectively.
Specifically for the determination of trehalose concentra-
tion, trehalose was initially broken down into glucose using
the enzyme trehalase (Sigma catalog #T8778). The Sigma
kit #726 was used for the determination of the pyruvate
concentration.
Flux analysis
Metabolic flux quantification is simultaneously a parameter
estimation and a data reconciliation problem. Specifically,
metabolic flux quantification refers to the estimation of the
unknown net and exchange fluxes of a metabolic network
(ÔparametersÕ) from available macroscopic data, based on
metabolite and isotopomer balances, the latter relevant in
the case of labeled substrate use [4,5]. The exchange flux of a
biochemical reaction is a measure of the extent of its
reversibility [45]. The metabolite- and isotopomer balances
are formulated based on a stoichiometric model for the
intracellular metabolic reactions and describe the conserva-
tion of mass and isotopic label in a metabolic network.
Clearly then, the first requirement for a successful flux
estimation is for the available measurements to contain
adequate information about the unknown fluxes. However,
measurements are not, in general, expected to strictly satisfy
the conservation balances, due to random experimental
errors and process variability. Therefore, flux estimation
problems have to be defined as data reconciliation problems
(i.e. weighted least-squares constrained minimization
problems), where the measured variables are optimally
adjusted, so that their adjusted values satisfy the metabo-
lite- and isotopomer balance constraints [46]. Occasionally
though, some measurements may contain gross biases. In
these cases, including this data in flux estimation will distort
the adjustments of all the measured variables, leading to
erroneous metabolic flux estimates. These measurements
should be isolated and discarded. Hence, the second
requirement for the success of flux estimation is the
reliability of the available experimental data. It becomes
obvious then, that addressing the issues of flux observability
and clever experimental design, along with data consistency
and identification of gross errors through satisfaction of
redundancies, constitutes a major part of flux quantification
analysis. These issues are sequentially discussed in this paper
in the context of the analysis of the C. glutamicum lysine
biosynthesis flux network using extracellular metabolite net
excretion rate- and mass isotopomer measurements (for
further details see [7]).
Specifically, the metabolic flux quantification problem
from extracellular metabolite net excretion rate- and mass
isotopomer measurements can be divided into two sub-
problems, which can then be processed sequentially: (a)
metabolite balancing analysis, which is the linear regression
of the extracellular metabolite net excretion rate measure-
ments based on the metabolite balance constraints. From
metabolite balancing analysis, only the fluxes of the
independent linear pathways of a network can be deter-
mined. Consequently, all exchange fluxes and the net fluxes
of the reactions involved in parallel competing pathways
are unobservable [4–7,32,45,47–49]; (b) mass isotopomer
distribution analysis, which is the nonlinear regression of
the mass isotopomer measurements based on (i) the
13
C- (positional) isotopomer balance constraints, (ii) the
balances relating the
13
C- mass isotopomer measurements
with the
13
C- positional isotopomer fractions of the
corresponding metabolite pools, (iii) the equations relating
the net and exchange fluxes to the forward and reverse
fluxes of the network reactions, and (iv) the equations
describing the linear dependency between the net reaction
fluxes in the groups of parallel competing pathways. If an
amino acid is not part of the considered network, but its
mass isotopomer distribution is measured (e.g. phenyl-
alanine), then balances (ii) contain the equations that relate
the measured mass isotopomer distribution of the amino
acid with the positional isotopomer fractions of network
metabolites (e.g. erythrose-4-phosphate and phosphoenol-
pyruvate, for the case of phenylalanine). Due to derivati-
zation prior to GC, the raw MS measurements must be
ÔcorrectedÕ for the natural abundance of the derivatizing
agent constituents [50] to obtain the
13
C-mass isotopomer
fractions of the ÔbareÕ amino acid fragments. This correc-
tion can be processed separately, and the corrected
measurements can then be used in the objective function
of the regression problem [50]. Equivalently, the original
MS measurements can be included in the objective
function, in which case the correction equations have to
be considered as the last set of constraints in this part of
the analysis. The latter approach was followed in the
present study. The net fluxes, which have already been
estimated in metabolite balancing analysis, are included
here as constants.
Ó FEBS 2003 Systematic flux analysis using stable isotopes and MS (Eur. J. Biochem. 270) 3527
Biochemistry: stoichiometric model
The analysis of the C. glutamicum lysine biosynthesis flux
network under glucose limitation was based on the stoichio-
metric model shown in the Appendix (for further details see
[5,29,31]).
Results
Extracellular metabolite net excretion rate
measurements
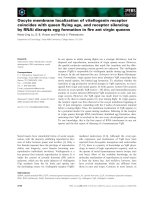
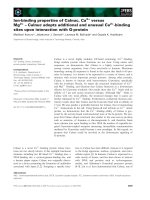
Figure 1A shows the time profiles of OUR and CER
throughout the continuous culture, from which the time
profile of the respiratory quotient (RQ ¼ CER/OUR) is
generated (Fig. 1B). Considering constant OUR and CER
as an indication of metabolic steady state, it is observed that
the cells reached steady state after approximately three
residence times (30 h) of continuous feed and remained
at this state for almost 100 h (10 residence times). The
introduction of the labeled feed after 60 h of continuous
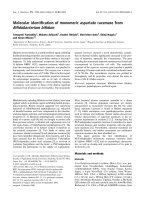
feed did not disturb the physiological state of the cells. This
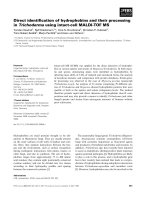
is also validated by the concentration profiles of all the
metabolites present in the chemostat medium, shown in
Fig. 2. In continuous culture, a constant concentration of a
metabolite in the medium implies constant metabolite net
excretion rate [51]. The small decrease observed in lysine
concentration is expected in overproducers of lysine [40]. In
addition, the glucose profile indicates that the cells were
indeed under glucose limitation. This guarantees that the
entire amount of the isotopic tracer provided to the cells
through the glucose feed was assimilated by the culture. The
cells were using the carbon source primarily to grow
(% 90%) and produce lysine (% 10%). Of the other amino
acids or organic acids, only valine was detected in trace
quantities in the medium. Threonine, methionine and
leucine remained in excess throughout the continuous
culture, supporting the assumption that the cells did not
produce any homoserine (or threonine and methionine).
The net excretion rates (in mMÆh
)1
) of the extracellular
metabolites, averaged over all steady-state samples, and the
standard deviations assigned to them, are shown in Table 1.
The elemental composition and ash content of biomass were
considered to be C
3.97
H
6.46
O
1.94
N
0.845
and 3.02%, respect-
ively [32]. Trehalose, acetate, lactate and alanine were
includedinthesetofmeasurednetexcretionrates,even
Fig. 1. (A) The time profile of the oxygen uptake rate (OUR) and
carbon dioxide evolution rate (CER) and (B) the profile of the respiratory
quotient, throughout the continuous culture.
Fig. 2. The time profiles of the concentration of glucose, biomass, lysine,
ammonia, threonine, valine, methionine, leucine and pyruvate in the
chemostat medium throughout the continuous culture.
Table 1. The extracellular metabolite net secretion rates at metabolic
steady-state, estimated from the data shown in Figs 1 and 2. Columns 2
and 3 show the SD assigned to each of the rates as a fraction of the
measured value or in absolute terms, respectively.
Extracellular metabolite net
secretion rates (m
M
Æh
)1
)
SD
(%)
SD
(m
M
Æh
)1
)
Acetate 0 ± 0.02
Ala 0 ± 0.02
Biomass 1.99 4 ± 0.08
CER 6.42 10 ± 0.64
Glc )2.66 2 ± 0.05
lactate 0 ± 0.02
Lys 0.19 13 ± 0.025
Ammonia )2.54 15 ± 0.38
OUR )7.04 10 ± 0.70
PYR 7.7E)4 1 ± 7.7E)6
Trehalose 0 ± 0.02
Val 0.09 15 ± 0.01
3528 M. I. Klapa et al. (Eur. J. Biochem. 270) Ó FEBS 2003
though they were not detected in the medium. As explained
in greater detail in [31], there is a slight probability that these
metabolites, which are known products of C. glutamicum
under some experimental conditions, might have been
produced, but either accumulated intracellularly or excreted
extracellularly at concentrations lower than the limits of the
detection methods. To account for these uncertainties, the
rates of these four metabolites were assigned a standard
deviation equal to 10% of the lysine excretion rate (i.e.
0.02 m
M
Æh
)1
), lysine being the amino acid detected at the
highest concentration in the medium. This is smaller than
the error considered by [31,32], i.e. 20% of the lysine
production rate at the exponential phase of the batch
culture, but the intracellular accumulation of these metabo-
lites, if any, is expected to be low at the conditions of the
experiment [52]. The coefficient of variation assigned to the
rates of pyruvate, glucose and biomass reflects the accuracy
of the detection equipment or kit. The standard deviation
assigned to the net excretion rates of lysine and valine
accounted for their variation among the steady-state sam-
ples. While the decrease in lysine concentration can be
explained from the physiology of the strain [40], the observed
fluctuations in valine concentration should be attributed to
the fact that the concentration of valine was at the limits of
the detection method (HPLC). The high standard deviations
assigned to CER, OUR and the net consumption rate of
ammonia (i.e. 10%, 10% and 15% of the rate value,
respectively) reflect the high degree of uncertainty associated
with these measurements. Specifically for ammonia, Vallino
(1991) [31] speculated that the high (NH
4
)
2
SO
4
concentra-
tion in the medium throughout the continuous culture
increases the difficulty of accurately determining the extent
of ammonia assimilation from the cells. The measured CER
and OUR values are based on a constant inlet airflow rate
(1LÆmin
)1
) and composition. Because the air was not pulled
out of the air cylinder using a peristaltic pump and its flow
rate was controlled manually, observed fluctuations were in
the range of ± 0.2ÆLmin
)1
around the set value. The
standard deviations assigned to CER and OUR account for
these errors in the airflow rate measurement.
MS measurements
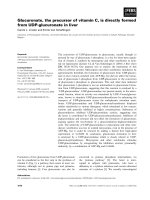
Fig. 3 shows the time profiles of the (M + 0) and (M + 1)
mass isotopomer fractions of selected tributyl dimethyl silyl
(TBDMS)-amino acid fragments. M depicts the molecular
weight of a fragment, i.e. all its atoms are in their naturally
most abundant isotopic form. Similar profiles were
observed for the rest of the measured fragments. It becomes
apparent that the cells reached isotopic steady-state 40 h
(i.e. four residence times) after the initiation of the labeled
feed. Therefore, the MS measurements along with the
extracellular metabolite net excretion rate measurements
establish that the culture was at metabolic and isotopic
steady state for the last 30 h of the experiment.
The steady-state values of all MS measurements are
shown in Table 2 along with the standard deviation associ-
ated with each measurement. The steady-state values were
estimated as the average over the measurements of duplicate
samples and three injections per sample at the fourth, fifth
and sixth residence times after the initiation of the labeled
feed. This means that each measurement is a combined result
of 18 GC-MS runs and its standard deviation reflects the
variance of its value among the 18 runs. This high degree of
redundancy enabled us to detect erroneous measurements
due to saturation phenomena in the ion-trap (see [7,44]),
while it obviously increases significantly our confidence in the
validity of the experimental data. If necessary, the standard
deviation also accounts for any systematic difference
between the measured and the real MS values of an amino
acid fragment, as detected during the calibration of the entire
MS measurement acquisition process with amino acid
samples of known labeling (for further details see [7,44]).
All values depicted were also corrected for the presence of
(M–n)
+
peaks, as explained in [44]. Fragments of the
TBDMS-derivatives of methionine and threonine were also
measured, but are not shown in Table 2, because they were
not used in flux quantification, as will be explained later in the
text. Most of the measurements are associated with the lower
part of the network [below phosphoenolpyruvate (PEP)],
while the upper part of the network (glycolysis and pentose
phosphate pathway) is ÔmonitoredÕ only from phenylalanine
and glycine measurements.
Due to the selected substrate labeling, the most abundant
mass isotopomers of each fragment are the three lightest.
From Table 2, it can be observed that the error associated
with these isotopomers is usually <7% of the MS value,
while the coefficient of variation of the most abundant
(M + 0) fraction can be as low as 0.3% (e.g. for alanine
fragments). On the other hand, there is a large coefficient of
variation (50–250%) associated with the heavier mass
isotopomer fractions. Under the experimental conditions
described, these fractions are usually smaller than 3%.
Calibration experiments had shown that the degree of
reliability and reproducibility of such measurements is very
low [44].
Flux determination: metabolite balancing analysis
The considered lysine biosynthesis network of C. glutami-
cum (see Appendix) consists of 45 net fluxes and 46
metabolites. Of the 47 reactions in the stoichiometric
model, PEP carboxylase (reaction 23) and PEP
Fig. 3. Time profiles of the M + 0 and M + 1 mass isotopomer
fractions of selected TBDMS-amino acid fragments. Mdenotesthe
molecular weight of a fragment, i.e. all its atoms are in their naturally
most abundant isotopic form. The number after the name of an amino
acid in the legend refers to the weight of the depicted fragment ion of
the TBDMS-derivative of the amino acid.
Ó FEBS 2003 Systematic flux analysis using stable isotopes and MS (Eur. J. Biochem. 270) 3529
Table 2. The steady-state mass isotopomer fractions of the measured TBDMS-amino acid fragments and their estimated values, optimally adjusted
to satisfy the constraints of the flux quantification problem. The part of the amino acid carbon skeleton included in each fragment is depicted in
the first column of the table under the molecular weight of the fragment. The standard deviation associated with each measurement is shown in
the fourth column of the table; the number in parenthesis depicts the standard deviation as a percentage of the measured value (coefficient of
variation). The sixth column of the table shows the difference of the estimated from the measured values divided by the standard deviation of
the measurement. The last column of the table shows the square of the relative difference for each mass isotopomer fraction. The sum of the
elements in that column is equal to the total error of the flux analysis and it is compared with the v
2
(0.9,53), 53 being the number of
redundant measurements. The last two columns show the values of the relative differences and their squares, respectively, only for the
measurements considered in the flux quantification analysis.
Fragment
Mass
isotopomer
Measured
fraction (%) SD (%)
Estimated
fraction (%)
Relative
difference
Relative
difference
2
Ala260
[1–3]
M + 0 60.43 ± 0.20 (0.33) 59.34 5.45 29.70
M + 1 26.81 ± 0.54 (2.0) 28.24 )2.65 7.01
M + 2 9.73 ± 0.26 (2.7) 9.59 0.54 0.29
M + 3 2.55 ± 0.25 (9.8) 2.36
M + 4 0.47 ± 0.27 (57) 0.41
Ala232
[2–3]
M + 0 63.00 ± 0.21 (0.33) 63.36 )1.71 2.94
M + 1 25.93 ± 0.12 (0.46) 26.09 )1.33 1.78
M + 2 8.69 ± 0.18 (2.1) 8.30 2.16 4.65
M + 3 2.06 ± 0.12 (5.8) 1.90
M + 4 0.32 ± 0.01 (3) 0.29
Gly246
[1–2]
M + 0 74.99 ± 0.83 (1.1) 74.48 0.61 0.38
M + 1 16.57 ± 0.81 (4.9) 17.17 )0.74 0.55
M + 2 7.09 ± 0.39 (5.5) 7.04 0.13 0.02
M + 3 1.32 ± 0.59 (45) 1.07
M + 4 0.02 ± 0.04 (2E+2) 0.18
Gly218
[2]
M + 0 74.97 ± 1.63 (2.17) 76.75 )1.09 1.19
M + 1 16.18 ± 0.75 (4.6) 15.54 0.85 0.73
M + 2 6.94 ± 0.51 (7.3) 6.65 0.57 0.32
M + 3 1.44 ± 0.26 (18) 0.88
M + 4 0.47 ± 0.31 (66) 0.15
Val260
[2–5]
M + 0 50.70 ± 0.70 (1.4) 51.94 )1.77 3.14
M + 1 32.72 ± 0.55 (1.7) 32.63 0.16 0.03
M + 2 12.24 ± 0.22 (1.8) 11.58 3.00 9.00
M + 3 3.50 ± 0.25 (7.1) 3.13 1.48 2.19
M + 4 0.73 ± 0.13 (18) 0.60
M + 5 0.11 ± 0.07 (6E+1) 0.09
Val288
[1–5]
M + 0 51.39 ± 0.65 (1.3) 48.64 4.23 17.90
M + 1 32.68 ± 1.19 (3.64) 33.65 )0.82 0.66
M + 2 12.16 ± 0.87 (7.2) 13.03 )1.00 1.00
M + 3 3.31 ± 0.50 (15) 3.71 )0.80 0.64
M + 4 0.46 ± 0.29 (63) 0.78
Val186
[2–5]
M + 0 55.96 ± 0.53 (0.95) 57.71 )3.30 10.90
M + 1 30.69 ± 0.64 (2.1) 32.04 )2.11 4.45
M + 2 9.66 ± 0.49 (5.1) 8.39 2.59 6.72
M + 3 2.90 ± 0.39 (13) 1.63
M + 4 0.59 ± 0.27 (45) 0.20
M + 5 0.20 ± 0.17 (85) 0.02
Val302
[1–2]
M + 0 64.04 ± 0.22 (0.34) 64.50 )2.09 4.37
M + 1 24.71 ± 0.20 (0.81) 24.40 1.55 2.40
M + 2 9.00 ± 0.65 (7.2) 8.74 0.40 0.16
M + 3 1.99 ± 0.38 (19) 1.93
M + 4 0.14 ± 0.25 (1.8E+2) 0.34
Glu432
[1–5]
M + 0 40.83 ± 0.30 (0.73) 40.81 0.07 0.00
M + 1 36.99 ± 4.29 (11.6) 34.13 0.67 0.44
M + 2 16.77 ± 0.14 (0.83) 16.73 0.29 0.08
M + 3 4.22 ± 2.65 (62.8) 6.06
M + 4 0.95 ± 1.34 (1.4E+2) 1.69
3530 M. I. Klapa et al. (Eur. J. Biochem. 270) Ó FEBS 2003
Table 2. (Continued).
Fragment
Mass
isotopomer
Measured
fraction (%) SD (%)
Estimated
fraction (%)
Relative
difference
Relative
difference
2
Glu272
[2–5]
M + 0 51.24 ± 1.21 (2.36) 51.80 )0.46 0.21
M + 1 31.71 ± 1.41 (4.45) 32.53 )0.58 0.34
M + 2 12.69 ± 0.41 (3.2) 11.69 2.44 5.95
M + 3 3.58 ± 0.40 (11) 3.21
Asp418
[1–4]
M + 0 47.18 ± 0.78 (1.7) 46.13 1.35 1.81
M + 1 32.60 ± 0.68 (2.1) 32.24 0.53 0.28
M + 2 14.44 ± 1.00 (6.89) 14.83 )0.39 0.15
M + 3 4.69 ± 0.31 (6.6) 5.02 )1.06 1.13
M + 4 0.94 ± 0.38 (4.0E+1) 1.32
M + 5 0.15 ± 0.12 (8.0E+1) 0.28
Asp390
[2–4]
M + 0 50.35 ± 1.65 (3.28) 49.93 0.25 0.06
M + 1 32.55 ± 1.41 (4.33) 30.98 1.11 1.24
M + 2 14.52 ± 1.14 (7.85) 13.51 0.89 0.78
M + 3 2.46 ± 1.88 (76.4) 4.30
M + 4 0.12 ± 0.23 (1.9E+2) 1.06
Asp316
[2–4]
M + 0 56.65 ± 2.02 (3.57) 55.45 0.59 0.35
M + 1 32.24 ± 1.20 (3.72) 30.33 1.59 2.53
M + 2 8.72 ± 1.77 (20.3) 10.76 )1.16 1.34
M + 3 2.38 ± 0.84 (35) 2.83
Lys431
[1–6]
M + 0 40.44 ± 3.03 (7.48) 37.81 0.87 0.76
M + 1 34.83 ± 0.95 (2.7) 34.78 0.05 0.00
M + 2 18.29 ± 2.88 (15.7) 18.04 0.09 0.01
M + 3 5.43 ± 1.22 (22.5) 6.79
M + 4 0.97 ± 0.95 (98) 1.97
Lys272
[2–6]
M + 0 46.83 ± 1.98 (4.23) 47.52 )0.35 0.12
M + 1 32.97 ± 1.53 (4.64) 34.38 )0.92 0.85
M + 2 14.53 ± 0.85 (5.8) 13.42 1.31 1.71
M + 3 4.80 ± 0.53 (11) 3.80
M + 4 0.84 ± 0.49 (58) 0.80
Phe336
[1–9]
M + 0 44.96 + 2.92 (6.49) 43.20 0.60 0.36
M + 1 36.02 ± 2.50 (6.94) 34.86 0.46 0.22
M + 2 14.75 ± 2.78 (18.9) 15.50 )0.27 0.07
M + 3 3.58 ± 1.09 (30.4) 4.97
M + 4 0.06 ± 0.13 (2E+2) 1.21
Phe308
[2–9]
M + 0 44.11 ± 1.26 (2.86) 44.30 )0.15 0.02
M + 1 34.80 ± 1.50 (4.31) 34.98 )0.12 0.02
M + 2 15.56 ± 1.00 (6.43) 14.86 0.70 0.49
M + 3 4.59 ± 0.19 (4.1) 4.57 0.11
M + 4 0.94 ± 0.56 (59) 1.06
Phe234
[2–9]
M + 0 50.34 ± 2.17 (4.31) 49.23 0.51 0.26
M + 1 35.56 ± 1.83 (5.15) 35.27 0.16 0.03
M + 2 11.96 ± 0.50 (42) 12.12 )0.32 0.10
M + 3 2.07 ± 1.74 (84.3) 2.85
M + 4 0.09 + 0.17 (2E+2) 0.48
Phe302
[1–2]
M + 0 71.93 ± 1.28 (1.78) 71.24 0.54 0.29
M + 1 19.89 ± 1.20 (6.03) 19.64 0.21 0.04
M + 2 7.09 ± 0.74 (1.0E+1) 7.52 )0.58 0.34
M + 3 0.78 ± 0.49 (63) 1.34
M + 4 0.04 ± 0.08 (2E+2) 0.23
Consistency index (value of least squares) 135.53 > 66.55
Ó FEBS 2003 Systematic flux analysis using stable isotopes and MS (Eur. J. Biochem. 270) 3531
carboxykinase (reaction 24) are considered the opposite
directions of a single biochemical reaction (the ATP balance
is not included in the model). Similarly for pyruvate
carboxylase (reaction 25) and oxaloacetate decarboxylase
(reaction 26). In metabolite balancing, the stoichiometric
matrix coincides with the sensitivity or derivative matrix
that connects the vector of the unknown net fluxes to the
vector of the extracellular metabolite net excretion rate
measurements. In the case of the considered network, the
rank of the stoichiometric matrix is 43. This indicates the
presence of two groups of parallel competing pathways (i.e.
two groups of unobservable net fluxes) in the considered net
flux network. Singular value decomposition analysis (SVD)
[7,31,53,54] of the reduced low-echelon form of the stoichio-
metric matrix enabled the identification of the net fluxes in
each group (i.e. the nonzero elements of the two vectors in
the null space [53] of the reduced row-echelon form of the
stoichiometric matrix) and the determination of the equa-
tions describing their linear dependency (equivalently this
can be accomplished by identifying the cycles of flow in the
net flux network as described in [49]): (all numbers below
refer to the corresponding reactions in the Appendix)
Group 1: the net fluxes of reaction 10 and combined
reactions 23–24 and 25–26.
Group 2: the net fluxes of reactions 38, 39, 40, 41, 42, 18 and
28.
Both groups include two parallel pathways, competing
for PEP in the case of group 1 (anaplerotic pathways) and
tetrahydrodipicolinate (H4D) in the case of group 2 (lysine
biosynthesis). If at least one net flux from each group or the
net flux ratio at PEP or H4D, respectively, were known,
then all net fluxes in the respective group would be
estimable. Since such information is unavailable, the 10
net fluxes in groups 1 and 2 remain unobservable at this
stage of the analysis.
The number of redundant measurements, estimated from
the difference between the number of measurements and the
rank of the stoichiometric matrix, is three. Redundant
measurements are essential for data reconciliation. Data
reconciliation analysis (see [55–57] for data reconciliation in
linear balance systems in general and [31,58] for data
reconciliation analysis in metabolite balance systems) indi-
cated that the extracellular net excretion rates of ammonia
and carbon dioxide were suspect of containing gross errors.
When these measurements were excluded, the total error of
the analysis (consistency index) was almost equal to 0 [7].
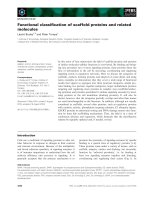
The net fluxes as estimated after excluding these erroneous
measurements from the data are shown in Fig. 4, normal-
ized with respect to the uptake rate of glucose; the latter is
considered to be 100. The estimated net fluxes were consid-
ered constant in the rest of the analysis, while the net fluxes
of the 10 reactions in the singular groups 1 and 2 were
expressed as a function of the net flux ratio at PEP and H4D,
respectively, based on the SVD analysis described earlier.
Flux determination: mass isotopomer distribution
analysis
In this part of the flux analysis, the independent unknowns
are the net flux ratios at PEP and H4D nodes and the
exchange fluxes of all reversible reactions in the network.
Apart from reactions 3, 11, 15–19, 27, 29–33, 36–44 and the
biomass equation which was decomposed in its constituents
from the beginning, the rest of the network reactions were
considered potentially reversible, setting the number of
unknown exchange fluxes to 19.
Observability analysis (1). In mass isotopomer distribu-
tion analysis, the relationship between the measurements
(mass isotopomer fractions) and the unknown fluxes is
nonlinear due to the format of the positional isotopomer
balances. In this case, the numerical representation of the
sensitivity matrix that connects the measurement vector to
the unknown flux vector and represents the mapping of the
fluxes into the available measurements depends not only on
the structure and connectivity of the network, but also on
the substrate labeling and the actual value of the unknown
fluxes. It is through the analysis of this matrix that the
number and the identity of the unobservable fluxes, and
consequently the number of redundant measurements used
in data reconciliation analysis can be determined [46,55–
57,59]. Structural observability analysis [7,55–57,59] takes
into consideration only the structural and not the numerical
representation of the sensitivity matrix. It can identify only
the unknown fluxes that cannot be estimated from
the available measurements due to the connectivity of the
considered metabolic network as this is mapped in the
structure of the sensitivity matrix. Structural observability
analysis has only negative value, i.e. a structurally unob-
servable flux is also numerically unobservable (i.e. it is
unobservable independently of the substrate labeling used
and the value of the unknown fluxes), but the opposite does
not necessarily hold true. It cannot identify numerical
Fig. 4. The estimated net flux distribution.
3532 M. I. Klapa et al. (Eur. J. Biochem. 270) Ó FEBS 2003
singularities neither differentiate between substrate labelings
if they do not clearly change the connectivity of the network.
However, one important aspect of structural observability
analysis is that by studying the connectivity of potential
measurements to the unknown fluxes, it is possible to
determine which additional data could, in principle, increase
the resolution of the flux network in the absence of
numerical singularities (further details about structural
observability analysis of complex metabolic networks from
isotopic tracer data can be found in [7]). Fig. 5 shows an
example of structural observability analysis in the context of
a linear pathway of two reversible reactions.
In the present study the structurally unobservable fluxes
are: (a) the exchange fluxes of fructose-6-phosphate aldo-
lase (reaction 4) and triose-phosphate isomerase (reaction
5) – Based on the structure of these two reactions, for their
exchange fluxes to be estimable, appropriate information
about the isotopic tracer distribution of fructose 1,6-
bisphosphate (FRU1,6bisP) and dihydroxyacetone phos-
phate (DHAP), respectively, should be available [7]
(Fig. 5). With the existing measurements the reactions 3,
4 and 5 are actually observed as one irreversible reaction
producing two molecules of glyceraldehydes-3-phosphate
(GAP) from one molecule of fructose-6-phosphate
(FRU6P) (see Figs 5 and 6); (b) the exchange fluxes of
GAP dehydrogenase (no. 6) and phosphoglycerate kinase
(no. 7) – These exchange fluxes would have been estimable
only if appropriate information about the isotopic tracer
distribution of GAP and 1,3-bis-phosphoglycerate
(1,3BPG) had been provided (Fig. 5). With the existing
measurements the pools of GAP, 1,3BPG and 3-phospho-
glycerate (G3P) are observed as one pool depicted in Fig. 6
as GAP/G3P. Information about the isotopic tracer
distribution of GAP/G3P pool is provided from the mass
isotopomer measurements of glycine; (c) the exchange
fluxes of phosphoglycerate mutase (no. 8) and 2-phospho-
glycerate enolase (no. 9) cannot be determined independ-
ently – Since information about the isotopic tracer
distribution of GAP/G3P and PEP (from phenylalanine)
pools, but not for this of 2-phosphoglycerate (2-PG), is
available, the two reactions are observed as one reversible
reaction between the GAP/G3P and PEP pools; (d) the
exchange flux of glutamate synthase reaction (no. 28) –
Because no information about the isotopic tracer distribu-
tion of alpha-ketoglutarate (aKG) is available, the aKG
Fig. 5. Structural observability analysis of a linear pathway comprising
two reversible reactions. It is assumed that the net flux through the
linear pathway and the isotopic tracer distribution of metabolite C are
known. (A) If the isotopic tracer distribution of neither A or B is
measurable, then the exchange fluxes of the two reactions are not
observable and the pools A and B cannot be considered independently
of pool C. (B) If only the isotopic tracer distribution of metabolite B is
measurable, then the pools of A and B are observed as one, i.e. they
have to be grouped. (C) If only the isotopic distribution of metabolite
A is measurable, then the B metabolite pool is not observable and the
two reversible reactions are conceived as one consuming A to produce
C. The exchange flux of this reaction is, in principle, estimable.
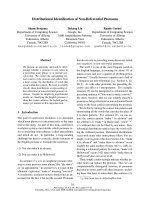
Fig. 6. The structurally observable C. glu tamicum flux network, based
on the available mass isotopomer measurements (the zero acetate, lactate
and trehalose production rates are known from metabolite balancing
analysis). The metabolite pools whose mass isotopomer distribution is
reflected in the mass isotopomer measurements of the biomass
hydrolysates are depicted within a gray box.
Ó FEBS 2003 Systematic flux analysis using stable isotopes and MS (Eur. J. Biochem. 270) 3533
and glutamate pools are observed as one (depicted by
aKG/Glu in Fig. 6); (e) the exchange flux of aspartate
amino transferase reaction (no. 34) – Because no informa-
tion about the isotopic tracer distribution of oxaloacetate is
available, the pools of aspartate (Asp) and oxaloacetate
(OAA) are observed as one pool; (f) the exchange fluxes of
fumarase (no. 21) and malate dehydrogenase (no. 22)
reactions – Because information about the isotopic tracer
distribution of neither fumarate (FUM) nor malate (MAL),
respectively, is available, the pools of OAA, MAL, FUM
are observed as one (along with Asp as discussed in the
previous paragraph) (see Fig. 6); (g) the exchange flux of
aspartate kinase reaction (no. 35) – Independently of this
exchange flux value, the pools of aspartate and aspartic-
semialdehyde will always have the same isotopic tracer
distribution. This holds true because aspartic semialdehyde
ÔreceivesÕ the isotopic tracer only from aspartate, while its
downstream pathway towards lysine is irreversible.
Thus, 10 out of the 19 initially unknown exchange
fluxes are not observable from the available measurements
as mandated from the structure of the network. Fig. 6
shows the metabolic flux network of C. glutamicum that is
structurally observable from the available MS measure-
ments. At this point, flux quantification (i.e. weighted
nonlinear regression of the mass isotopomer measure-
ments) can be performed with all the structurally observ-
able fluxes as unknowns. Any numerical singularities, due
to the values of the measurements (based on the chosen
substrate labeling) and the error associated with them,
that render a structurally observable flux numerically
unobservable, can be determined after flux quantification,
when the flux confidence intervals are estimated. The
confidence interval of a numerically unobservable flux will
be equal or exceed the feasible range of values for this
flux. In the next paragraphs, we describe the quantifica-
tion of the 9 exchange and 2 net fluxes from 61 (see
explanation later) MS measurements.
Validation of assumptions and measurement accuracy in
the context of the C. glutamicum intracellular
biochemistry (2). There are three topics to discuss: (a)
culture does not produce homoserine (or threonine and
methionine) – The C. glutamicum lysine biosynthesis net-
work considered in flux quantification (see Appendix) does
not include the reactions for homoserine biosynthesis and
downstream reactions for threonine and methionine
production (see Fig. 4). Even though the ATCC 21799
strain can produce homoserine, it was assumed that it did
not, because threonine and methionine were provided in
excess in the chemostat feed. The mass isotopomer
measurements of threonine and methionine validated this
assumption. Neither the mass isotopomer distribution of
threonine nor that of methionine indicated the presence of
isotopic tracer in these pools at levels higher than natural
abundance (data not shown). If the cells had been
synthesizing any homoserine, then threonine and
methionine would have been isotopically enriched from
the labeling of glucose; (b) validation of mass isotopomer
measurements through satisfaction of redundancies –
Redundant measurements can be used to validate
measurement accuracy. In the considered network, such
an example is provided by the measured mass isotopomer
fractions of Asp, Ala and Glu derivatives. As discussed in
the observability section, Asp and OAA are seen as a single
pool, the same holding for the pools of aKG and Glu.
According to the assumed stoichiometry of the first three
reactions of the TCA cycle (no. 16, 17 and 18), the last three
carbon atoms of OAA/Asp become the first three carbon
atoms of aKG/Glu (see Fig. 7), while the carbon atoms of
acetyl-CoA (AcCoA) become the last two carbon atoms of
aKG/Glu. The carbon atoms of AcCoA originate from the
last two carbon atoms of pyruvate, the mass isotopomer
distribution of which is reflected in this of alanine.
Therefore, the mass isotopomer distribution of Glu can be
estimated from the mass isotopomer distribution of
fragment [2-4] of OAA (or Asp) and fragment [2-3] of
pyruvate (PYR) (or Ala) based on the following
relationships:
ðM þ 0Þ
Glu½1-5
¼ðM þ 0Þ
OAA ½2-4
ÂðM þ 0Þ
PYR ½2-3
ðM þ 1Þ
Glu½1-5
¼ðM þ 0Þ
OAA ½2-4
ÂðM þ 1Þ
PYR ½2-3
þðM þ 1Þ
OAA ½2-4
ÂðM þ 0Þ
PYR ½2-3
ðM þ 2Þ
Glu½1-5
¼ðM þ 0Þ
OAA ½2-4
ÂðM þ 2Þ
PYR ½2-3
þðM þ 1Þ
OAA ½2-4
ÂðM þ 1Þ
PYR ½2-3
þðM þ 2Þ
OAA ½2-4
ÂðM þ 0Þ
PYR ½2-3
ðM þ 3Þ
Glu½1-5
¼ðM þ 1Þ
OAA½2-4
ÂðM þ 2Þ
PYR ½2-3
þðM þ 2Þ
OAA½2-4
ÂðM þ 1Þ
PYR ½2-3
þðM þ 3Þ
OAA ½2-4
ÂðM þ 0Þ
PYR ½2-3
ðM þ 4Þ
Glu½1-5
¼ðM þ 2Þ
OAA ½2-4
ÂðM þ 2Þ
PYR ½2-3
þðM þ 3Þ
OAA½2-4
ÂðM þ 1Þ
PYR ½2-3
ðM þ 5Þ
Glu½1-5
¼ðM þ 3Þ
OAA ½2-4
ÂðM þ 2Þ
PYR ½2-3
ð1Þ
If the measured mass isotopomer distributions of Glu,
fragment [2-4] of Asp and fragment 2-3 of Ala do not
contain any gross errors, then the estimated (from Eqn 1)
and measured mass isotopomer distribution of glutamate
should be statistically identical. As there are 11 unknown
fluxes and 61 measurements, this kind of redundancy is
expected in other parts of the network as well, thus
enhancing the accuracy of flux estimates; (c) flux distribu-
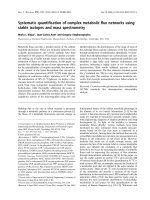
tion around the PEP and PYR nodes – Figure 8A shows the
stoichiometry of the pathways responsible for the label
transfer to Gly and Val. When glucose (substrate) is labeled
only at carbon 1, then, due to the stoichiometry of carbon
transfer through the pentose phosphate and glycolysis
pathways, most of the isotopic tracer of glucose is expected
tobetransferredtothethirdcarbonatomoftheGAP/G3P
pool. Assuming that this is indeed the case and the first two
carbon atoms of GAP/G3P are at natural abundance,
Fig. 8B illustrates the fate of the isotopic tracer throughout
the depicted metabolic network, if all the involved reactions
were irreversible. All four carbon atoms of oxaloacetate are
expected to be labeled due to the label scrambling through
the TCA cycle. In this scenario, the first two carbon atoms
of the GAP/G3P pool, and consequently Gly, these of PEP,
and thereby Phe, and these of PYR, and thereby Val, are
expected to be at natural abundance. Fig. 8C, on the other
3534 M. I. Klapa et al. (Eur. J. Biochem. 270) Ó FEBS 2003
hand, shows what the fate of the isotopic tracer would be, if
all the reactions of the depicted network were reversible. In
this case, the isotopic tracer of the substrate is expected to
also ÔreachÕ the first two carbon atoms of the GAP/G3P,
Gly, PEP, Phe, PYR and Val pools. Fig. 9A shows the
measured steady-state
13
C mass isotopomer distribution of
Gly, fragment [1-2] of Phe and fragment [1-2] of Val. The
first column of the histogram represents the theoretical mass
isotopomer distribution of a two-carbon atom molecule at
natural abundance. It is clear that both Gly and fragment
[1-2] of Phe are practically unlabeled, while fragment [1-2] of
Val is labeled. The metabolic scenario that allows this to
happen involves irreversibility between the pool of PEP and
those of OAA and PYR. In other words, prelimary analysis
of the measurements provides evidence that PEP carboxy-
kinase (no. 24) and PEP synthase (the reverse direction of
no. 10) do not carry flux under the conditions of the
experiment. OAA decarboxylase (no 26), on the other hand,
should carry flux to allow the isotopic tracer to reach the
first two carbon atoms of pyruvate and thereby valine (see
Fig. 9B). These results are in agreement with previous
physiological studies (see Discussion).
Flux quantification using MS measurements (3). Mass
isotopomer distribution analysis was performed using only
61 measurements out of the set depicted in Table 2. Due to
the low reliability and reproducibility of mass isotopomer
Fig. 7. The measured mass isotopomer distribution of glutamate (cal-
culated from the TBDMS-Glu fragment 432) compared with its esti-
mated value, as it was calculated from the measured fragments [2-4] of
OAA (Asp) ) from TBDMS-Asp fragment 390 – and [2-3] of PYR
(Ala) ) from TBDMS-Ala fragment 232 ) based on Eq. (1). The
relationship between the carbon atoms of Glu and these of OAA [2-4]
and Ala [2-3] are shown in the upper right part of the figure. In the
calculations only the mass isotopomer fractions of the TBDMS-
derivatives considered in flux quantification (as shown in Table 2) were
used.
Fig. 8. Labeling scrambling through the pathways connecting Gly to
Val. (A) The stoichiometry of the pathways connecting Gly to Val.
The color code illustrates the stoichiometry of carbon transfer among
the metabolites of these pathways. (B) As Glc (substrate) is labeled at
carbon 1, almost the entire amount of isotopic tracer is expected to
reach the third carbon of the GAP/G3P pool (if a carbon is labeled, it
has an asterisk next to it). If all the reactions of the depicted network
were irreversible, then Gly and fragments [1-2] of Phe and Val are
expected to be (almost) at natural abundance. All four carbon atoms of
OAA are labeled because of the labeling scrambling through the TCA
cycle. (C) If all the involved reactions were reversible, then glycine and
fragments [1-2] of Phe and Val are expected to be (at a low level)
labeled.
Fig. 9. Preliminary data analysis provides evidence that PEP carboxy-
lase (no. 24) and PEP synthase (the reverse direction of no 10) do not
carry flux under the conditions of the experiment. (A) The measured
steady-state mass isotopomer distribution of Gly and fragments [1-2]
of Phe and Val (ÔbareÕ carbon skeleton). Compared with the mass
isotopomer distribution of a 2-carbon atom molecule at natural
abundance, Gly and fragment [1-2] of Phe are unlabeled, while frag-
ment [1-2] of Val is labeled. (B) The metabolic scenario that is con-
sistent with the experimental data (see Fig. 8 for definition of the
metabolites and the color code).
Ó FEBS 2003 Systematic flux analysis using stable isotopes and MS (Eur. J. Biochem. 270) 3535
fractions smaller than 3% [7,44], only mass isotopomer
fractions greater than 3% and associated error smaller than
20% of the measured values were deemed reliable sensors of
the in vivo fluxes. In addition, the one set of non-
continuously differentiable constraints [45], i.e. the
equations defining the exchange fluxes as a function of the
forward and reverse fluxes of the reversible biochemical
reactions, was transformed into continuously differentiable
after using information about the direction of the
corresponding net fluxes from metabolite balancing
analysis. Only the direction of the net flux of the
combined PEP carboxylase and carboxykinase, and PYR
carboxylase and OAA decarboxylase reactions remained
unknown after metabolite balancing analysis. It was
assumed that both net fluxes follow the direction towards
OAA, which had been determined as the direction of their
sum (nongluconeogenic conditions). All exchange fluxes
were assigned an upper bound (additional constraint) to
increase the stability of the convergence process. Potential
instability was also reported by Schmidt et al. (1999) [60]
(see also [8,45]). Defining
m
exch
j
½0; 1¼
m
exch
j
m
exch
j
þ 1
½45
where m
exch
j
the j-th unknown exchange flux of the
network, each m
exch
j
[0,1] was upper bounded by 0.95.
All constraints of the problem were generated by a
WINDOWS
-basedsoftwarewritteninObjectPascalinthe
DEPLHI
2 environment (ÔBorland International Inc. 1996,
www.borland.com). The software comprised a relational
database of all biochemical reactions in Escherichia coli
and C. glutamicum, allowing the automatic choice of the
network structure by the user. The constraints were then
introduced into the General Algebraic Modeling
System (GAMS) environment (ÔGAMS Development
Corporation, 1998, www.gams.com), a high-level mode-
ling system for mathematical programming problems, and
the weighted least-squares mass isotopomer analysis
problem with nonlinear constraints was solved using
CONOPT (documentation about the CONOPT solver
can be found in www.gams.com).
Multiple initial guesses were used; the system, however,
converged to the same solution for all the numerically
observable fluxes (see footnote d, Table 3). The net flux
ratios at PEP and H4D and the exchange flux of 1-trans-
ketolase reaction (no 12) in the pentose phosphate pathway
were numerically unobservable. Table 3 shows the 90%
marginal confidence intervals of the eight observable
exchange fluxes. The confidence intervals of the exchange
fluxes were first estimated in the m
exch
[0,1] space, and then
transformed back to the m
exch
space, as described in [45]. For
this set of flux estimates, the least-squares sum (i.e. total
error) was 135.53. Table 2 shows the fitted values of the
mass isotopomer fractions relatively to the measured ones.
Since the v
2
-value for (61–8) ¼ 53 redundant measurements
and 90% confidence is equal to 66.55, the considered set of
measurements does not initially pass the v
2
statistical test.
Although the difference between the total error of this
analysis and the v
2
-value is much smaller than others
reported in the literature both for NMR and MS data (see
[20]), it is important to investigate the sources of such an
Table 3. Estimated values of the two unknown net flux ratios (around PEP and 2-amino-6-ketopimelate) and the nine exchange fluxes. The last column
of the table shows the marginal 90% confidence intervals for each of the flux estimates. All values have been normalized with respect to the uptake
rate of glucose.
Flux name
Value (normalized with
respect to glucose rate)
Marginal 90%
confidence interval
Net flux of PEP carboxylase
a
Not observable
Exchange flux of PEP carboxylase
a
0 [0,0]
Net flux of pyruvate carboxylase
b
Not observable
Exchange flux of pyruvate carboxylase
b
20.3 · total anaplerotic net flux [13,43] · total anaplerotic net flux
Exchange flux of pyruvate kinase
c
0 [0,0]
Net flux ratio between the four-step and the
one-step pathway of lysine biosynthesis
Not observable
Exchange flux of glucose-6-phosphate isomerase reaction 0 [0, 0.6 · 73.6]
Exchange flux of 1-transketolase reaction Not observable
Exchange flux of 2-transketolase reaction 281 · 4.3 [48.7 · 4.3,1]
Exchange flux of transaldolase reaction in PPP 9.5 · 6.9 [3.3 · 6,9,1]
Exchange flux of reaction GAP/G3P fi PEP 0
d
[0,0]
Exchange flux of reaction SUC fi FUM 15 · 72.3 [7.9 · 72.3, 235 · 72.3]
a
To formulate the mass balances, PEP carboxylase and PEP carboxykinase were considered as the two opposite directions of one reaction
under the name PEP carboxylase. The fact that the exchange flux of this reaction was found equal to 0 means that PEP carboxykinase does
not carry flux in vivo.
b
To formulate the mass balances, pyruvate carboxylase and oxaloacetate decarboxylase were considered as the two
opposite directions of one reaction under the name pyruvate carboxylase.
c
To formulate the mass balances, pyruvate kinase and PEP
synthase were considered as the two opposite directions of one reaction under the name pyruvate kinase. The fact that the exchange flux of this
reaction was found equal to 0 means that PEP synthase does not carry flux in vivo.
d
At a second identified local minimum, the exchange flux of
that reaction is estimated larger than 20 times the net flux of the reaction (the rest of the flux estimates and the value of the objective function
remain the same). This is true, because in this case the two scenarios: (a) irreversible reaction and (b) reaction at equilibrium, are practically
identical. Because of the irreversibility between PEP and the lower part of the network, both cases indicate that the pools of GAP, G3P and
PEP (and all the other intermediates) have the same labeling and are practically observed as one metabolite pool.
3536 M. I. Klapa et al. (Eur. J. Biochem. 270) Ó FEBS 2003
inconsistency and propose ways to decrease it. From
Table 2, it can be observed that the measurements contri-
buting most to the total error are the fractions (M + 0) and
(M + 1) of fragment 260 of Ala, fraction (M + 0) of
fragment 288 of Val and all the measurements associated
with fragment 186 of Val. All six measurements are
redundant and can be eliminated with no loss of informa-
tion about the flux network (i.e. the elimination will not
affect the degree of observability of the flux network). Due
to the irreversibility at PEP (see Discussion) and the
structure of the lower part of the network, this elimination
could, in principle, affect only the exchange flux of the
combined reaction 25–26. Using, however, the smaller
measurement set, the problem converged to the same
solution as earlier. The 90% confidence intervals of the
exchange fluxes were minimally affected from the elimin-
ation. The total error of the analysis, however, decreased to
58.84, relatively to a v
2
-value for 55–8 ¼ 47 redundant
measurements and 90% confidence of 59.8. This is an
indication that the six mass isotopomer fractions are the
main sources of error in the measurement set. Moreover, the
flux estimates presented are now based on a consistent
measurement set. This is a noteworthy result considering
that prior flux analyses of entire networks from isotopic
measurements have failed criteria of statistical consistency
[20]. We believe that in the case of prior flux analyses based
on MS measurements, this was due primarily to the fact that
even the smaller least reliable mass isotopomer fractions
were considered in the flux analysis.
Discussion
In the work described, we examined the extent to which
mass isotopomer measurements of biomass hydrolysates,
after the introduction of only one labeled substrate
([1-
13
C]glucose), can elucidate the lysine biosynthesis flux
network of C. glutamicum under glucose-limited growth
in continuous culture (D ¼ 0.1Æh
)1
). Probing the mass
isotopomer distribution of biomass hydrolysates is benefi-
cial, because it allows the measurement of the isotopic tracer
distribution of central carbon metabolism intermediates
that are not excreted extracellularly and would have been
challenging to be measured otherwise. Observability and
bioreaction network analysis enabled the identification of
the intracellular interactions that can indeed be determined
from the available measurements. Very few assumptions
about the reaction reversibility were initially made. Only the
reactions that participate in product synthesis pathways or
are known to have high negative free energy under the
present experimental conditions were considered irreversible
(see also notes in Appendix). Any subsequent metabolite
pool lumping was mandated by observability analysis only
and initial assumptions were validated through data
redundancies. For example, isocitrate synthase, which in
our network analysis was considered irreversible, has been
reported to be reversible in vivo [61]. However, structural
observability analysis indicates that the experimental setup
of Des Rosiers et al. [61] allowed the determination of this
exchange flux, while, in our case, such estimation was not
possible. When the isotopic tracer distribution of OAA and
Glu are measurable, the exchange flux of isocitrate dehy-
drogenase is observable only if proper information about
the isotopic tracer distribution of isocitrate is also available.
We lacked any such information, while Des Rosiers et al.
(1994) [61] obtained it indirectly from the isotopic tracer
distribution of AcCoA produced from isocitrate.
An important result of our analysis concerning C. glu-
tamicum physiology was the determination of the exchange
flux of PEP carboxykinase and pyruvate synthase. These
reactions are part of the structurally entangled set of
C. glutamicum anaplerotic reactions, which makes the
determination of their flux a challenging task. According
to our measurements, PEP carboxykinase and pyruvate
synthase do not carry flux under the described experimental
conditions. This is in agreement with previous (in vitro)
physiological studies that indicated no PEP carboxykinase
activity under nongluconeogenic conditions [30], while, in
most studies, pyruvate synthase is assumed to be inactive in
C. glutamicum [42]. This result contradicts, however, the
flux estimates of Petersen et al. (2001) [42], who reported a
relatively high in vivo PEP carboxykinase activity even when
glucose was the main carbon source. While it is always risky
to compare two different strains, it is speculated that the
high PEP carboxykinase flux in [42] is the result of lactate
use ) even at small quantities ) as a second labeling source.
Lactate might have triggered gluconeogenesis, hence the
high PEP carboxykinase activity.
The very high futile cycle identified between PYR and
OAA pools has double significance: (a) it indicates a highly
active OAA decarboxylase enzyme. This validates for the
first time previous physiological studies which identified a
high in vitro OAA decarboxylase activity in glucose cultured
cell-free extracts [31], when PEP carboxykinase was com-
pletely inactive. In their analysis, Marx et al. (1996) [40,41]
reported a futile cycle between OAA and the combined
PEP/PYR pool, while Petersen et al. (2001) [42] reported a
relatively high activity of the PEP carboxykinase reaction
and a lower activity of OAA decarboxylase in vivo.These
results support the presence of futile cycles among the OAA
pool and the pools of PEP or PYR. However, the very high
in vivo activity of OAA decarboxylase observed in the
present study has not been reported elsewhere in bacterial
studies. Only in liver cells, pyruvate recycling at rates up to
three times that of the TCA cycle has been reported [62,63],
when a mixture of substrates is used; this is in agreement
with our results. Interestingly though, because OAA and
MAL are considered as one pool based on the available
aspartate and glutamate measurements, OAA decarboxy-
lase activity cannot be distinguished from malic enzyme
activity. Therefore, the high flux from OAA/MAL pool to
pyruvate could be due to malic enzyme. This enzyme,
however, was deemed inactive, when glucose is used as
substrate [31]; (b) the flux of pyruvate carboxylase is at least
13 times larger than this of PEP carboxylase. Assuming that
the net fluxes of the combined (23–24) and (25–26) reactions
follow the same direction as their normalized sum (i.e. 23.5),
then the normalized flux of PEP carboxylase (reaction 23)
can vary between 0 and 23.5, since PEP carboxykinase (24)
is inactive. On the other hand, the exchange flux of the
combined (25–26) reaction is estimated to be at least 13
times the total anaplerotic net flux (i.e. 23.5), implying that
the flux of pyruvate carboxylase varies between 13 · 23.5
and (43 · 23.5 + 23.5). This is a very important physiolo-
gical result in agreement with previous studies that indicated
Ó FEBS 2003 Systematic flux analysis using stable isotopes and MS (Eur. J. Biochem. 270) 3537
pyruvate carboxylase to be the main anaplerotic route of
C. glutamicum under nongluconeogenic conditions. Speci-
fically, Park et al. [38] estimated the flux through pyruvate
carboxylase to be equal to 90% of the total anaplerotic
activity. The analysis of Petersen et al.[42]showedalsothe
pyruvate carboxylase activity to be higher than this of PEP
carboxylase. The present analysis connects the very high
in vivo activity of pyruvate carboxylase to the function of the
futile cycle between OAA and pyruvate.
Comparing our analysis to that of Marx et al. [40,41],
who used NMR measurements of biomass hydrolysates
and [1-
13
C] labeling to elucidate the flux network of
C. glutamicum grown only in glucose, MS measurements
proved superior in elucidating the anaplerotic flux distri-
bution of this microorganism. The zero flux of PEP
carboxykinase and PEP synthase observed in our analysis
was based on the difference in the mass isotopomer
distribution of fragment [1-2] between Gly, Phe and Val. In
the data of Marx et al. (1996) [40,41], the label enrichment
of the first carbon atoms of Ala and Phe were not
detectable (see also [42]), while the label enrichment of the
second carbon atoms of these two metabolites and Gly
were statistically identical, due to relatively large associated
errors. Additionally, the first two carbon atoms of PEP and
PYR were indistinguishable, necessitating the lumping of
the two pools and the two reactions, PEP and pyruvate
carboxylase, as well as PEP carboxykinase and OAA
decarboxylase, into one. Additionally, in MS, but not in
NMR, the unlabeled fraction of a metabolite or fragment
can be measured. This is advantageous, because, if the
ÔlabeledÕ mass isotopomer fractions are small and prone to
measurement errors, the unlabeled fraction is larger and
more accurate, validating the less accurate ÔlabeledÕ meas-
urements (redundancy).
On the other hand, MS measurements proved inferior to
NMR measurements in elucidating the relative activity of
the two parallel pathways in lysine biosynthesis. While
this flux ratio is structurally observable from the mass
isotopomer distribution of lysine, fragments [1-4] and [2-4]
of OAA and [1-3] and [2-3] of PYR [7], the obtained
measurements of these mass isotopomer fractions are not
adequate to allow determination of the unknown flux ratio.
Using these MS measurements, estimation of the flux split
ratio is based only on the difference in the label enrichment
of the first lysine carbon atom depending on the pathway
followed. Structurally, the enrichment of the first lysine
carbon atom enables the discrimination between the two
lysine biosynthesis pathways, because it originates from the
first carbon atom either of OAA or PYR depending on the
followed pathway. However, both these carbon atoms are
expected to be almost unlabeled when [1-
13
C] glucose is
used, thus practically limiting the numerical discriminatory
power of this measurement. Previous extensive studies
[35,36] showed that, when [1-
13
C] glucose is used, it is
primarily the difference in the label enrichment of carbons 3
and 5 and to a lesser extent of 2 and 6 of lysine that enables
the estimation of the flux ratio at H4D using NMR
measurements.
Finally, the irreversibility between the PEP and the PYR
and OAA pools renders the upper (up to PEP) and lower
part of the network practically independent. Therefore, flux
analysis (including observability and data reconciliation
analysis) of the upper and lower parts could be performed
separately. This means that flux unobservability or meas-
urement inaccuracies in one part of the network should not
affect the flux estimates in the other part.
Acknowledgements
We acknowledge with gratitude support by the National Science
Foundation, Grant No. BES – 9985421 and the DuPont-MIT Alliance
program.
References
1. Stephanopoulos, G. (1998) Metabolic fluxes and metabolic
engineering. Metab. Eng. 1, 1–10.
2. Bailey, J.E. (1998) Mathematical modeling and analysis in bio-
chemical engineering. Past Accomplishments Future Opportunit-
ies. Biotechnol. Prog. 14, 8–20.
3. Nielsen, J. (1998) Metabolic engineering: techniques for analysis
of targets for genetic manipulations. Biotechnol. Bioeng. 58,
125–132.
4. Klapa, M.I. & Stephanopoulos, G. (2000) Metabolic flux analysis.
In Bioreaction Engineering: Modeling and Control. (Schugerl, K.
and Bellgardt, K.H., eds). Springer, Berlin Heidelberg New York.
5. Stephanopoulos, G., Aristidou, A. & Nielsen, J. (1998) Metabolic
Engineering: Principles and Methodologies.AcademicPress,
San Diego.
6. Bonarius, H.P.J., Schmid, G. & Tramper, J. (1997) Flux analysis
of undetermined metabolic networks: the quest for the missing
constraints. TIBTECH 15, 308–314.
7. Klapa, M.I. (2001) High resolution metabolic flux quantification
using stable isotopes and mass spectrometry. PhD Thesis,
Massachusetts Institute of Technology, Cambridge, MA, USA.
8. Wiechert, W., Mollney, M., Isermann, N., Wurzel, W. & de Graaf,
A.A. (1999) Bidirectional reaction steps in metabolic networks.
III. Explicit solution and analysis of isotopomer labeling systems.
Biotechnol. Bioeng. 66, 69–85.
9. Szyperski, T. (1995) Biosynthetically directed fractional
13
Clabe-
ling of proteinogenic amino-acids ) an efficient analytical tool
to investigate intermediary metabolism. Eur. J. Biochem. 232,
433–448.
10. Lindenthal, B., Aldaghlas, T.A., Holleran, A.L., Sudhop, T.,
Berthold,H.K.,vonBergmann,K.&Kelleher,J.K.(2002)Iso-
topomer spectral analysis of intermediates of cholesterol synthesis
in human subjects and hepatic cells. Am. J. Physiol. Endocrinol.
Metab. 282, E1222–E1230.
11. Chatham John, C., Des Rosiers Christine. & Forder John, R.
(2001) Evidence of separate pathways for lactate uptake and
release by the perfused rat heart. Am.J.Physiol.Endocrinol.
Metab. 281, E794–E802.
12. Kelleher, J. (2001) Flux estimation using isotopic tracers. Com-
mon ground for Metabolic physiology and metabolic engineering.
Metab. Eng. 3, 100–110.
13. Kelleher. J. (1999) Estimating gluconeogenesis with [U-
13
C] glu-
cose: molecular condensation requires a molecular approach. Am.
J. Physiol. Endocrinol. Metab. 277, E395–E400.
14. Wittmann, C. & Heinzle, E. (2001) Application of MALDI-TOF
MS to lysine-producing Corynebacterium glutamicum ) anovel
approach for metabolic flux analysis. Eur. J. Biochem. 268,
2441–2455.
15. Christensen, B. & Nielsen, J. (1999) Isotopomer analysis using
GC-MS. Metab. Eng. 1, 282 (E8)–290 (E16).
16. Christensen, B. & Nielsen, J. (2000) Metabolic network analysis of
Penicillium chrysogenum using
13
C-labeled glucose. Biotechnol.
Bioeng. 68, 652–659.
3538 M. I. Klapa et al. (Eur. J. Biochem. 270) Ó FEBS 2003
17. Christiansen, T., Christensen, B. & Nielsen, J. (2002) Metabolic
network analysis of Bacillus clausii on minimal and semirich
medium using (13) C-labeled glucose. Metab. Eng 4, 159–169.
18. Fischer, E. & Sauer, U. (2003) Metabolic flux profiling of
Escherichia coli mutants in central carbon metabolism using
GC-MS. Eur. J. Biochem. 270, 880–891.
19. Dauner, M., Sonderegger, M., Hochuli, M., Szyperski, T.,
Wuthrich,K.,Hohmann,H.P.,Sauer,U.&Bailey,J.E.(2002)
Intracellular carbon fluxes in riboflavin-producing Bacillus subtilis
during growth on two-carbon substrate mixtures. Appl. Environ.
Microbiol. 68, 1760–1771.
20. Mollney, M., Wiechert, W., Kownatzki, D. & de Graaf, A.A.
(1999) Bidirectional reaction steps in metabolic networks. IV.
Optimal design of isotopomer labeling experiments. Biotechnol.
Bioeng. 66, 86–103.
21. Kinoshita, S. (1985) Glutamic acid bacteria. In Biology of Indus-
trial Microorganisms (Demain, A.L. & Solomon, N.A., eds),
pp. 115–142. The Benjamin/Cummings Publishing Co, London.
22. Nakayama, K. (1982) Amino Acids. In Prescott and Dunn’s
Industrial Microbiology (Reed, G., ed.), 5th edn, pp. 748–801.
AVI. Publications. Co, Westport.
23. Otsuka, S.I., Miyajima, R. & Shiio, I. (1965) Comparative Studies
on the mechanism of microbial glutamate formation. I. Pathways
of glutamate formation from glucose in Brevibacterium flavum and
in Micrococcus glutamicum. J. General Appl. Microbiol. 11,
285–294.
24. Shiio, I., Yokota, A. & Sugimoto, S.I. (1987) Effect of pyruvate
kinase defficiency on
L
-lysine productivities of mutants with
feedback-resistant aspartokinases. Agric. Biol. Chem. 51, 2485–
2493.
25. Kiss, R.D. & Stephanopoulos, G. (1992) Recent advances in the
physiology and genetics of amino acid producing bacteria.
Metabolic characterization of a
L
-lysine producing strain by
continuous culture. Biotechn Bioeng. 39, 565–574.
26. Gubler, M., Park, S.M., Jetten, M., Stephanopoulos, G. &
Sinskey, A.J. (1994) Effects of phosphoenolpyruvate-carboxylase
deficiency on metabolism and lysine production in Corynebacter-
ium glutamicum. Appl. Microbiol. Biotechnol. 40, 857–863.
27.Colon,G.E.,Jetten,M.S.M.,Nguyen,T.T.,Gubler,M.E.,
Follettie, M.T., Sinskey, A.J. & Stephanopoulos, G. (1995) Effect
of inducible THRB expression of amino acid production in
Corynebacterium lactofermentum ATCC 21799. Appl. Biochem.
Biotechnol. 61, 74–78.
28. Jetten, M.S.M. & Sinskey, A.J. (1995a) Metabolic engineering of
Corynebacterium glutamicum. Recombinant DNA Technol. II. Ann.
NY Acad. Sci. 721, 12–29.
29. Jetten, M.S.M. & Sinskey, A.J. (1995b) Recent advances in the
physiology and genetics of amino acid producing bacteria. Crit
Rev. Biotechnol. 15, 73–103.
30. Jetten, M.S.M., Pitoc, G.A., Follettie, M.T. & Sinskey, A.J. (1994)
Regulation of Phospho (enol) pyruvate and oxaloacetate con-
verting enzymes in Corynebacterium glutamicum. Appl. Microbiol.
Biotechnol. 41, 47–52.
31. Vallino, J.J. (1991) Identification of branch-point restrictions in
microbial metabolism through metabolic flux analysis and local
network perturabations. PhD Thesis. Massachusetts Institute of
Technology, Cambridge, MA, USA.
32. Vallino, J.J. & Stephanopoulos, G. (1993) Metabolic flux dis-
tributions in Corynebacterium glutamicum during growth and
lysine overproduction. Biotechnol. Bioeng. 41, 633–646.
33. Simpson, T.W., Colon, G.E. & Stephanopoulos, G. (1995) 2
Paradigms of metabolic engineering applied to amino acid bio-
synthesis. Biochem. Soc. Trans. 23, 381–387.
34. Simpson, T.W., Shimizu, H. & Stephanopoulos, G. (1998)
Experimental determination of group flux control coefficients in
metabolic networks. Biotechnol. Bioeng. 58, 149–153.
35. Sonntag,K.,Eggeling,L.,deGraaf,A.A.&Sahm,H.(1993)
Flux partitioning in the split pathway of lysine synthesis in
Corynebacterium glutamicum. Quantification by
13
C-NMR and
1
H-NMR spectroscopy. Eur. J. Biochem. 213, 1325–1331.
36. Shaw-Reid, C.A. (1997) Branchpoint flux analysis in the
L
-lysine
pathway of Corynebacterium glutamicum. PhD Thesis. Massa-
chusetts Institute of Technology, Cambridge, MA, USA.
37. Shaw-Reid, C.A., McCormick, M.M., Sinskey, A.J. & Stepha-
nopoulos, G. (1999) Flux through the tetrahydrodipicolinate
succinylase pathway is dispensable for
L
-lysine production in
Corynebacterium glutamicum. Appl. Microbiol. Biotechnol. 51,
325–333.
38. Park, S.M., Shaw-Reid, C., Sinskey, A.J. & Stephanopoulos, G.
(1997a) Elucidation of anaplerotic pathways in Corynebacterium
glutamicum via 13C-NMR spectroscopy and GC-MS. Appl.
Microbiol. Biotechnol. 41, 47–52.
39. Park, S.M., Sinskey, A.J. & Stephanopoulos, G. (1997b) Meta-
bolic and physiological studies of Corynebacterium glutamicum
mutants. Biotechnol. Bioeng. 55, 864–879.
40. Marx, A., deGraaf, A.A., Wiechert, W., Eggeling, L. & Sahm, H.
(1996) Determination of the fluxes in the central metabolism of
Corynebacterium glutamicum by nuclear magnetic resonance
spectroscopy combined with metabolite balancing. Biotechn
Bioeng. 49, 111–129.
41. Marx, A., Striegel, K., deGraaf, A.A., Sahm, H. & Eggeling, L.
(1997) Response of the central metabolism of Coryne-
bacterium glutamicum to different flux burdens. Biotechnol.
Bioeng. 56, 168–180.
42. Petersen, S., de Graaf, A.A., Eggeling, L., Mollney, M., Wiechert,
W. & Sahm, H. (2001) In vivo quantification of parallel and
bidirectional fluxes in the anaplerosis of Corynebacterium gluta-
micum. J. Biol. Chem. 275, 35932–35941.
43. Stephanopoulos, G. & Vallino, J.J. (1991) Network rigidity and
metabolic engineering in metabolite overproduction. Science 252,
1675–1681.
44. Klapa, M.I., Aon, J.C. & Stephanopoulos, G. (2003) Using ion-
trap mass spectrometry in combination with gas chromatography
for high resolution metabolic flux determination. Biotechniques 34,
832–840.
45. Wiechert, W., Siefke, C., de Graaf, A.A. & Marx, A. (1997)
Bidirectional reaction steps in metabolic networks. II. Flux
estimation and statistical analysis. Biotechnol. Bioeng. 55, 118–
135.
46. Crowe, C.M. (1996) Data reconciliation. Progress and Challenges.
J. Process Control. 6, 89–98.
47. van der Heijden, R.T.J.M., Heijnen, J.J., Hellinga, C., Romein, B.
& Luyben, K.C.A.M. (1994) Linear constraint relations in bio-
chemical reaction systems. I. Classification of the calculability and
the balanceability of conversion rates. Biotechnol. Bioeng. 43,
3–10.
48. Ahuya, R.K., Magnanti, T.L. & Orlin, J.B. (1993) Network
Flows: Theory, Algorithms, and Applications. Prentice Hall, Eng-
lewood Cliffs, NJ.
49. Simpson, T.W. & Stephanopoulos, G. (1997) Flux amplification in
complex metabolic networks. Chem. Eng. Sci. 52, 2607–2627.
50. Lee, W.N., Bergner, E.A. & Guo, Z.K. (1992) Mass isotopomer
pattern and precursor-product relationship. Biol. Mass. Spectrom.
21, 114–122.
51. Bailey, J.E. & Ollis, D.F. (1986) Biochemical Engineering Funda-
mentals.McGraw-Hill,Inc.NewYork.
52. Varela, C., Agosin, E., Baez, M., Klapa, M. & Stephanopoulos,
G. (2003) Metabolic flux redistribution in Corynebacterium glu-
tamicum in response to osmotic stress. Appl. Microbiol. Biotechnol.
60, 547–555.
53. Strang, G. (1993) Introduction to Linear Algebra. Wellesley-
Cambridge Press, Cambridge, MA.
Ó FEBS 2003 Systematic flux analysis using stable isotopes and MS (Eur. J. Biochem. 270) 3539
54. Press, W.H., Flannery, B.P. & Teukolsky, Vetterling, W.T. (1989)
Numerical recipes in Pascal. Cambridge University Press,
Cambridge.
55. Romagnoli, J.A. & Sanchez, M.C. (1999) Data Processing and
Reconciliation for Chemical Process Operations (Process Systems
Engineering, Vol. 2. Academic Press, San Diego.
56. Romagnoli, J.A. & Stephanopoulos, G. (1980) On the rectification
of measurement errors for complex chemical plants ) Steady state
analysis. Chem. Eng. Sci. 35, 1067–1081.
57. Romagnoli, J.A. & Stephanopoulos, G. (1981) Rectification of
process measurement data in the presence of gross errors. Chem.
Eng. Sci. 36, 1849–1863.
58. Wang, N.S. & Stephanopoulos, G. (1983) Application of macro-
scopic balances to the identification of gross measurement errors.
Biotechnol. Bioeng. 25, 2177–2208.
59. Mah, R.S.H. (1990) Chemical process structures and information
flows. (Butterworths Series in Chemical Engineering). Butter-
worths, Boston, London, Singapore, Sydney, Toronto, Well-
ington.
60. Schmidt, K., Carlsen, M., Nielsen, J. & Villadsen, J. (1999)
Quantitative analysis of metabolic fluxes in Escherichia coli,using
two-dimensional NMR spectroscopy and complete isotopomer
models. J. Biotechnol. 71, 175–190.
61. DesRosiers,C.,Fernandez,C.A.,David,F.&Brunengraber,H.
(1994) Reversibility of the mitochondrial isocitrate dehydrogenase
reaction in the perfused rat liver. Evidence from isotopomer
analysis of citric acid cycle intermediates. J. Biol. Chem. 269,
27179–27182.
62. Rabkin, M. & Blum, J.J. (1985) Quantitative analysis of inter-
mediary metabolism in hepatocytes incubated in the presence and
absence of glucagon with a substrate mixture containing glucose,
ribose, fructose, alanine and acetate. Biochem. J. 225, 761–786.
63. Baranyai, J.M. & Blum, J.J. (1989) Quantitative analysis of
intermediary metabolism in rat hepatocytes incubated in the
presence and absence of ethanol with a substrate mixture including
ketoleucine. Biochem. J. 258, 121–140.
64. Stryer, L. (1995) Biochemistry, 4th edn. W.H. Freeman, New
York.
65. Follstad, B.D. & Stephanopoulos, G. (1998) Effect of reversible
reactions on isotope label redistribution. Analysis of the pentose
phosphate pathway. Eur. J. Biochem. 252, 360–371.
Supplementary material
This material describes the exact definition of the weighted
least-squares constrained minimization problem, which was
used in this work to quantify the intracellular net and ex-
change fluxesfrom extracellular metabolite netexcretion rate-
and mass isotopomer measurements and is available from:
/>suppmat/EJB/EJB3732/ejb3732sm.htm
Appendix
The considered lysine biosynthesis reaction network in
C. glutamicum, when glucose is used as substrate (for the
main metabolic pathways, see [64]; for lysine biosynthesis
and respiration pathways of C. glutamicum,see[31]).
PEP-Glc Phosphotransferase system
1. Glc + PEP fi G6P + PYR (irreversible)
Glycolysis
2. G6P « FRU6P (reversible)
3. FRU6P + ATP fi FRU1,6bisP (irreversible)
4. FRU1,6bisP « DHAP +GAP (reversible)
5. DHAP « GAP (reversible)
6. GAP + NAD
+
« 1,3-BPG + NADH (reversible)
7. 1,3-BPG + ADP « G3P +ATP (reversible)
8. G3P « 2-PG (reversible)
9. 2-PG « PEP +H
2
O (reversible)
10. PEP +ADP « ATP +PYR (reversible)
Pentose Phosphate Pathway (PPP)
Oxidative
11. G6P + 2NADP
+
+H
2
O fi
P5P + CO
2
+ 2NADPH (irreversible)
Non-Oxidative
12. 2 P5P « SED7P + GAP (reversible)
13. SED7P + GAP « E4P + FRU6P (reversible)
14. P5P + E4P « GAP + FRU6P (reversible)
Pyruvate Dehydrogenase Reaction
15. PYR+CoA+NAD
+
fi AcCoA + CO
2
+ NADH (irreversible)
Tricarboxylic Acid Cycle
16. AcCoA + OAA + H
2
O fi ISOCIT
+ CoA (irreversible)
17. ISOCIT +NADP
+
fi aKG + CO
2
+ NADPH (irreversible)
18. aKG+CoA+NAD
+
fi SUCCoA + CO
2
+ NADH (irreversible)
19. SUCCoA + ADP fi SUC + CoA
+ ATP (irreversible)
20. SUC+FAD+H
2
O « FUM
+FADH
2
(reversible)
21. FUM + H
2
O « MAL (reversible)
22. MAL + NAD
+
« OAA + NADH (reversible)
Anaplerotic Pathways
23. PEP + CO
2
fi OAA (irreversible)
24. OAA + ATP fi PEP + CO
2
+ ADP (irreversible)
25. PYR + CO
2
+ATPfi OAA + ADP (irreversible)
26. OAA fi PYR + CO
2
(irreversible)
Trehalose synthesis
27. 2 G6P + ATP fi TREHALOSE
+ ADP (irreversible)
Glutamate and Glutamine Synthesis
28. aKG + NH
3
+NADPH« Glu +
H
2
O+NADP
+
(reversible)
29. Glu + NH
3
+ATPfi Gln + ADP (irreversible)
3540 M. I. Klapa et al. (Eur. J. Biochem. 270) Ó FEBS 2003
Alanine, Valine and Lactate synthesis
30. PYR + NADH fi LAC + NAD
+
(irreversible)
31. PYR + Glu fi Ala + aKG (irreversible)
32. 2 PYR + NADPH + Glu fi Val + CO
2
+
H
2
O + NADP
+
+ aKG (irreversible)
Acetate Synthesis
33. AcCoA + ADP fi Ac + CoA + ATP (irreversible)
Aspartate Synthesis
34. OAA + Glu « Asp + aKG (reversible)
Lysine synthesis
35. Asp+ATP+NADPH« aspartic semialdehyde +
ADP + NADP
+
(reversible)
36. aspartic semialdehyde + PYR + NADPH fi
H4D + NADP + 2H
2
O (irreversible)
37. H4D + H
2
O fi 2-amino-6-ketopimelate
(irreversible)
Four-step pathway
38. 2-amino-6-ketopimelate + SUCCoA fi N-succinyl-
2-amino-6-ketopimelate + CoA (irreversible)
39. N-succinyl-2-amino-6-ketopimelate + Glu fi N-suc-
cinyl-2,6-diaminopimelate + aKG (irreversible)
40. N-succinyl-2,6-diaminopimelate + H
2
O fi LL-2,6-
diaminopimelate + SUC (irreversible)
41. LL-2,6-diaminopimelate fi meso-DAP
(irreversible)
One-step pathway
42. 2-amino-6-ketopimelate + NH
3
+NADPH fi
meso-DAP + NADP
+
+H
2
O (irreversible)
43. meso-DAP fi Lys
INTRA
+CO
2
(irreversible)
Lysine Transport
44. Lys
INTRA
fi Lys
EXTRA
(irreversible)
Biomass synthesis
45. 0.021 G6P + 0.007 FRU6P + 0.09 RIB5P + 0.036
E4P + 0.013 GAP + 0.15 G3P + 0.052 PEP +
0.03 PYR + 0.332 AcCoA + 0.08 Asp + 0.033
Lys
INTRA
+ 0.446 Glu + 0.025 Gln + 0.054 Ala +
0.04 Val + 3.82 ATP + 0.476 NADPH + 0.312
NAD
+
fi biomass + 3.82 ADP + 0.364 aKG +
0.476 NADP
+
+ 0.312 NADH + 0.143 CO
2
(irreversible)
Oxidative Phosphorylation: P/O = 2
46. 2 NADH + O
2
+4ADPfi 2H
2
O+4ATP
+2NAD
+
47. 2 FADH
2
+O
2
+2ADP fi 2H
2
O
+2ATP+2FAD
Notes
1. For the reversible reactions, the default direction is
considered from left to right in the depicted equations. If the
net flux of these reactions is estimated to be negative, then the
net direction of the reaction flux is the reverse of the default.
The net fluxes of the irreversible reactions are nonnegative.
2. The ATP balance was not included in flux quantifi-
cation.
3. Each direction of reaction (10) is catalyzed by a
different enzyme: the default direction by pyruvate kinase;
while the reverse direction by PEP synthase.
4. Ribulose 5-phosphate, ribose 5-phosphate and xylu-
lose 5-phosphate are considered at equilibrium in one pool,
named pentose 5-phosphate (P5P) [65]. This grouping is
imposed by observability limitations. The exchange fluxes of
the intermediate reactions can be differentiated only when
appropriate information about the isotopic distribution of
all three metabolites is available.
5. The irreversible citrate synthase and the (potentially)
reversible aconitase reactions [64] have been combined into
one irreversible reaction. Even if they were considered
independently, observability analysis indicates that they
have the same net flux and the exchange flux of aconitase
cannot be determined, since isotopic tracer measurements of
cis-aconitate (i.e. the reactant of the reaction) are not
available. The pools of cis-aconitate and isocitrate are
lumped then into one pool.
6. There have been indications that icocitrate dehydrog-
enase is reversible in vivo [61]. However in the present case,
as it is explained in the text (see Discussion), the extent of its
reversibility cannot be determined, since the isotopic tracer
distribution of isocitrate is not measured.
7. Reaction 19 is indeed reversible in vivo producing a
symmetric molecule (SUC) in the forward direction, while
there is an one-to-one correspondence between the carbon
atoms of SUC and SUCCoA in the reverse direction (no
symmetric molecule is produced). Reaction 20 is also
reversible producing a symmetric molecule (SUC) in the
reverse direction (from FUM), while FUM is not symmetric
and there is an one-to-one correspondence between the
carbon atoms of SUC and FUM in the default direction.
However, to simplify the estimation of the exchange flux
between SUC and OAA in the TCA cycle, since succinyl-
CoA synthetase reaction (no 19) is also coupled with the
irreversible reactions (38, 39, 40) in lysine biosynthesis
pathway, SUCCoA synthetase is considered irreversible
with one-to-one correspondence between the carbon atoms
of SUCCoA and SUC. Additionally, SUC dehydro-
genase (no 20) is considered reversible forming symmetric
molecules in both directions. The latter model is equivalent
to the in vivo situation with respect to carbon transfer
stoichiometry. Therefore, it does not distort the results of
flux analysis.
8. In flux quantification, reactions 23 and 24 are
considered as the two directions of one reversible reaction.
However, reaction 23 is catalyzed by enzyme PEP carboxy-
lase, while reaction 24 is catalyzed by enzyme PEP
carboxykinase.
Ó FEBS 2003 Systematic flux analysis using stable isotopes and MS (Eur. J. Biochem. 270) 3541
9. Reaction 25 is catalyzed by pyruvate carboxylase. In
flux quantification, reactions 25 and 26 are considered the
opposite directions of one reversible reaction. Reaction 26,
however, is catalyzed by a different enzyme, OAA decarb-
oxylase.
10. All pathways synthesizing extracellularly excreted
products from central carbon metabolism intermediates are
considered irreversible.
11. The two (potentially) reversible in vivo reactions:
aspartate kinase and aspartic, b-semialdehyde dehydro-
genase (see [31]) have been combined into one reversible
reaction. The exchange fluxes of the two reactions cannot be
distinguished, because the isotopic distribution of aspartyl
phosphate (the intermediate of the two reactions) is not
accessible.
12. The same biomass equation as in [31] was considered.
3542 M. I. Klapa et al. (Eur. J. Biochem. 270) Ó FEBS 2003