Báo cáo khoa học: On the mechanism of a-amylase Acarbose and cyclodextrin inhibition of barley amylase isozymes pdf
Bạn đang xem bản rút gọn của tài liệu. Xem và tải ngay bản đầy đủ của tài liệu tại đây (300.4 KB, 9 trang )
On the mechanism of a-amylase
Acarbose and cyclodextrin inhibition of barley amylase isozymes
Naı¨ma Oudjeriouat
1
, Yann Moreau
2
, Marius Santimone
1
, Birte Svensson
3
, Guy Marchis-Mouren
1
and Ve
´
ronique Desseaux
1
1
IMRN, Institut Me
´
diterrane
´
en de Recherche en Nutrition, Faculte
´
des Sciences et Techniques de St Je
´
rome, Universite
´
d’Aix-Marseille, France;
2
IRD, Institut de Recherche pour le De
´
veloppement, UR081 Gamet c/o CEMAGREF Montpellier,
France;
3
Carlsberg Laboratory, Department of Chemistry, Copenhagen Valby, Denmark
Two inhibitors, acarbose and cyclodextrins (CD), were
used to investigate the active site structure and function
of barley a-amylase isozymes, AMY1 and AMY2. The
hydrolysis of DP 4900-amylose, reduced (r) DP18-malto-
dextrin and maltoheptaose (catalysed by AMY1 and
AMY2) was followed in the absence and in the presence of
inhibitor. Without inhibitor, the highest activity was
obtained with amylose, k
cat
/K
m
decreased 10
3
-fold using
rDP18-maltodextrin and 10
5
to 10
6
-fold using maltohep-
taose as substrate. Acarbose is an uncompetitive inhibitor
with inhibition constant (L
1i
) for amylose and maltodextrin
in the micromolar range. Acarbose did not bind to the
active site of the enzyme, but to a secondary site to give an
abortive ESI complex. Only AMY2 has a second secon-
dary binding site corresponding to an ESI
2
complex. In
contrast, acarbose is a mixed noncompetitive inhibitor of
maltoheptaose hydrolysis. Consequently, in the presence of
this oligosaccharide substrate, acarbose bound both to the
active site and to a secondary binding site. a-CD inhibited
the AMY1 and AMY2 catalysed hydrolysis of amylose,
but was a very weak inhibitor compared to acarbose.
b-andc-CD are not inhibitors. These results are different
from those obtained previously with PPA. However in
AMY1, as already shown for amylases of animal and
bacterial origin, in addition to the active site, one secon-
dary carbohydrate binding site (s
1
) was necessary for
activity whereas two secondary sites (s
1
and s
2
)were
required for the AMY2 activity. The first secondary site in
both AMY1 and AMY2 was only functional when sub-
strate was bound in the active site. This appears to be a
general feature of the a-amylase family.
Keywords: amylose; maltodextrin; acarbose; barley a-amy-
lase; binding site.
a-Amylase is a retaining glycoside hydrolase of family 13
acting on a-1,4 internal glycoside linkages in starch and
related sugars [1]. a-Amylases occur widely in higher plants,
animals, bacteria and fungi and are applied in several
important industries, e.g. in starch processing, paper
treatment, pharmaceutical and the food manufacturing
[2–4]. Cereal a-amylases, such as barley isozymes AMY1
and AMY2, play an essential role during seed germination
(malting) by hydrolysing the storage starch granules present
in the endosperm. AMY1 and AMY2 have 80% sequence
identity [5,6]. AMY1 was more active toward starch
granules and more stable at low pH, while AMY2, the
major isozyme, was more active toward nitrophenylated
maltooligosaccharides and was inhibited by the proteina-
ceous barley a-amylase/subtilisin inhibitor (BASI) to which
AMY1 is insensitive [7,8].
Subsite mapping showed that the substrate binding cleft
of both isozymes contains 10 consecutive subsites recogni-
zing substrate glucose residue, i.e. six toward the nonreduc-
ing end and four toward the reducing end relative to the
bond to be cleaved [9]. The AMY1 and AMY2 active sites
are twice as long as that of the human and porcine enzymes
containing only five subsites [9–12]. In addition, a noncata-
lytic site that facilitated adsorption onto starch granules
(and most probably also hydrolysis of starch granules) has
been found in barley a-amylase [7,13,14]. Binding of
b-cyclodextrin at this site inhibits the a-amylase catalysed
hydrolysis of starch granules, but no inhibition was
observed with soluble substrate [15,16]. In AMY2, differ-
ential labelling of tryptophan residues using b-CD for
protection identified Trp276-Trp277 in this binding site [13].
Trp206 belongs to the active site where it is situated at
subsite +2 [14]. Known crystal structures of a-amylases
contain a central catalytic (b/a)
8
barrel domain (domain A)
having an irregularly structured small domain B protruding
between b-strand 3 and a-helix 3 of the barrel, and a
C-terminal, domain C, folded as an antiparallel b-sheet
[17–23]. Acarbose is a pseudotetrasaccharide inhibitor of
a-amylase, that acts like a transition-state analogue [7] and
Correspondence to V. Desseaux, IMRN case 342, Faculte
´
des Sciences
et Techniques, Avenue. Esc. Normandie-Niemen, 13397 Marseille
cedex 20, France. Fax: + 33 4 91 28 84 40,
E-mail:
Abbreviations:AMY,barleya-amylase; AMY1, barley a-amylase
isozyme 1; AMY2, barley a-amylase isozyme 2; PPA, porcine pan-
creatic a-amylase; CD, cyclodextrin; DP, degree of polymerization;
rDP18, reduced DP18-maltodextrin; G7, maltoheptaose.
Enzyme: a-amylase [a(1,4)-glucan-4-glucanohydrolase; EC 3.2.1.1].
Note: This paper is dedicated to the late Prof. E. Prodanov
(Montevideo, Uruguay).
(Received 17 March 2003, revised 23 May 2003,
accepted 30 June 2003)
Eur. J. Biochem. 270, 3871–3879 (2003) Ó FEBS 2003 doi:10.1046/j.1432-1033.2003.03733.x
binds to the active site [2,14,17]. The crystallography of
AMY2/acarbose showed that both the active site, contain-
ing Trp206, and the secondary so-called starch granule
binding site at the surface, containing Trp276-Trp277, bind
acarbose [14]. This surface binding site revealed a charac-
teristic stacking of a disaccharide unit from acarbose onto
the Trp residues [14]. The starch binding site was required
when acting on insoluble substrates such as starch granules.
Previously, acarbose was demonstrated to be a mixed
noncompetitive-type inhibitor of the hydrolysis of amylose,
rDP18-maltodextrin and maltopentaose catalysed by por-
cine pancreatic [24–28] and human [29] a-amylases.
Depending on the substrate, one or two secondary carbo-
hydrate binding site(s) were found which became functional
upon substrate binding. These sites may be involved in the
catalytic process and/or in product release [24]. The same
inhibition type using amylose as substrate was also reported
using amylases from a fish (Tilapia) [30] and a bacterium
(Lactobacillus) [31]. The a-amylase mechanism for hydro-
lysis of soluble substrates includes several steps (a) internal
binding to the amylose chain (b) splitting of the chain (c)
and according to the multiple attack hypothesis [32] further
hydrolysis near the reducing end of the nonreducing moiety
of the initially cleaved amylose to liberate successively 1, 2,
3, etc. molecules of maltose or longer oligosaccharide(s).
Secondary binding sites are probably required in such a
mechanism for binding and sliding of the substrate chain.
Barley AMY1 and AMY2 have a degree of multiple attack
toward amylose of two (B. Kramhøft and B. Svensson,
unpublished data).
The goal of the present work is to characterize further
the AMY1 and AMY2 function toward soluble sub-
strates. The kinetics of hydrolysis of substrates of different
length: i.e. DP 4900-amylose, rDP18-maltodextrin and
maltoheptaose, in the presence and in the absence of the
inhibitor acarbose, respectively, of the potential inhibitors
a-, b-andc-cyclodextrin are reported. Using a statistical
analysis of the data, the inhibitory mechanism is investi-
gated. Moreover the present results are compared with
those obtained recently in our laboratory using amylases
from different species (porcine [24–28], human [29],
Tilapia [30] and Lactobacillus [31]). The inhibitor and
the inhibition type characterize the active site of the
different enzymes and the secondary site(s) needed for
soluble substrate(s) which appear(s) to be a general feature
of a-amylases.
Materials and methods
Materials
Barley a-amylases, AMY1 and AMY2, were purified from
green and kilned malt, respectively, according to Svensson
et al. [33] and Ajandouz et al.[9].PurifiedAMY1and
AMY2 gave single bands in SDS/PAGE (not shown)
in amounts corresponding to approximately 5 and
100 mgÆL
)1
. The amylase concentrations were determined
by measuring A
280
(A
1%
280
¼ 24) [24]. Amylose (type III
from potato) DP 4900 (794 kDa) [34], maltoheptaose,
maltohexaose, maltopentaose, maltotetraose, maltotriose,
maltose, glucose and neocuproin hydrochloride were from
Sigma. Maltodextrin of average DP18 (2.9 kDa) was
from Hayashibara Biochemical Laboratories (Okayama,
Japan). Reduction of the DP18-maltodextrin to the
corresponding alcohol was performed as earlier described
[35] by using NaBH
4
. This was done to facilitate the
reducing sugar assay by minimizing the contribution from
the substrate to achieve low blank values. Acarbose
(O-4,6-dideoxy-4-{[4,5,6-trihydroxy-3-hydroxymethyl-2-cyclo-
hexen-1-yl]amino}-a-
D
-glucopyranosyl-(1 fi 4)-O-a-
D
-gluco-
pranosyl-(1 fi 4)-
D
-glucose) was generously supplied by
Bayer Pharma (France). a-, b-andc-cyclodextrins were
from Sigma.
Kinetics
Kinetic experiments were performed at 30 °Cin20m
M
sodium acetate buffer (pH 5.5) containing 1 m
M
CaCl
2
and 1 m
M
sodium azide. Substrate, inhibitor and buffer
were mixed and the reaction was initiated by adding the
enzyme.
When amylose or rDP18-maltodextrin was the substrate,
the incubation volume was 400 lL and the enzyme volume
100 lL. More than 10 concentrations of the substrates,
amylose (0.003–0.32 gÆL
)1
or 0.038–0.4 l
M
for AMY1;
0.048–0.8 gÆL
)1
or 0.06–1 l
M
for AMY2) and rDP18-
maltodextrin (0.06–1.46 gÆL
)1
or 20–500 l
M
for both
isozymes) were used. The final concentration of AMY1
and AMY2 was 2.0 n
M
and 1.0 n
M
, respectively. Acarbose
was used in the range 10–80 l
M
and a-, b-andc-CD were
in the ranges 2–20 m
M
, 3.2–24 m
M
, and 1.6–13.6 m
M
,
respectively. The reaction was stopped at appropriate time
intervals (1, 3 and 5 min) by adding 500 lL of chilled
0.38
M
sodium carbonate containing 1.8 m
M
cupric sulfate
and 0.2
M
glycine (500 lL)andkeptonice[36].Therate
of hydrolysis of amylose and rDP18-maltodextrin was
obtained from the increase in reducing power and using
maltose as standard.
When maltoheptaose was the substrate, the incubation
volume was 900 lL and the enzyme volume 100 lL giving a
final concentration of 100 n
M
. More than 10 concentrations
of maltoheptaose (0.15–5 m
M
) were used. Acarbose was in
the range 0.75–5 m
M
.Samples(100lL) were removed at
appropriate time intervals (0, 0.15, 0.30, 0.45 and 1.00 min),
addedto0.1
M
NaOH (300 lL) to stop the reaction, and
kept on ice until analysis. The rate of hydrolysis was
determined by measuring the produced maltooligosaccha-
rides by high-performance anion-exchange chromatogra-
phy (HPAEC) on a Carbopac PA-100 (4 mm · 250 mm)
column with elution by a 5–500 m
M
sodium acetate linear
gradient over 20 min in 100 m
M
NaOH, at a flow rate of
1.0 mLÆmin
)1
. Detection of oligosaccharide and glucose in
the eluate was performed by pulsed amperometric detection
(PAD) using the Dionex DX-500 chromatograph as
reported previously [25]. For quantification glucose, malt-
ose, maltotriose, maltotetraose, maltopentaose, maltohexa-
ose and maltoheptaose were used as standards. Values from
either reductometry or HPAEC-PAD gave initial velocities
as calculated from the slopes obtained by linear regression
of the linear part of the progress curves, which in turn gave
the number of glycoside bonds hydrolysed per minute or the
amount of product (glucose and maltohexaose) released per
minute, respectively. The experiments were repeated three
or four times.
3872 N. Oudjeriouat et al. (Eur. J. Biochem. 270) Ó FEBS 2003
Statistical analyses of kinetics experiments
Statistical analyses were performed using either the REG,
NLIN, or GLM procedure from the
SAS
/
STAT
software
package (Sas Institute Inc, Cary, NC, USA) [37]. A
significance level of 0.05 was used in all statistical tests.
The initial velocity was measured at fixed inhibitor and
varying substrate concentration. In order to determine the
type of inhibition, the kinetic data were analysed using a
general initial velocity equation. As discussed earlier
[9,27,28], Eqn (1) applies for the present type of data:
v=½E
0
¼
k
cat
½S
K
m
ð1 þ
1
K
li
½Iþ
1
K
li
K
2i
½I
2
Þþ½Sð1 þ
1
L
li
½Iþ
1
L
li
L
2i
½I
2
Þ
ð1Þ
In this equation v is the initial velocity, [E]
0
the enzyme
concentration, [S] the substrate concentration, [I] the
inhibitor concentration, K
m
the Michaelis constant and
K
1i
, K
2i
, L
1i
, L
2i
the dissociation constants of the different
abortive complexes, EI, EI
2
, ESI and ESI
2
, respectively, as
shown in the scheme below. It should be noticed that this
equation applies at steady state and at rapid equilibrium
except in the case of noncompetitive inhibition with a
random mechanism at steady state [24].
Equation (1) corresponds to the following reaction
scheme, where Q and P are the products:
A nonlinear statistical analysis was used. Equation (1) was
modified by using the association constants K¢
1i
, K¢
2i
, L¢
1i
and L¢
2i
which are the inverse of the corresponding
dissociation constants. In this equation, it was easier for a
calculated constant to compare its value relative to zero
rather than to obtain a large value. When the association
constant value was close to zero, this meant that the
corresponding abortive complex was not present in
significant amounts. Actually, one will use the simplest
equation which best matched the data and the actual
inhibition type.
Difference spectroscopy
Difference spectra were determined using a double-beam
Shimadzu UV-2401PC spectrophotometer. Double-com-
partment cells (each 0.44 cm light path, 230-QS, from
Hellma) were used for both control cell and sample cell. The
cells were thermostated at 30 °C. First, both cells were filled
with 20 m
M
sodium acetate buffer (pH 5.5) containing
1m
M
CaCl
2
and 1 m
M
sodium azide to define the baseline.
Second, AMY1 (40 l
M
) was introduced into one compart-
ment of the control and one compartment of the sample cell
and the reference line was determined (A
0
). Then acarbose
(1.7–6.5 m
M
) was added to the buffer compartment of the
control and to the compartment containing AMY1 in the
sample cell. The AMY1 concentration in the control cell
was adjusted accordingly by addition of buffer. Spectra
were recorded in the 230–320 nm region at a rate of
0.2 nmÆs
)1
.
Results
Determination of kinetic parameters with substrates
of different sizes
The AMY catalysed hydrolysis of DP 4900-amylose,
rDP18-maltodextrin and maltoheptaose was first measured
in the absence of inhibitor. Statistical analysis of the
experimental initial rates (v) was performed using the
general Michaelis–Menten initial velocity equation for
determination of k
cat
and K
m
and calculation of the catalytic
efficiency, k
cat
/K
m
. The kinetic parameters of AMY1 and
AMY2 (Table 1) were rather similar, but depended import-
antly on the substrate. With amylose and rDP18-maltodex-
trin as substrates, under saturating conditions, no difference
was observed between k
cat
of AMY1 and AMY2 for
amylose or for rDP18-maltodextrin (Table 1). In contrast,
however, for maltoheptaose, AMY2 had three times higher
k
cat
than AMY1. The K
m
values were increasing with
decreasing substrate length from around 0.2 l
M
for amy-
lose, to around 215 l
M
for maltoheptaose. AMY1 and
AMY2 (k
cat
/K
m
) were 700 to 1000-fold more active toward
amylose than rDP18-maltodextrin, which in turn was 170
to 690-fold superior as substrate than maltoheptaose
(Table 1). Thus the longer the substrate, the higher was
the activity.
Inhibition by acarbose
Inhibition of amylose hydrolysis occurred in the presence
of 10–80 l
M
acarbose and the association constants K¢
1i
,
K¢
2i
, L¢
1i
and L¢
2i
were determined according to the
general equation (see Materials and methods). For both
AMY1 and AMY2, the association constants K¢
1i
,K¢
2i
and L¢
2i
were close to zero and could not be determined
under these conditions while, L¢
1i
¼ (62 ± 4)10
3
M
)1
and
L¢
1i
¼ (28 ± 3)10
3
M
)1
, respectively. The dissociation
constants, calculated from the respective association
constants in the corresponding equation (K
1i
,K
2i
, L
1i
and L
2i
), were given in Table 2. When the association
constant values were close to zero, the significant values of
the dissociation constants K
1i
,K
2i
,andL
2i
could not be
obtained (NS). The closest match to the experimental data
corresponded to Eqn (2).
Table 1. The enzyme kinetic parameters of hydrolysis of different sub-
strates by barley a-amylase isozymes AMY1 and AMY2. Parameter
values are given as ± SEM.
Substrate Enzyme
k
cat
(s
)1
)
K
m
(l
M
)
k
cat
/K
m
(s
)1
Æ
M
)1
)
Amylose AMY1 206 ± 12 0.21 ± 0.03 1.0 · 10
9
AMY2 202 ± 10 0.16 ± 0.02 1.3 · 10
9
Maltodextrin AMY1 129 ± 5 79.3 ± 9.8 1.6 · 10
6
AMY2 125 ± 4 71.4 ± 7.0 1.8 · 10
6
Maltoheptaose AMY1 2.02 ± 0.10 213 ± 46 9.5 · 10
3
AMY2 5.62 ± 0.5 217 ± 43 26 · 10
3
Ó FEBS 2003 Acarbose inhibition of barley a-amylases (Eur. J. Biochem. 270) 3873
v=½E
0
¼
k
cat
½S
K
m
þ½Sð1 þ L
0
1i
½IÞ
ð2Þ
Eqn (2) represents the following reaction scheme of
uncompetitive inhibition, in which the dissociation constant
has been indicated:
This model included only one abortive complex ESI (I
bound at a secondary site s
1
) and no significant amount of
acarbose was bound to E as in an ES complex. The
reciprocal plot drawn for AMY1 according to Eqn (2)
illustrates this model: parallel straight lines intersect the
ordinate axis as expected, the intercept increasing with
increasing acarbose concentration (Fig. 1). A similar plot
was obtained for AMY2 (not shown).
Inhibition of the rDP18-maltodextrin hydrolysis occurred
also in the presence of 10–80 l
M
acarbose. For both AMY1
and AMY2 the association constants K¢
1i
and K¢
2i
were
close to zero and L¢
1i
¼ (67 ± 9) 10
3
M
)1
, L¢
1i
¼ (42 ±7)
10
3
M
)1
, respectively. For AMY1, L¢
2i
value was also close
to zero. In this case Eqn (2) applies. For AMY2,
L¢
2i
¼ (11 ± 5) 10
3
M
)1
and in this case, Eqn (3) accounted
for the data. With both enzymes, the inhibition was as
above ) the uncompetitive type. The resulting dissociation
constants are given in Table 2.
v=½E
0
¼
k
cat
½S
K
m
þ½Sð1 þ L
0
1i
½IþL
0
1i
L
0
2i
½I
2
Þ
ð3Þ
The corresponding reaction scheme is:
indicating no EI complex in significant amount but two
complexes, ESI (I bound at s
1
)andESI
2
(I bound at s
1
and
s
2
), to be present. The inhibition is still uncompetitive and
the plot drawn with AMY1 illustrates this model: parallel
straight lines intersected the ordinate (Fig. 2). A similar plot
was obtained for AMY2 (not shown). To summarize,
rDP18-maltodextrin hydrolysis by both AMY1 and AMY2
was uncompetitively inhibited by acarbose. For AMY1,
however, only the ESI inhibition complex was present, while
with AMY2 both ESI and ESI
2
were formed.
In contrast, when maltoheptaose is the substrate in the
presence of 0.75–5 m
M
acarbose, the experimental data
most closely matched Eqn (4):
v=½E
0
¼
k
cat
½S
K
m
ð1 þ K
0
1i
½IÞ þ ½Sð1 þ L
0
1i
½IÞ
ð4Þ
For AMY1, calculation gave the association constants
K¢
1i
¼ (5.2 ± 1.4) 10
3
M
)1
and L¢
1i
¼ (0.25 ± 0.09) 10
3
M
)1
, K¢
2i
and L¢
2i
were close to zero. Using AMY2,
K¢
1i
¼ (1.2 ± 0.3) 10
3
M
)1
and L¢
1i
¼ (1 ± 0.26) 10
3
M
)1
,
K¢
2i
and L¢
2i
were also close to zero. The dissociation
constant values of K
1i
and L
1i
are shown in Table 2. This
inhibition was of the mixed noncompetitive type for both
isozymes and followed the reaction scheme:
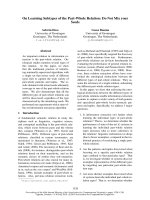
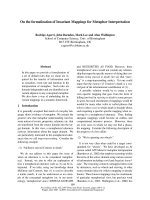
Fig. 1. Lineweaver–Burk plots. AMY1 with varying amylose and fixed
acarbose concentration [I] as indicated. This plot was calculated by
statistical analyses of initial rates of hydrolysis using Eqn (2). Gra-
phical analysis was not possible with our data. For this reason no
experimental points are reported. The plot is drawn from the corres-
ponding rate equation determined by statistical analysis.
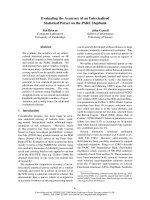
Fig. 2. Lineweaver–Burk plots. AMY1 with varying rDP18-malto-
dextrin concentration and fixed acarbose concentration [I] as indicated.
This plot was calculated by statistical analyses of initial rates using
Eqn (2). Graphical analysis was not possible with our data. For this
reason no experimental points are reported. The plot is drawn from the
corresponding rate equation determined by statistical analysis.
Table 2. The inhibition constants and type of inhibition by acarbose for
AMY1 and AMY2 acting on different substrates. K
1i
, K
2i
,L
1i
and L
2i
are the EI, EI
2
,ESIandESI
2
related dissociation constants. NS, not
significant values.
Substrate Enzyme
K
1i
(l
M
)
K
2i
(l
M
)
L
1i
(l
M
)
L
2i
(l
M
)
Inhibition
type
Amylose AMY1 NS NS 16 NS Uncompetitive
AMY2 NS NS 36 NS
Maltodextrin AMY1 NS NS 15 NS
AMY2 NS NS 24 95
Maltoheptaose AMY1 194 NS 4 10
3
NS Mixed
AMY2 833 NS 1 10
3
NS Noncompetitive
3874 N. Oudjeriouat et al. (Eur. J. Biochem. 270) Ó FEBS 2003
Two abortive complexes were present: EI (I bound at the
active site) and ESI (I bound at a secondary site s
1
).
The reciprocal plot using estimated values drawn for
AMY1 from Eqn (4) illustrated this model: straight lines
intersected in the 2nd quadrant (Fig. 3) at a point close to,
but distinct from the origin (see insert). A similar plot was
obtained with AMY2 (not shown). This apparent discrep-
ancy from the inhibition of the long chain substrate
hydrolysis was associated with the weak affinity of malto-
heptaose for the active site as well as an effect also of the
high acarbose concentrations used.
Inhibition by cyclodextrins
In the presence of a-, b-orc-cyclodextrin (2–20 m
M
,3.2–
24 m
M
and 1.6–13.6 m
M
, respectively) and using DP-4900
amylose, as substrate inhibition of AMY1 and AMY2 only
occurred with a-CD which was a very poor inhibitor
compared to acarbose. The inhibition constants (not given)
were in the 10–100 millimolar range. No other substrates
were investigated with the cyclodextrins. Inhibition of starch
granule hydrolysis by b-cyclodextrin has previously been
reported, however, in agreement with our result on amylose,
soluble starch hydrolysis was not inhibited [15].
Difference spectra of acarbose binding
The inhibition of the amylolytic activity of AMY1 by
acarbose involved, as shown above, specific interactions at
either the active site, as in EI, and/or at the secondary
binding site. The binding of acarbose to AMY1 was also
monitored by UV difference spectroscopy. A complete
AMY2 study, however, has not been performed. The
absorbance difference spectra of AMY1 produced by 1.7–
6.5 m
M
acarbose showed a major peak at 294–295 nm,
except for the ÔdÕ spectrum (Fig. 4A) which for unknown
reasons was slightly shifted toward a shorter wavelength.
These spectra indicated that binding of acarbose perturbed
at least one tryptophan residue [38,39]. The size of the peak
increased with increasing acarbose concentration and was
stable for up to 30 min. A shift at 294 nm occurred at longer
incubation times and analysis by HPAEC of acarbose-
AMY1 mixtures from the sample cell indicated that slow
hydrolysis of acarbose took place. This showed that
acarbose was bound at the active site. The UV difference
spectra therefore were recorded within less than 30 min after
mixing. The reciprocal of the normalized absorbance
difference [E]
0
/DA([E]
0
¼ AMY1 initial concentration;
DA ¼ A ) A
0
) measured at 294 nm was plotted against
1/[I]
0
([I]
0
¼ acarboseinitialconcentration) yieldingastraight
line (Fig. 4B) indicating that one molecule of acarbose (I)
binds to one molecule of AMY1 (E) to form the monitored
AMY1-acarbose complex (EI) according to the reaction:
as a consequence, the following equation applies:
½E
0
DA
¼
K
d
De
Â
1
½I
0
þ
1
De
ð5Þ
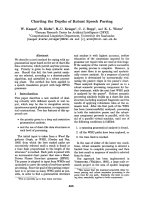
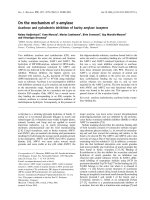
Fig. 4. UV difference spectroscopy of AMY1 with acarbose. (A) Scans
from 270 to 320 nm are shown. The acarbose concentration (in m
M
)
was 0.00 (a), 1.70 (b), 2.70 (c), 4.60 (d), 6.5 (e). The AMY1 concen-
tration [E]
0
was 38.8 l
M
decreasing to 37.3 l
M
by addition of acar-
bose. A
0
is the AMY1 absorbance without acarbose, A is the
absorbance measured at the above acarbose concentrations.
(B) Reciprocal plot of the difference spectra [E]
0
/(A ) A
0
)vs.1/[I]
0
(acarbose initial concentration) measured at 294 nm upon adding
acarbose to AMY1.
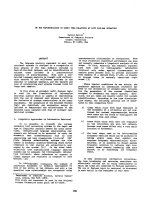
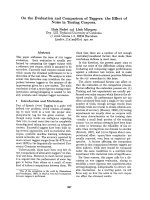
Fig. 3. Lineweaver-Burk plots. AMY1 with varying maltoheptaose
and fixed acarbose concentration [I] as indicated. This plot was cal-
culated by statistical analyses of initial rates using Eqn (4). The insert
enlarges the origin region. Graphical analysis was not possible with our
data. For this reason no experimental points are reported. The plot is
drawn from the corresponding rate equation determined by statistical
analysis.
Ó FEBS 2003 Acarbose inhibition of barley a-amylases (Eur. J. Biochem. 270) 3875
in which DA is the absorbance difference, De is the
difference between the molar absorption coefficients of
the inhibitor complex and the free enzyme, and K
d
is the
dissociation constant of the EI complex. Equation (5) is of
first order with respect to 1/[I]
0
and therefore fits a linear
plot. It should be noted that Eqn (5) applies only when the
concentration of the inhibitor, I, is much higher than that of
the enzyme, which was the case in the present experiment.
Moreover, if more than one molecule of inhibitor binds to
the enzyme and perturbed the spectrum, then the resulting
plot [E]
0
/DAvs.1/[I]
0
will not be linear [27]. Equation (5)
andFig.4Bwereusedtodeterminethedissociation
constant for EI to K
d
¼ 0.6 m
M
which confirmed a
previous determination of the binding constant to AMY1
[7]. However, in the light of the present data our interpret-
ation of the data was somewhat different. It appeared that
the EI complex was observed by difference spectroscopy
when the concentration [I] was very high when compared to
inhibitor concentrations used in the kinetics studies. The
binding of inhibitor at the active center was supported by
the fact that acarbose was slowly hydrolysed to release
glucose in a reaction that followed linear kinetics (not
shown). The question then arose, why the two sites, the
active site and the surface site found by kinetic analysis,
were not both revealed by the difference spectroscopy.
Discussion
As shown from the kinetic results obtained in the absence of
inhibitor, amylose was by far the best substrate of barley
amylase. Actually, rDP18-maltodextrin was hydrolysed at a
10
3
-fold lower rate and maltoheptaose at 10
5
)10
6
lower rate
than DP 4900-amylose. AMY2 was only slightly more
active than AMY1. This finding agreed with the generally
accepted feature that a-amylases are mostly active on long
chain substrate. The poor activity of AMY1 and AMY2,
relatively speaking, using maltoheptaose as a substrate is
due, on the one hand to the fact that maltoheptaose at most
occupied 7/10 subsites of the active site in productive
complexes and on the other hand because nonproductive
complexes would inhibit barley a-amylase catalysed malto-
heptaose hydrolysis [9].
When discussing the kinetic results obtained in the
presence of inhibitors, the main question to be asked is
why acarbose apparently did not occupy the active site of
AMY1 and AMY2 when the substrates used are amylose
and maltodextrin; while in all other situations, as shown by
difference spectra, X-ray crystallography and for PPA,
acarbose was bound at the active site. A second point is then
how to explain that EI was formed when maltoheptaose was
the substrate. How consistent were these corresponding
data and what was the contribution to the knowledge of the
barley isozymes and to the a-amylase family?
As will be discussed further, amylose and rDP18-
maltodextrin most probably have significantly higher
affinity for the active site of AMY (E) than found for
acarbose. When the substrates and the inhibitor compete
for the active site, the high affinity of the substrates
facilitates their binding whereas the inhibitor binding does
not occur. Therefore, no significant amount of EI complex
was formed and the acarbose inhibition was uncompeti-
tive. The ES complex reacted to give either products or
the abortive ESI complex (I bound at s
1
). When AMY1
was used with the substrates amylose or rDP18-malto-
dextrin, only one acarbose molecule was bound to ES as
well as to ESI. In the case of rDP18-maltodextrin/AMY2,
however, an additional acarbose molecule was bound to
give ESI
2
suggesting that one more sugar binding site (s
2
)
was present on the enzyme surface (Fig. 5A). Such a site
was found in PPA [24]. We suggest that this second
surface site reflected a certain structural difference between
AMY1 and AMY2. To summarize, we propose on the
basis of the above kinetic results, that one secondary
binding site (s
1
)inAMY1andtwo(s
1
and s
2
)inAMY2
were necessary for enzyme activity. It (they) became
functional only when S was bound at the active site and
were thus quite different from the starch granule binding
site earlier characterized in cereal amylases. In the
uncompetitive model, no inhibitor was present at the
active site. This, however, did not contradict the X-ray
data [14] and the present difference spectra. The kinetic
results showed that acarbose was a poor inhibitor of
AMY1 having a poor affinity for the active site. Conse-
quently at the inhibitor concentrations [I] used, no EI
complex was formed. At higher concentrations of acar-
bose, as used for the difference spectroscopy, the EI
complex could form and in accordance with the modest
affinity, the dissociation constant was very high (0.6 m
M
)
(Fig. 5B). Also, the acarbose concentration (10 m
M
), used
for soaking crystals of AMY2 to get the acarbose/AMY2
complex, was very high [14].
In contrast to the uncompetitive inhibition with amylose
and maltodextrin, the inhibition with maltoheptaose was of
the mixed noncompetitive type. Thus, both the EI and ESI
complexes were formed (Fig. 5A). The noncompetitive
acarbose inhibition may result, firstly because maltohepta-
ose was a poor substrate for which AMY1 and AMY2
showed, respectively, 10
5
and 10
2
-fold lower catalytic
efficiency than for amylose and maltodextrin. With com-
petitive binding to enzyme of the substrate and of the
inhibitor, the weak affinity of maltoheptaose to enzyme (E)
facilitated the binding of acarbose (I) to allow the formation
of the abortive EI complex, the ES and ESI (I in s
1
)
complexes being also formed (Eqn 4 and Fig. 5). It can be
concluded that the low affinity of both acarbose and
maltoheptaose for the active site was associated with
noncompetitive inhibition, while uncompetitive inhibition
as a consequence of amylose and maltodextrin binding with
high affinity for AMY.
a-CD was a weak inhibitor of AMY catalysed amylose
hydrolysis. b-andc-CD, however, were not inhibitory. In
contrast a-, b-andc-CD were all inhibitors of PPA, and
active at a slightly lower concentration in 0.25–5 m
M
range.
Such difference most likely reflected the different structures
at the active site of PPA [12] and AMY [9].
Two questions arose from the results of difference
spectroscopy of acarbose binding: (a) in the observed EI
complex, which binding site was then occupied? Our results
support that in EI, acarbose occupied the active site as at
prolonged incubation acarbose hydrolysis took place. This
experiment was of major interest as it allowed determination
of the K
d
(the dissociation constant) of EI which could not
be obtained by the kinetics approach when amylose or rDP-
18 maltodextrin were used as substrates. The K
d
was
3876 N. Oudjeriouat et al. (Eur. J. Biochem. 270) Ó FEBS 2003
actually in the same range as the K
1i
obtained with
maltoheptaose as substrate (0.2 m
M
); (b) why do we not
observe the secondary binding site demonstrated kinetic-
ally? Two answers may be proposed: either this site was not
functional (accessible) in the absence of substrate, as
postulated in the conclusion, or acarbose did not bind to
a Trp but to a different residue which could not be
monitored by UV difference spectroscopy.
As mentioned above, similar studies have been conduc-
ted on PPA. The results were strikingly different from
those obtained with barley AMY. Acarbose was a
noncompetitive inhibitor for PPA and an uncompetitive
for AMY when long chain substrates were used. In that
case, the inhibitory complex ESI was formed with both
enzymes, however, the EI complex was observed only with
PPA. This discrepancy was explained by the higher affinity
of acarbose for PPA as indicated by the lower dissociation
constant of the acarbose-PPA complex (1.7 l
M
)[24].The
dissociation constant of the acarbose-AMY complex
cannot be determined kinetically but was obtained from
the difference spectroscopy analysis (K
d
¼ 0.6 m
M
). Such a
large difference probably reflects differences of the struc-
ture and the energetics profiles of the respective active sites.
The comparison of AMY and PPA active site showed
large differences in the binding affinities of corresponding
subsites [9,10,12]. The PPA active site, moreover, had five
subsites and acarbose can occupy four of these, while the
AMY active site had 10 subsites and this crevice was thus
far from completely occupied by acarbose, and acarbose
apparently binds with lower affinity. Acarbose was thus
demonstrated to be a useful tool in describing active sites in
different a-amylases.
Fig. 5. Schematic mechanism for the AMY action of acarbose inhibition and binding. (A) Kinetics: S ¼ amylose, rDP18-maltodextrin or malto-
heptaose with I ¼ acarbose; S ¼ amylose with I ¼ a-CD. K
1i
, L
1i
,L
2i
are dissociation constants. (B) Difference spectra. Kd is the dissociation
constant.
Ó FEBS 2003 Acarbose inhibition of barley a-amylases (Eur. J. Biochem. 270) 3877
Conclusion
Barley isozymes AMY1 and AMY2 were thousand-fold
more active toward amylose than toward maltodextrin and
a million-fold more active than toward maltoheptaose.
AMY2 was slightly more active than AMY1. AMY1 and
AMY2 were inhibited by acarbose. a-CD was a weak
inhibitor and b-andc-CD were not inhibitory. This is in
contrast to the high inhibitory toward porcine [24–28] and
human [29] a-amylases. Also the inhibitory mechanism by
acarbose of the amylose and maltodextrin hydrolysis was of
a different type in the barley, compared to the human and
porcine enzymes. This different behaviour most probably
reflects the individual active site structures. Moreover, in
addition to the active site, the presence of one (s
1
)ortwo(s
1
and s
2
) secondary carbohydrate binding sites already found
in amylases from other species were demonstrated. Alto-
gether three to four carbohydrate binding sites were
postulated: (a) the starch granule binding site [40] [14]; (b)
the active site; (c) and one and sometimes two secondary
site (s) as deduced from the inhibition kinetics ([24] and the
present work). The precise functions of each site are
unknown but remarkably, the inhibition kinetics demon-
strated that they became functional only when E was bound
to S in the ES complex. Conformational changes very likely
occurred that couple the function of these sites with that of
the active site. The secondary site(s) might be involved in
substrate hydrolysis and/or product release. This function
was then clearly distinct from the barley a-amylase binding
onto starch granules, which most probably occurred prior
to hydrolysis of the substrate glycosidic bond.
Acknowledgements
We thank Drs E. H. Ajandouz and R. Koukiekolo for stimulating
discussion, C. Villard for advice and excellent technical assistance,
B. Dwisusilo for his help in the preparation of the illustration, and
S. Ehlers for enzyme purification.
References
1. Davies, G.J. & Henrissat, B. (1995) Structure and mechanism of
glycosyl hydrolases. Structure 3, 853–859.
2. Thoma, J., Rao, G., Brothers, C. & Spradlin, J. (1971) Subsite
mapping of enzymes. Correlation of products patterns with
Michaelis parameters and substrate induced strain. J. Biol. Chem.
246, 6521–5635.
3. Fogarty, W.M. (1983) Microbial, Enzymes and Biotechnology
(Fogarty, W.M., ed), 1–19. Applied Science Publishers, London.
4. Gottschalk, T.E., Fierobe, H.P., Mirgorodskaya, E., Clarke, A.J.,
Tull, D., Sigurskjold, B.W., Christensen, T., Payre, N., Frandsen,
T.P.,Juge,N.,McGuire,K.A.,Cottaz,S.,Roepstorff,P.,Driguez,
H., Williamson, G. & Svensson, B. (1998) Structure, function and
protein engineering of starch-degrading enzymes. Biochem. Soc.
Trans. 26, 198–204.
5. Rogers, J.C. & Milliman, C. (1983) Isolation and sequence
analysis of a barley a-amylase cDNA clone. J. Biol. Chem. 258,
8169–8174.
6. Rogers, J.C. (1985) Two barley a-amylase gene families are
regulated differently in aleurone cells. J. Biol. Chem. 260, 3731–
3738.
7. Søgaard, M., Kadziola, A., Haser, R. & Svensson, B. (1993) Site-
directed mutagesis of histidine 93, aspartic acid 180, glutamic acid
205, histidine 290 and aspartic acid 291 at the active site and
tryptophan 279 at the raw starch binding site in barley a-amylase
1. J. Biol. Chem. 268, 22480–22484.
8. Rodenburg, K.W., Juge, N., Guo, X., Søgaard, M., Chaix, J.C. &
Svensson, B. (1994) Domain B protruding at the third b strand of
the a/b barrel in barley a-amylase confers distinct isozyme-specific
properties. Eur. J. Biochem. 221, 277–284.
9. Ajandouz, E.H., Abe, J., Svensson, B. & Marchis-Mouren, G.
(1992) Barley malt a-amylase. Purification, action pattern and
subsite mapping of isozyme 1 and two members of isoenzyme 2
sub-family using p-nitrophenylated maltooligosaccharide sub-
strates. Biochim. Biophys. Acta 1159, 193–202.
10. Gye
´
mant,G.,Hovanszki,G.&Kandra,L.(2002)Subsitemap-
ping of the binding region of a-amylase with computer program.
Eur. J. Biochem. 269, 5157–5162.
11. Nahoum, V., Roux, G., Anton, V., Rouge
´
, P., Puigserver, A.,
Bischoff, H., Henrissat, B. & Payan, F. (2000) Crystal structures of
human pancreatic a-amylase in complex with carbohydrate and
proteinaceous inhibitors. Biochem. J. 346, 201–208.
12. Ajandouz. El, H. & Marchis-Mouren, G. (1995) Subsite mapping
of porcine pancreatic a-amylase I and II using 4-nitrophenyl-
a-maltooligosaccharides. Carbohydr. Res. 268, 267–277.
13. Gibson, R.M. & Svensson, B. (1987) Identification of tryptopha-
nyl residues involved in binding of carbohydrate ligands to barley
a-amylase 2. Carlsberg Res. Commun. 52, 373–379.
14. Kadziola, A., Søgaard, M., Svensson, B. & Haser, R. (1998)
Molecular structure of a barley a-amylase inhibitor complex:
implications for starch binding and catalysis. J. Mol. Biol. 278,
205–217.
15. Weselake, R.J. & Hill, R.D. (1982) Cycloheptaamylose as an
affinity ligand of cereal a-amylases. Characteristics and possible
mechanism of interaction. Carbohydr. Res. 108, 153–161.
16. Weselake, R.J., MacGregor, A.W. & Hill, R.D. (1983) Purifica-
tion and characteristics of an endogenous a-amylase inhibitor
from barley kernels. Plant. Physiol. 73, 1008–1012.
17. Brzozowski, A.M. & Davies, G.J. (1997) Structure of the Asper-
gillus oryzae a-amylase complexed with the inhibitor acarbose at
2.0 A
˚
resolution. Biochemistry 36, 10837–10845.
18. Fujimoto,Z.,Takase,K.,Doui,N.,Momma,M.,Matsumoto,T.
& Mizuno, H. (1998) Crystal structure of a catalytic-site mutant
a-amylase from Bacillus subtilis complexed with maltopentaose.
J. Mol. Biol. 277, 393–407.
19. Qian, M., Haser, R. & Payan, F. (1993) Structure and molecular
model refinement of pig pancreatic a-amylase at 2.1 A
˚
resolution.
J. Mol. Biol. 213, 785–799.
20. Brayer,G.D.,Sidhu,G.,Maurus,R.,Rydberg,E.H.,Braun,C.,
Wang, Y., Nguyen, N.T., Overall, C.M. & Withers, S.G. (2000)
Subsite mapping of the human pancreatic a-amylase active site
through structural, kinetic, and mutagenesis techniques. Bio-
chemistry 39, 4778–4791.
21. Boel,E.,Brady,L.,Brzozowski,M.,Derewenda,Z.,Dodson,
G.G., Jensen, V.J., Peteren, S.B., Swift, H., Thim, L. & Woldike,
H.F. (1990) Calcium binding in a-amylase: an X-ray diffraction
study at 2.1 A
˚
resolution of two enzymes from Aspergillus. Bio-
chemistry 29, 6244–6249.
22. Brzozowski, A.M., Lawson, D.M., Turkenburg, J.P., Bisga
˚
rd-
Frantzen, H., Svendsen, A., Borchert, T.V., Dauter, Z., Wilson,
K.S. & Davies, G.J. (2000) Structural analysis of a chimeric bac-
terial a-amylase. High-resolution analysis of native and ligand
complexes. Biochemistry 39, 9099–9107.
23. Kadziola, A., Abe, J., Svensson, B. & Haser, R. (1994) Crystal
and molecular structure of barley a-amylase. J. Mol. Biol. 239,
104–121.
24. Al Kazaz, M., Desseaux, V., Marchis-Mouren, G., Payan, F.,
Forest, E. & Santimone, M. (1996) The mechanism of porcine
3878 N. Oudjeriouat et al. (Eur. J. Biochem. 270) Ó FEBS 2003
pancreatic a-amylase. Kinetic evidence for two additional carbo-
hydrate-binding sites. Eur. J. Biochem. 241, 787–796.
25. Al Kazaz, M., Desseaux, V., Marchis-Mouren, G., Prodanov, E.
& Santimone, M. (1998) The mechanism of porcine pancreatic
a-amylase. Inhibition of maltopentaose hydrolysis by acarbose,
maltose and maltotriose. Eur. J. Biochem. 252, 100–107.
26. Koukiekolo, R., Le Berre-Anton, V., Desseaux, V., Moreau, Y.,
Rouge, P., Marchis-Mouren, G. & Santimone, M. (1999)
Mechanism of porcine pancreatic a-amylase. Inhibition of amy-
lose and maltopentaose hydrolysis by kidney bean (Phaseolus
vulgaris) inhibitor and comparison with that by acarbose. Eur.
J. Biochem. 265, 20–26.
27. Koukiekolo, R., Desseaux, V., Moreau, Y., Marchis-Mouren, G.
& Santimone, M. (2001) Mechanism of porcine pancreatic
a-amylase. Inhibition of amylose and maltopentaose hydrolysis
by a-, b-andc-cyclodextrin.Eur. J. Biochem. 268, 841–848.
28. Desseaux, V., Koukiekolo, R., Moreau, Y., Santimone, M. &
Marchis-Mouren, G. (2002) Mechanism of porcine pancreatic
a-amylase (PPA). Inhibition of amylose and maltopen-
taose hydrolysis by various inhibitors. Biologia, Bratislava 57,
163–170.
29. Ferey-Roux, G., Perrier, J., Forest, E., Marchis-Mouren, G.,
Puigserver, A. & Santimone, M. (1998) The human pancreatic
a-amylase isoforms: isolation, structural studies and kinetics of
inhibition by acarbose. Biochem. Biophys. Acta 1388, 10–20.
30. Moreau, Y., Desseaux, V., Koukiekolo, R., Marchis-Mouren,
G. & Santimone, M. (2001) Starch digestion in tropical
fishes. isolation, structural studies and inhibition kinetics of
a-amylases from two tilapias Oreochromis niloticus and Sarother-
odon melanotheron. Comparative Biochem. Physiol. Part B 128,
543–552.
31.Talamond,P.,Desseaux,V.,Moreau,Y.,Santimone,M.&
Marchis-Mouren, G. (2002) Isolation, characterization and
inhibition by acarbose of the a-amylase from Lactobacillus
fermentum: comparison with Lb. manihotivorans and Lb. plan-
tarum amylases. Comparative Biochem. Physiol. Part B 133,
351–360.
32. Robyt, J.F. & French, D. (1970a) Multiple attack and polarity of
action of porcine pancreatic a-amylase. Arch. Biochem. Biophys.
138, 662–670.
33. Svensson, B., Mundy, F., Gibson, R.M. & Svendsen, I. (1985)
Partial amino acid sequences of a-amylase isozymes from barley
malt. Carlsberg Res. Commun. 50, 15–22.
34. Chen, Y., Fringant, C. & Rinaudo, M. (1997) Molecular char-
acterization of starch by SEC: dependence of the performances on
the amylopectin content. Carbohydr. Polymers 33, 73–78.
35. Schou, C., Rasmussen, G., Kaltoft, M.B., Henrissat, B. & Schu
¨
-
lein, M. (1993) Stereochemistry, specificity and kinetics of the
hydrolysis of reduced cellodextrins by nine cellulases. Eur. J.
Biochem. 217, 947–953.
36. Dygert, S., Li, L.H., Don Florida, R. & Thoma, J.A. (1965)
Determination of reducing sugar with improved precision. Anal.
Chem. 13, 367–374.
37. Sas, Institute Inc. (1989) SAS/STATÒ. User’s Guides, Version 6
4th edn, Vol. 1, 943. Sas Institute Inc, Cary, NC, USA.
38. Ohnishi, M. (1971) Studies of interaction of the substrate ana-
logues with bacterial liquefying a-amylase by means of spectro-
photometry and steady state kinetics. J. Biochem. 69, 181–189.
39. Svensson, B. & Sierks, M.R. (1992) Roles of aromatic side chains
in binding of substrates, inhibitors and cyclodextrins to gluco-
amylase from Aspergillus niger probed by perturbation difference
spectroscopy, chemical modification and mutagenesis. Carbohydr.
Res. 228, 29–44.
40. MacGregor, E.A. & MacGregor, A.W. (1985) The action of cereal
a-amylase on solubilized starch and cereal starch granules. In New
Approaches to Research on Cereal Carbohydrates. (Hill, R.D. &
Munch, L., eds), pp. 149–160, Elsevier, Amsterdam, the Nether-
lands.
Ó FEBS 2003 Acarbose inhibition of barley a-amylases (Eur. J. Biochem. 270) 3879