Báo cáo khoa học: Identification of microsomal rat liver carboxylesterases and their activity with retinyl palmitate potx
Bạn đang xem bản rút gọn của tài liệu. Xem và tải ngay bản đầy đủ của tài liệu tại đây (688.8 KB, 12 trang )
Identification of microsomal rat liver carboxylesterases
and their activity with retinyl palmitate
Sonal P. Sanghani, Wilhelmina I. Davis, Natividad G. Dumaual, Alan Mahrenholz and William F. Bosron
Department of Biochemistry and Molecular Biology and of Medicine, Indiana University School of Medicine, Indianapolis, USA
Retinyl esters are a major endogenous storage source of
vitamin A in vertebrates and their hydrolysis to retinol is a
key step in the regulation of the supply of retinoids to all
tissues. Some members of nonspecific carboxylesterase
family (EC 3.1.1.1) have been shown to hydrolyze retinyl
esters. However, the number of different isoenzymes that are
expressed in the liver and their retinyl palmitate hydrolase
activity is not known. Six different carboxylesterases were
identified and purified from rat liver microsomal extracts.
Each isoenzyme was identified by mass spectrometry of its
tryptic peptides. In addition to previously characterized rat
liver carboxylesterases ES10, ES4, ES3, the protein products
for two cloned genes, AB010635 and D50580 (GenBank
accession numbers), were also identified. The sixth isoen-
zyme was a novel carboxylesterase and its complete cDNA
was cloned and sequenced (AY034877). Three isoenzymes,
ES10, ES4 and ES3, account for more than 95% of rat liver
microsomal carboxylesterase activity. They obey Michaelis–
Menten kinetics for hydrolysis of retinyl palmitate with K
m
values of about 1 l
M
and specific activities between 3 and 8
nmolÆmin
)1
Æmg
)1
protein. D50580 and AY034877 also
hydrolyzed retinyl palmitate. Gene-specific oligonucleotide
probing of multiple-tissue Northern blot indicates differen-
tial expression in various tissues. Multiple genes are highly
expressed in liver and small intestine, important tissues for
retinoid metabolism. The level of expression of any one of
the six different carboxylesterase isoenzymes will regulate the
metabolism of retinyl palmitate in specific rat cells and tis-
sues.
Keywords: retinyl palmitate hydrolase, carboxylesterase,
mass spectrometry, rat, retinol, vitamin A.
Vitamin A metabolism [1,2] is a significant area of research
because of its diverse role in the regulation of gene
expression through retinoic acid receptors. Dietary intake
of vitamin A from animal food products is mainly in the
form of retinyl esters and retinol, and from plant food
products such as provitamin A or b-carotenes. Retinyl
esters are converted to retinol in the intestine. After dietary
uptake, retinol is converted to retinyl esters in intestinal
mucosa and packaged into chylomicrons. These are
partially processed during circulation to chylomicron
remnants, which contain retinyl esters. Chylomicron rem-
nants are rapidly cleared from circulation by liver hepato-
cytes where the retinyl esters are hydrolyzed by retinyl ester
hydrolases to retinol. The retinol product can either
undergo oxidation to retinoic acid for signaling or be
secreted into circulation as a complex with retinol binding
protein. After meeting the tissue needs, excess retinol is
stored in hepatic stellate cells by conversion to retinyl esters
(mostly as retinyl palmitate). The stored retinyl esters are
the primary vitamin A reservoir in the body and can be
mobilized by hydrolysis to retinol by retinyl ester hydro-
lases. Hence, retinyl ester hydrolases play very important
roles in a variety of cells and tissues to regulate the storage
and mobilization of vitamin A [3].
Rats are the most common laboratory model for
investigating vitamin A metabolism [3,4]. The rodent
hepatic retinyl ester hydrolases are broadly classified into
two groups: bile salt-dependent and bile salt-independent.
Carboxyl ester lipase is considered as the major bile salt-
dependent retinyl ester hydrolase. Recent carboxyl ester
lipase knockout studies [5,6] show that both retinoid
metabolism and distribution are normal in knockout
mice. This suggests that carboxyl ester lipase does not
play a significant role in retinoid metabolism and that
there may be many different retinyl ester hydrolases
in vivo. Another lipase that could play a role in retinoid
metabolism is lipoprotein lipase [7]. Two types of bile salt-
independent retinyl ester hydrolases have been described
in liver microsomes based on their pH optimum as neutral
or acid. Both types potentially hydrolyze retinyl palmitate
[8]. To date, the specific enzymes and genes responsible
Correspondence to W. F. Bosron, Department of Biochemistry and
Molecular Biology, Indiana University School of Medicine,
MS 207, 635, Barnhill Drive, Indianapolis, IN 46202, USA.
Fax: + 317 2744686, Tel.: + 317 2743441,
E-mail:
Abbreviations: CES, carboxylesterase subfamily; SPE, solid phase
extraction; LC/ESI-MS, liquid chromatography electrospray
ionization mass spectrometry; UPGMA, unweighted pair group
method with arithmetic mean.
Enzymes and proteins: SWISS-PROT number for ES10 carboxyl-
esterase is P16303, that for ES4 carboxylesterase is Q64573 and the
number for ES3 carboxylesterase is Q63108. The proteins described
in this study as D50580 and AB010635 are the respective products of
the genes with GenBank accession numbers D50580 and AB010635.
A new carboxylesterase gene was cloned during this study. This
cDNA sequence has been submitted to the GenBank and the GI
number is AY034877. The protein product of this gene is also called
AY034877 in this study.
Note: a website is available at />(Received 20 February 2002, revised 24 May 2002,
accepted 24 May 2002)
Eur. J. Biochem. 269, 4387–4398 (2002) Ó FEBS 2002 doi:10.1046/j.1432-1033.2002.03121.x
for bile salt-independent acid retinyl ester hydrolase
activity have not been characterized [4]. Mentlein and
Heymann [9] investigated the retinyl ester hydrolase
activity of purified nonspecific carboxylesterases from rat
liver microsomes and concluded that only ES4 (also
known as hydrolase B [10] or pI 6.2/6.4 esterase [11]) had
significant activity with retinyl esters. In the same study,
ES10 was reported to have very little activity and ES3 or
pI 5.6 esterase [12] had no retinyl palmitate hydrolase
activity. Sun et al. [13] purified two neutral bile salt-
independent retinyl palmitate hydrolases from rat liver
microsomes and identified them as ES2 (serum carboxyl-
esterase) and ES10, also known as hydrolase A [14] or
pI 6.0 esterase [15]. In a recent review [3], Harrison
concluded that there are only three carboxylesterases
(ES4, ES10 and ES2) that function as retinyl ester
hydrolases in liver. Satoh and Hosokawa [16] proposed
a classification scheme for carboxylesterases, CES1 and
CES2. ES4, ES10 and ES2 belong to class CES1.
In this study, we developed a new procedure for
identification of six carboxylesterases utilizing preparative
nondenaturing PAGE followed by liquid chromatography
electrospray ionization mass spectrometry (LC/ESI-MS).
Five of the six protein bands with carboxylesterase activity
were identified as protein products of three reported CES1
genes, ES10, ES4, ES3 and two CES2 genes D50580 and
AB010635. Amino acid sequencing (Edman method) of
the sixth band identified a unique peptide. A new CES2
gene was cloned from a rat liver cDNA library and
sequenced (AY034877). The catalytic efficiency of purified
carboxylesterases ES10, ES4, ES3, D50580 and AY034877
in hydrolysis of retinyl palmitate was evaluated by a
quantitative HPLC assay for retinol production. In
contrast to an earlier report [9], we found that all the five
carboxylesterases efficiently hydrolyze retinyl palmitate
with specific activities of 0.8–8 nmolÆmin
)1
Æmg
)1
protein.
Oligonucleotide probing of multiple-tissue Northern blot
showed that all six genes are expressed in liver, but are
differentially expressed in small intestine, kidney and skin,
known sites that are important for retinoid metabolism
[17]. We conclude that differential tissue expression of
these retinyl ester hydrolases will be most important for the
regulation of vitamin A storage and mobilization in the
whole animal.
EXPERIMENTAL PROCEDURES
Carboxylesterase assays
Nonspecific carboxylesterase activity was monitored using
4-methylumbelliferyl acetate as substrate as described by
Brzezinski et al. [18]. Briefly, enzyme was incubated with
0.5 m
M
4-methylumbelliferyl acetate in 90 m
M
KH
2
PO
4
,
40 m
M
KCl, pH 7.3, 37 °C and the product, 4-methyl-
umbelliferone, was detected spectrophotometrically at
350 nm. One unit of activity is defined as the amount
of enzyme catalyzing the formation of 1 lmol of product,
4-methylumbelliferone, in 1 min. Protein was measured
with the Bio-Rad protein assay reagent based on
Bradford dye-binding method with BSA as standard [19].
The reaction catalyzed by carboxylesterase to generate
retinol from retinyl palmitate was followed by HPLC. All
studies involving use of retinoids were carried out under
yellow light to prevent photochemical degradation of
retinoids.
Commercially available retinyl palmitate has many
impurities that interfere with the retinyl palmitate hydrolase
assay. The presence of retinol in the commercial substrate
could produce product inhibition and compromises the
sensitivity of the HPLC assay. The photosensitivity of
retinoids makes a lengthy purification procedure ineffective.
Hence, a short and efficient procedure for purification of
retinyl palmitate was developed using solid phase extraction
(SPE) Bond Elute C-8 columns (Varian Inc., Palo Alto, CA,
USA). Briefly, the extraction cartridges were equilibrated
with 3 mL of methanol followed by 3 mL of acetonitrile/
water (60 : 40, v/v). Eleven micromoles of retinyl palmitate
in acetonitrile were loaded on the SPE C-8 cartridge and
sequentially washed with 6 mL of acetonitrile/water
(60 : 40, v/v), 3 mL of ethanol/water (60 : 40, v/v) and
10 mL of methanol/water (90 : 10, v/v). Retinyl palmitate
was eluted with 2 mL of methanol. Purity of the sample was
checked by HPLC (Agilent 1100 system) using a 5-lm, C-8
Luna column (4.5 · 150 mm, Phenomenex) with isocratic
elution with methanol/water (90 : 10, v/v). Retinol elution
was monitored at 350 nm. The purified retinyl palmitate
stock was stored at )20 °C.
Retinyl palmitate hydrolase reactions were performed at
37 °C in 1 mL of 0.05
M
Tris-maleate buffer, 20 m
M
sodium cholate at pH 8. Sodium cholate was added to
improve the solubility of retinyl palmitate. Purified rat
microsomal carboxylesterases were incubated for
10–60 min with 0.3–20 l
M
of retinyl palmitate. The reac-
tions were stopped by addition of 3 mL of acetonitrile. Ten
microliters of 10 l
M
all-trans-retinal in dimethylsulfoxide
were added to each sample as internal standard. We
analyzed the retinol standard solution by HPLC and did not
detect any all-trans-retinal contamination. A standard curve
for retinol was constructed for each experiment and we did
not detect any spontaneous oxidation of retinol to retinal.
Retinol and all-trans-retinal were extracted with solid phase
C-18 columns (Varian Inc.). The columns were washed
with 3 mL of methanol and equilibrated with 3 mL of
acetonitrile/water (40 : 60, v/v) prior to loading the sample.
After loading the samples, columns were washed with 3 mL
of acetonitrile/water (40 : 60, v/v) followed by 3 mL of
ethanol/water (60 : 40, v/v). Retinol was eluted from the
cartridges with 1.8 mL of acetonitrile/methanol (95 : 5, v/v)
and dried under nitrogen. The samples were reconstituted in
100 lL of mobile phase constituting of acetonitrile/0.5
M
ammonium acetate buffer pH 7.0/tetrahydrofuran
(168 : 70 : 10, v/v/v) and 40 lL was injected onto the
column. Retinol elution was monitored with a UV detector
at 350 nm. Retinol and all-trans-retinal eluted at 10.5 min
and 13.0 min, respectively (1 mL min
)1
)fromthe5lm,
4.5 · 150 mm Luna C-8 column (Phenomenex). Retinol
concentration in experimental samples was calculated from
the fit of data to a standard curve by linear regression
analysis. The K
m
and k
cat
kinetic constants were derived
from the fit of data to the Michaelis–Menten equation using
GRAFIT
4.0 software (Erithracus Software).
Purification of rat liver microsomal carboxylesterases
Liver microsomes were prepared from male Sprague–
Dawley rats by the method of Pedersen et al.[20].Eighty
4388 S. P. Sanghani et al. (Eur. J. Biochem. 269) Ó FEBS 2002
grams of rat livers were homogenized in 0.22
M
mannitol,
70 m
M
sucrose in 2 m
M
Hepes, pH 7.4 using a Potter–
Elvehjem homogenizer. The microsomes obtained by
differential centrifugation were resuspended in 0.1
M
Tris,
pH 8.5 and frozen at )80 °C until further use. Microsomes
were solubilized for 30 min in 0.25% Lubrol at a protein
concentration of 5 mgÆmL
)1
. Centrifugation at 100 000 g
for 30 min gave a supernatant that was subjected to
ammonium sulfate fractionation as suggested by Hosokawa
et al. [21]. The protein pellet from 30–70% ammonium
sulfate saturation was solubilized in 10 m
M
Tris pH 7.4
containing 1 m
M
each of Ca
2+
,Mn
2+
and Mg
2+
chloride
salts. This solution was directly applied to a 2.5 · 7cm
concanavalin A affinity column (Sigma-Aldrich, St. Louis,
MO, USA) in the same buffer. The column was washed
with the buffer without divalent cations until the A
280
of the
eluant was minimal. The glycosylated proteins were eluted
with 10 m
M
Tris buffer, pH 7.4, 0.2
M
sodium chloride and
0.5
M
methyl-a-
D
-mannopyranoside. The fractions contain-
ing esterase activity were pooled, concentrated and equili-
brated in 20 m
M
Tris buffer, pH 7.4 (buffer A), using an
Amicon 8200 concentrator containing YM 30 membrane.
The concentrated protein sample was subjected to
preparative nondenaturing gel electrophoresis using the
Bio-Rad Prep Cell model 491. The proteins were separated
on 1.5 cm of a 4% stacking gel and 4 cm of 6% separating
gel poured in a 37-mm diameter tube. The protein eluting
from the gel was collected in 0.025
M
Tris and 0.192
M
glycine buffer at 1 mLÆmin
)1
. Carboxylesterase activity was
measured in the eluant and the peaks with esterase activity
were pooled, concentrated and equilibrated in buffer A.
Peaks were subjected to analytical nondenaturing PAGE
prior to tryptic digestion and analysis by LC/ESI-MS.
Less abundant carboxylesterase peaks were further puri-
fied by anion exchange chromatography. A MonoQ HR 5/5
column was equilibrated in buffer A and the concentrated
protein samples from preparative nondenaturing gel elec-
trophoresis were injected. The column was washed with
buffer A at 0.5 mLÆmin
)1
for 10 min followed by a linear
gradient of 0–50% 20 m
M
Tris with 1
M
NaCl (buffer B)
over 60 min, followed by 5 mL of 50% buffer B. Carboxyl-
esterases were identified by 4-methylumbelliferyl acetate
assay, concentrated and equilibrated in buffer A. These
purified enzymes were used for steady state kinetic studies.
Non-denaturing polyacrylamide gel electrophoresis
(nondenaturing PAGE)
Carboxylesterases were separated by analytical discontinu-
ous nondenaturing PAGE using the Ornstein–Davis buffer
system [22] as described by Dean et al. [23]. Gels were
stained for carboxylesterase activity by incubating them for
15minin100m
M
phosphate buffer, pH 6.5, containing
0.02% 4-methylumbelliferyl acetate. After imaging, the gels
were stained with coomassie blue and the protein bands
corresponding to the carboxylesterase activity were cut out
from the gel for digestion with trypsin and analysis of tryptic
peptides by mass spectrometry.
Mass spectrometry of tryptic peptides
Protein was in-gel digested with 10% (w/w) sequencing-
grade trypsin (Worthington) as described by Speicher et al.
[24]. Digests and peptide extractions were performed at
37 °C with shaking using a Thermomixer (Eppendorf).
Peptide extracts were concentrated (Speed Vac, Savant
Instruments, Inc.) prior to analysis. Reversed-phase chro-
matography was performed with a fused silica column
(300 lmID· 20 cm) packed with a 10-lm, 300 A
˚
Vydac C-18 matrix [25]. Peptide elutions were performed
with an Applied Biosystems 140D HPLC system using
linear gradient of 0–95% acetonitrile in water containing
isopropanol/acetic acid/trifluoroacetic acid (0.2 : 0.1 : 0.001
v/v/v). Column effluents, at 6 lLÆmin
)1
, were infused
directly into a Finnigan LCQ ion-trap mass spectrometer.
Data was acquired using
XCALIBUR
software (Finnigan) by
employing repeating cycles of a full scan, high resolution
scan and finally a collisionally induced decomposition
(CID) scan of the parent ion selected in the first scan of
the cycle. To identify parent peptides and corresponding
proteins, the fragmentation data was processed by Sequest
software (Thermoquest) and used to query a rat database
extracted from the nonredundant protein database obtained
from NCBI.
Automated amino acid sequencing
Proteins were digested with 10% (w/w) trypsin (Promega,
sequencing grade) in 40 m
M
ammonium bicarbonate at
37 °C overnight. Concentrated peptide mixtures were
separated on a 500-lmID· 20 cm fused silica capillary
column packed with C-18 matrix (Vydac). Linear elution
gradients were generated using an ABI 172 HPLC with
acetonitrile/water/trifluoroacetic acid buffers and peaks
were collected manually based on the UV signal. Individual
peptide fractions were sequenced using a Procise cLC
(Perkin Elmer Applied Biosystems) employing vendor-
supplied reagents for Edman degradation.
PCR amplification of a new isoenzyme
Reverse transcription and PCR amplifications were per-
formed with the Perkin Elmer GeneAmp RNA PCR kit.
One microgram of rat liver RNA from Sprague–Dawley
rats was reverse-transcribed following the supplier’s proto-
col using random hexamer primers. Degenerate primers
were designed to the peptide sequences identified by amino
acid sequencing and 0.3 l
M
of each primer,
5¢-GTNCAYCCNACNCCNATGTCYGA-3¢ and 5¢-CTCR
TARAARTANACAGGRGC-3¢,wasused.The50lL
PCR mixture contained 2 m
M
Mg
2+
,0.2m
M
of each
nucleotide and 2.5 U of Amplitaq. The rat liver cDNA was
denatured at 95 °C for 2 min and amplified using a DNA
Thermal Cycler (Perkin-Elmer) with 35 cycles of 95 °Cfor
1min,58°C for 30 s and 72 °C for 1 min. The 1 kb PCR
product was identified, cloned and sequenced. Marathon
Ready rat liver cDNA, anchor primers AP1 and AP2
(Clontech, Palo Alto, CA, USA), and gene specific primers
5¢-AGGCCCAGGAACGGGATTCC-3¢ for 5¢ RACE
and 5¢-GATAAATCTGAGGTGGTCTACAAG-3¢ for
3¢ RACE were used to amplify the new gene with the
PCR reagent concentrations described above. The cDNA
was denatured at 95 °C for 2 min and then amplified using
following 35 cycles, 95 °C for 30 s and 68 °C for 3 min. The
5¢ RACE product was cloned and sequenced. The 3¢ RACE
product was further amplified by nested PCR using AP2
Ó FEBS 2002 Hydrolysis of retinyl palmitate by carboxylesterases (Eur. J. Biochem. 269) 4389
and nested gene specific primer 5¢-GGAATCCCTGTG
TTCCTGGGCCT-3¢. Both the 5¢-and3¢-RACE products
were cloned and sequenced.
The complete cDNA for this carboxylesterase was cloned
by amplifying rat liver cDNA with the primers
5¢-CTGAGATTCAACCATGCCTTTGGC-3¢ and 5¢-TTG
CCCAGAATGATAACACAGAGG-3¢ that were desig-
nedtothemost5¢ and 3¢ regions, respectively, from the
sequence information from the race products. Pfu polymer-
ase (Stratagene) was used for this PCR reaction at 2.5 U per
50 lL. Reactions were performed as described by Strata-
gene and the final primer concentration was 1 l
M
for each
primer. Marathon Ready rat liver cDNA was denatured at
95 °C followed by 35 cycles of 95 °Cfor45 s,65 °Cfor45 s
and 72 °C for 3 min and final elongation at 72 °Cfor5 min.
The 1.8 kb PCR product was cloned into the Zero Blunt
TOPO cloning vector (Invitrogen Corp.) and three clones
were picked and sequenced entirely in both direction.
Determination of pI
Isoelectric focusing was carried out on a LKB Bromma
2117 Multiphor instrument using premade IsoGel agarose
IEF Plates (FMC). About 1–5 lgofeachisoenzymein
10 m
M
Tris buffer and 4 lg of IEF markers (Sigma-
Aldrich) pI 3.6–9.3 were loaded on the gel in duplicate.
Proteins were focused under constant power of 10 W for
45–60 min. Half of the gel was immediately stained for
total protein with coomassie blue and the duplicate half
was stained for activity as described for nondenaturing
PAGE. The pI for each isoenzyme was calculated from the
standard curve and the average of the major bands is
reported.
Oligonucleotide probing of rat multiple-tissue Northern
blot for expression of carboxylesterases
Oligonucleotides specific for each isoenzyme were designed
from sequence alignments. The oligonucleotides are as
follows: for ES10 5¢-ATCAGCTTAGCAATGGGCTTG
CTA-3¢;ES45¢- TCGGCAGCACTACATTGTCAAC-3¢;
ES3 5¢- GAGTCTCCGTGCAAATCCAGCG-3¢; D50580
5¢-TGTTCTTCAGAACAGCCCGCATG-3¢; AB010635
5¢-CAGCGGGAATCATCTTGAAGACC-3¢ and for
AY034877 5¢-AGGCCCAGGAACACAGGGATTCC-3¢.
The specificity of oligonucleotides for ES10, ES4, ES3 and
D50580 was verified by slot blot analysis. The oligonucleo-
tides were labeled with [c-
32
P]dATP (Perkin Elmer) using T
4
polynucleotide kinase (Promega). The labeled oligonucleo-
tides were desalted using a G25 spin column (Pharmacia
Amersham) and used to probe a 12-tissue rat Northern blot
(Origene Technologies). The specific activities of the
oligonucleotide probes were between 12 and 17 · 10
8
cpmÆlg
)1
and b-actin probe was 2.7 · 10
8
cpmÆlg
)1
.
Oligonucleotide probes were heated at 80 °Cfor3min
with 100 lL of sonicated salmon sperm DNA (Stratagene)
prior to hybridization. The blot was prehybridized for
30 min in Quikhyb solution (Stratagene), hybridized for
16–20 h at 55 °C and washed with 2 · NaCl/Cit containing
0.1% SDS, two washings for 15 min at room temperature
followed by one 30 min wash at 55 °C. The radioactive blot
was developed by exposure to a phosphoimager screen for
24–48 h and analyzed in a Bio-Rad Phosphoimager.
RESULTS
Separation and isolation of rat carboxylesterases
by preparative nondenaturing PAGE
In this study, we developed a simple procedure for
purification of rat liver microsomal carboxylesterases
resulting in separation of six different isoenzymes. Conca-
navalin A affinity chromatography, as shown in Tables 1
and 2, is an effective step in this procedure because it
enriched glycosylated carboxylesterases activity by 5.6-fold
with 69% recovery. Five glycosylated carboxylesterase
activities were separated on preparative nondenaturing
PAGE as shown in Fig. 1. All activities were concentrated
and the enzymes were readily identified on nondenaturing
PAGEasshowninlanes1–5inFig.2.Morethan90%of
carboxylesterase activity loaded onto preparative nondena-
turing PAGE was recovered in the five peaks. As seen in
Table 1, peak 1 was purified 6.3-fold on PAGE and exhibits
a single protein band (lane 1, Fig. 2B) with specific activity
of 42 UÆmg
)1
. The specific activities for peaks 2–5 are lower
Table 1. Purification of rat liver microsomal carboxylesterases. Carb-
oxylesterases were purified from microsomes prepared from livers of
male Sprague–Dawley rats. The glycosylated and nonglycosylated
carboxylesterases were separated during concanavalin A affinity
chromatography. Peaks 1–5 on preparative PAGE represent five gly-
cosylated carboxylesterase activities that bound to concanavalin A
affinity column and separated on nondenaturing PAGE. The purifi-
cation of nonglycosylated carboxylesterases that did not bind to con-
canavalin A column is not shown. One unit of activity is defined as the
amount of enzyme catalyzing formation of 1 lmol of product,
4-methylumbelliferone, in 1 min. Specific activity is defined as micro-
moles of 4-methylumbelliferone product formed per minute per mg of
protein under the conditions described in Experimental procedures.
Purification step
and enzyme form
Total
protein
(mg)
Total
activity
(U)
Specific
activity
(UÆmg
)1
)
Lubrol high speed supernatant 1879 1450 0.77
Ammonium sulfate fractionation 827 974 1.18
Concanavalin A 101 675 6.7
Preparative PAGE (210 U loaded)
Peak 1 4.45 186.5 41.9
Peak 2 1.23 20.7 16.7
Peak 3 0.71 7.3 10.2
Peak 4 0.74 4.7 6.3
Peak 5 0.38 1.3 3.6
Table 2. Peak 3, 4 and 5 activities from three separate preparations were
combined and subjected to MonoQ chromatography.
Before MonoQ After MonoQ
Total
protein
(mg)
Total
activity
(U)
Specific
activity
(UÆmg
)1
)
Total
protein
(mg)
Total
activity
(U)
Specific
activity
(UÆmg
)1
)
Peak 3 3.7 15.8 4.3 0.3 9 30.1
Peak 4 3.94 8.4 2.1 0.69 3.8 5.5
Peak 5 3.0 5.4 1.8 0.09 2.6 29.7
4390 S. P. Sanghani et al. (Eur. J. Biochem. 269) Ó FEBS 2002
(Tables 1 and 2). While each peak is pure with respect to
cross contamination by the other isoenzymes (lanes 2–5,
Fig. 2A), peaks 2–5 exhibitmultiple protein bands(lanes 2–5,
Fig. 2B). The purity of peak 2 was optimized by pooling
fewer fractions and peaks 3–5 were purified to homogeneity
by ion exchange chromatography using a MonoQ column
(Table 2). The purified carboxylesterases were used to study
their retinyl palmitate hydrolase activity.
Separation of nonglycosylated carboxylesterases
The flow-through from the concanavalin A column had
only 2% or 19 units of carboxylesterase activity with a
specific activity of 0.04 UÆmg
)1
of protein. Three faint
activity bands were detected on nondenaturing PAGE (not
shown). Partial purification of these three activities allowed
their separation on nondenaturing PAGE (not shown) and
their identification by LC/ESI-MS.
Identification of carboxylesterases by mass
spectrometry
Each carboxylesterase protein band that was separated by
preparative and analytical nondenaturing PAGE was
characterized by the LC/ESI-MS methods. Bands were
cut out of the analytical nondenaturing gel, digested with
trypsin and the mixture of peptides was separated by
capillary HPLC. Sequence analysis was performed by
electrospray tandem mass spectrometry. Each protein was
analyzed from at least two different preparations. An
example of a total ion chromatogram of tryptic peptides
from peak 4 is shown in Fig. 3. The results of the MS
sequencing experiments for the five purified carboxylester-
ase isoenzymes are summarized in Fig. 4. As shown in
Fig. 1, peak 1 (Fig. 2, lane 1) is the most abundant
carboxylesterase from rat liver accounting for 85% of the
total activity recovered from preparative nondenaturing
PAGE. This protein was positively identified as ES10 by
MS analysis with as high as 26% protein sequence coverage
(Fig. 4). It is known to be a homotrimer [26] and exhibits
the most cathodic mobility of all carboxylesterase activities
on nondenaturing PAGE. Peak 2 (Fig. 2, lane 2) accounted
for 9.4% of the total activity recovered from preparative
PAGE (Table 1) and it appears as a doublet as shown in
Fig. 4. The relative abundance of these bands varies from
preparation to preparation. In one preparation where the
bands were equally present, both of them were individually
analyzed by mass spectrometry of their tryptic peptides.
Table 3 lists the peptides identified for each band as an
example and the peptides shown in bold were identified in
both the bands. As seen in Table 3, both the bands were
identified to be products of the ES4 gene [27] with as high as
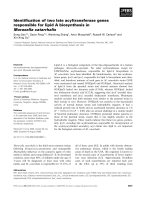
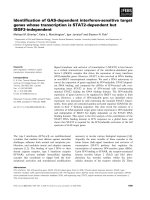
Fig. 1. Elution profile of glycosylated carboxylesterases from prepara-
tive nondenaturing PAGE. Fractions were assayed for carboxylesterase
activity with 4-methylumbelliferyl acetate as substrate as described in
materials and methods. Activity in UÆmL
)1
is plotted as a function of
fraction number, identifying the peaks with carboxylesterase activity.
The peaks are labeled 1–5 based on their cathodic to anodic mobility
on nondenaturing PAGE shown in Fig. 2A, lane G.
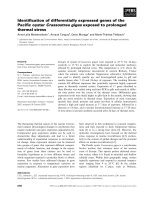
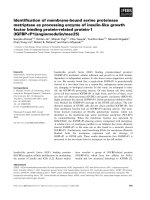
Fig. 2. Non-denaturing polyacrylamide gel of rat liver microsomal
carboxylesterases stained for activity and protein. The glycoprotein
fraction of microsomal extract and the five activity peaks seen in Fig. 1
were individually concentrated and 15 lg of protein from each peak
was separated by nondenaturing PAGE. Panel A is stained for carb-
oxylesterase activity and panel B is the same gel stained with coomassie
blue. Arrows mark the positions of the protein bands with carboxy-
lesterase activity. Lane 1 is peak 1; lane 2 is peak 2; lane 3 is peak 3; lane
4 is peak 4; lane 5 is peak 5 as seen in Fig. 2 and lane G is glycosylated
proteins that bind to concanavalin A resin that was purified by pre-
parative nondenaturing PAGE (Fig. 1).
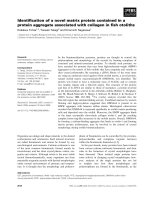
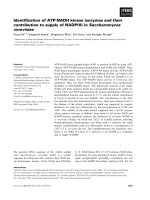
Fig. 3. Total ion chromatogram of carboxylesterase peak 4. The protein
band with carboxylesterase activity in peak 4 (Fig. 1) was cut out from
the nondenaturing polyacrylamide gel, marked by an arrow in lane 4 of
Fig. 2. The protein was in-gel digested with trypsin and the mixture of
tryptic peptides was injected into capillary HPLC and analyzed by
ESI-MS. The mass-to-charge ratios of the ion with the largest response
in the major peaks are indicated in the chromatogram.
Ó FEBS 2002 Hydrolysis of retinyl palmitate by carboxylesterases (Eur. J. Biochem. 269) 4391
45% sequence coverage. There is a faint band below the
doublet of peak 2 (Fig. 4) and in one preparation we pooled
the fractions corresponding to this band and identified it to
be ES4 by LC/ESI-MS with 32% coverage. Peak 3 (Fig. 2,
lane 3) accounts for only 3.3% of activity recovered from
preparative PAGE (Table 1). It was sequenced from three
Table 3. Peptides identified by mass spectrometry for the two bands in peak 2 (Fig. 4). The two bands for peak 2 were individually sequenced and the
peptides identified for both the bands are listed below. The peptides that were common to both the bands are shown in bold type in the list for band
a. Boxed amino acids are unique to ES4 (13) in comparison to hydrolase B (12). Underlined amino acids are unique to ES4 in comparison to
hydrolase C (10). Observed (M + H)
+
using monoisotopic m/z ion in high resolution segment.
Peptide number
Predicted
(M + H)
+
ion
Observed
(M + H)
+
ion
Identified fragment
ions/total fragment
ions
Peptide position in
ES4 (GI:2494386) Peptide sequence
ES4 band a
1 1451.9 1451.9 16/26 51–64 LGVPFAKPP
L GSLR
2 1600.8 1601.4 16/26 65–78 FAPPQPAEPWSFVK
3 976.5 976.5 12/14 97–104 MNDLLTNR
4 686.4 686.5 7/8 238–242 NL
FHR
5 1630.9 1631.4 19/30 243–258 AISESGVV
FL P GLLTK
6 1618.9 1618.7 17/24 287–299 QKTEEELLEIM
KK
7 1947.0 1947.5 24/32 313–329 ESYHFLSTVVDNVVLPK
8 702.4 702.3 9/10 333–338 EILAEK
9 918.5 918.8 12/14 375–382 MAI
TLLEK
10 1593.8 1593.8 11/28 419–433 IGDV
SF SI PSVMVSR
11 1573.7 1573.3 13/26 461–474
HVVGDHADDLYSVF
12 626.4 626.4 9/10 475–480 GAPILR
13 977.4 977.4 12/16 481–489 DGASEEEIK
14 911.5 911.6 11/12 497–503 FWANFAR
15 1368.7 1368.2 12/20 511–521 GLPHWPQYDQK
16 1747 1747.0 24/28 537–551 LKAEEVAFWTQLLAK
17 1255.6 1255.7 10/18 552–561 R
Q PQPHHNEL
ES4 band b
1 1498.8 1498.5 10/26 37–50 Y
VSLEGVTQSVAVF
2 2375.2 2375.7 16/44 133–155
LPVMVWIHGGGMTLGGASTYDGR
3 2644.4 2644.3 19/88 310–332
DNKESYHFLSTVVDNVVLPKDPK
4 1478.8 1478.8 14/24 339–351 NFNTVPYIVGINK
5 1975.08 1975.0 23/34 383–400 FAS
LYGIPEDIIPVAIEK
6 904.5 904.4 11/14 411–418 IRDGILAF
6 1584.8 1584.2 12/24 448–460 QYYPSFSSPQRPK
7 1305.7 1305.7 12/22 481–492 DGASEEEIKLSK
8 1751.9 1751.9 1728 522–536 EEYLQIGATTQQSQR
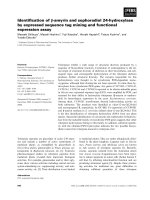
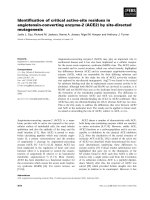
Fig. 4. Summary of mass spectrometry results of glycosylated carboxylesterases. A nondenaturing gel of glycosylated fraction of rat liver microsomal
proteins that were loaded onto preparative nondenaturing PAGE is shown at the left. The gel is stained for activity and the activity bands for
corresponding peaks are labeled with arrows. In this gel, peak 2 appeared as a doublet (band a and b). Each peak was further separated on
nondenaturing PAGE and the bands with activity were cut out and in-gel digested with trypsin. The peptide mixture for each band was analyzed by
LC/ESI-MS. The percentage of amino acid sequence identified for each isoenzyme in two or three different experiments is reported along with the
carboxylesterase isoenzyme identified from nr database as the primary match for each activity.
4392 S. P. Sanghani et al. (Eur. J. Biochem. 269) Ó FEBS 2002
different experiments and was identified as ES3, also called
the pI 5.6 isoenzyme, with 23–42% sequence coverage. Peak
4 (Fig. 2, lane 4) accounts for 2% of total activity recovered
from preparative PAGE. It was sequenced six times and a
unique match was not found in the database. In all six
experiments, only 7–9% of the protein sequence was
identical with D50580 or AB010635 (shown in bold in
Fig. 5). This band was subjected to amino acid sequencing
and identified as described below. Peak 5 (lane 5, Fig. 2 and
Table 1) accounted for only 0.6% of the activity recovered
from preparative PAGE (Table 1). This protein was
identified as the product of the gene D50580, also called
CE21p [28], with 18–30% sequence coverage in three
separate experiments.
The three minor activities that accounted for about 2% of
the microsomal activity and did not bind to concanavalin A
column were also analyzed by LC/ESI-MS (not shown).
One peak was identified as ES4 with 16% coverage. A
second peak was a doublet and both the bands could not be
assigned to any known carboxylesterase. The third peak was
a doublet on nondenaturing PAGE. Both bands were
individually sequenced and identified as protein products of
the gene AB010635 with 27% sequence coverage.
Identification of a new rat liver carboxylesterase
isoenzyme (AY034877)
Initial attempts to identify the carboxylesterase activity in
peak 4 (Figs 1 and 4) identified a few peptides that are
present in D50580 and AB010635 (shown in bold type in
Fig. 5). However, the majority of peptides from peak 4
could not be positively identified in the protein database.
The analysis of the mass spectrometry data of the tryptic
peptides relies on the presence of carboxylesterase sequences
in the protein database and consequently it cannot identify a
new carboxylesterase sequence. Hence, tryptic peptides were
purified and sequenced by automated Edman degradation
(Procise). The sequenced peptides are boxed in Fig. 5. The
de novo sequencing approach resulted in identification of
one unique peptide LTVHPTPMSED that did not match
any known protein in the nonredundant database. A
degenerate 5¢ primer designed to this peptide and a
3¢ primer to peptide QAPVYFYE were synthesized
(Fig. 4). These degenerate primers amplified a 1-kb DNA
product from Sprague–Dawley rat liver cDNA. The
product was cloned and the sequence identified it as a new
cDNA. Gene-specific primers were designed for 5¢ and 3¢
race reactions to amplify the newly identified sequence. The
complete cDNA for the new isoenzyme was obtained by
PCR using pfu polymerase (Stratagene) and the sequence is
shown in Fig. 6. This sequence was submitted to GenBank
and its accession number is AY034877. The protein in the
second peak that did not bind to concanavalin A is a
doublet. Both protein bands in this peak were also identified
as the products of AY034877 gene. There was 17 and 23%
coverage for these bands, respectively, by mass spectromet-
ric analysis of tryptic peptides.
Isoelectric point (pI) analysis
The determination of pI values for carboxylesterases by
isoelectric focusing is difficult because the isoenzymes
exhibit multiple bands. Nevertheless, the isoenzymes have
been routinely identified in the literature by their pI values.
All of the isolated proteins were equilibrated in the same
buffer before isoelectric focusing and the reported pI values
are the average of the major protein bands with carboxyl-
esterase activity from two to three different experiments
(Table 4). The experimentally determined pI values are
compared to values calculated from the protein sequence
without carbohydrate and the N-terminal signal peptide.
Steady state kinetics of retinyl palmitate hydrolysis
The purpose of this study was to investigate the role of
the five purified carboxylesterases as retinyl palmitate
Fig. 5. Amino acid sequence for a new carboxylesterase isoenzyme (AY034877). The translated amino acid sequence of the protein encoded by new
carboxylesterase gene (GI:AY034877) is shown. This protein has the predicted signal peptide at N-terminal shown in italics. The position of
asparagine in the potential glycosylation site is indicated (*). The active site residues and conserved cysteines were identified by homology with other
carboxylesterases, are marked by arrows and (d), respectively. Peptides identified by automated amino acid sequencing are boxed. The peptides
identified by mass spectrometry prior to identification of new gene are shown in bold. The peptides identified by mass spectrometry after adding the
AY034877 sequence to the database are underlined.
Ó FEBS 2002 Hydrolysis of retinyl palmitate by carboxylesterases (Eur. J. Biochem. 269) 4393
hydrolases. Studies on solubility of retinyl palmitate in
50 m
M
Tris-maleate buffer pH 8.0 with and without 20 m
M
cholate show that sodium cholate increases the solubility of
retinol palmitate in assays to 50 l
M
.Duetoalimited
amount of AY034877, we determined its specific activity
with a single concentration of retinyl palmitate (20 l
M
).
D50580 was unstable so we have reported the range of k
cat
values determined after 10- and 20-min incubations. Retinol
product formation was linear for 60 min with isoenzymes
ES10, ES4 and ES3. The kinetics of retinol palmitate
hydrolysis was studied for ES10, ES4 and ES3 under steady-
state conditions. The HPLC chromatogram in Fig. 7B
shows the elution profile of the product retinol and the
internal standard all-trans-retinal with AY034877 isoen-
zyme. The ratio of peak area for retinol to internal standard
was estimated for each sample and quantitated using the
standard curve for retinol generated under identical condi-
tions for each experiment. The kinetic constants for the five
purified carboxylesterases are summarized in Table 5. The
K
m
values for retinyl palmitate for the ES10, ES4 and ES3
isoenzymes were about 1 l
M
. ES4 was the most efficient
enzyme studied with a specific activity of 7.5 nmolÆ
min
)1
Æmg
)1
. AY034877 (Fig. 7B) was the least efficient
enzyme with a specific activity of 0.8 nmolÆmin
)1
Æmg
)1
.
Most importantly, all five isoenzymes can function as retinyl
palmitate hydrolases. ES10 and ES4 are estimated to
contribute 94% of the liver retinyl palmitate activity.
Tissue distribution of rat liver carboxylesterase
The high sequence homology among these isoenzymes (up
to 80%) makes it difficult to study their tissue distribution
by Northern blot analysis using full-length cDNAs as
probes. Hence, specific oligonucleotide probes were
designed for each isoenzyme to identify their specific
cDNAs. Slot-blot cross-hybridization experiments for
Fig. 6. cDNA sequence for new isoenzyme. The cDNA sequence for new glycosylated rat liver carboxylesterase is reported in GenBank as
GI:AY034877. The start and the stop codons are shown in bold. The coding region is shown in upper case and the UTR is shown in lower case. The
sequence of last 33 nucleotides in the 3¢-UTR was from the 3¢-RACE clones and the polyadenylation signal is underlined. The translated protein
sequence is shown in Fig. 5.
4394 S. P. Sanghani et al. (Eur. J. Biochem. 269) Ó FEBS 2002
ES10, ES3, ES4 and D50580 showed an absolute specificity
of each oligonucleotide probe to their respective cDNA
(data not shown). A multiple-tissue Northern blot was
sequentially probed with an oligonucleotide specific for each
isoenzyme. Message for ES10 was 2.2 kb, ES4 and
AY037877 were 2.0 kb, ES3 was 2.1 kb, D50580 was
2.4 kb and AB010635 was 2.3 kb, no additional bands were
observed in all six Northern blots. In agreement with the
protein purification in Tables 1 and 2, mRNAs for all five
glycosylated isoenzymes are expressed in the liver (Fig. 8).
AB010635 was identified in the fraction that did not bind
concanavalin A and in agreement with protein identification
its message is detected in the liver. Multiple isoenzymes are
also expressed in the kidney, ES4, ES3, AB010635 and
AY034877, and in small intestine, ES3 and AY034877. The
isoenzymes are differentially expressed in other tissues. For
example, only ES10 is seen in lung and testis, both ES10 and
ES3 are seen in skin. Stomach expresses AB010635 and
AY034877 both isoenzymes belong to CES2 family. No
isoenzyme expression was detected in brain, thymus, heart
or spleen. The even loading of all samples was confirmed
with cDNA probe for b-actin, which was supplied by
Origene Technologies.
Table 4. Properties of microsomal rat liver carboxylesterases. The experimental isoelectric point (pI) for all rat liver carboxylesterases were
determined as described in material and methods the values reported in the table are average of 2–3 different experiments. The calculated pI for all
carboxylesterases without the signal peptide and carbohydrate was determined using
PROTPARAM
software available at the ExPASy website (http://
www.expasy.ch/tools/protparam.html). The potential N-glycosylation sites [36] were predicted using
SCANPROSITE
software and the location of
asparagines for each isoenzyme is tabulated. The positions of conserved cysteines and active site serine, glutamic acid and histidine residues are
determined by homology to cholinesterases [37] whose X-ray structure is known.
Isoenzyme
Experimental
pI
Calculated
pI
Positions of predicted residues
Glycosylated
Asn
Conserved
Cys
Active site triad
Ser Glu His
ES10 6.05 6.2 79, 489 88, 116, 273, 284 221 353 466
ES4 6.7 6.3 79 87, 116, 273, 284 221 353 466
ES3 5.7 5.6 79, 107, 489 87, 116, 273, 284 221 353 466
AY034877 6.0 6.1 275 95, 122, 279, 290 227 344 456
D50580 5.3 5.6 261 272 550 92, 119, 276, 287 224 341 452
AB010635
a
4.8 5.4 None 97, 125, 282, 293 230 347 459
a
AB010635 was expressed in low amount in the fraction of the microsomal extract that did not bind to concanavalin A sepharose (not
shown).
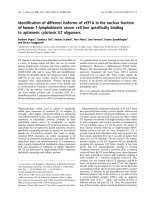
Fig. 7. HPLC profile for retinyl palmitate hydrolase assay. Panel A
shows the HPLC profile of an assay without addition of enzyme and
panel B shows the profile for a reaction mixture with AY034877
carboxylesterase. Retinol elutes at 10.5 min and the internal standard,
all-trans-retinal, elutes at 13.0 min. The absorbance of retinol is
monitored at 350 nm.
Table 5. Summary of kinetics of retinyl palmitate hydrolysis by carb-
oxylesterases. Steady state kinetics for hydrolysis of retinyl palmitate
by carboxylesterase was studied at 37 °Cin1mLof0.05
M
Tris-
maleate buffer, 20 m
M
sodium cholate at pH 8. Purified carboxylest-
erase isoenzymes were incubated for 10–60 min with 0.3–20 l
M
of
retinyl palmitate. The retinol formed was extracted with SPE method
described in methods and separated by HPLC on a 5-lm,
4.5 · 150 mm Luna C-8 column (Phenomenex) and eluant was
monitored at 350 nm. All-trans-retinal was used as an internal stand-
ard. The amount of retinol in each sample was quantitated from the
standard curve for retinol run with each experiment. The relative
percentage of retinyl palmitate activity for each isoenzyme eluting from
preparative PAGE was calculated from the specific activity of the
purified hydrolases and the number of milligrams recovered on pre-
parative PAGE (Table 1). ND, not determined.
Enzyme
K
m
(l
M
)
k
cat
(min
)1
)
k
cat
/K
m
(l
M
)1
Æ
min
)1
)
Relative
percentage
retinyl
palmitate
activity
ES10 1.16 ± 0.12 0.22 ± 0.04 0.19 60
ES4 1.4 ± 0.5 0.45 ± 0.1 0.32 34
ES3 0.89 ± 0.54 0.19 ± 0.6 0.21 3
AY034877 ND 0.05
a
ND 3
D50580 ND 0.17–0.27
a,b
ND 0.05
a
k
cat
s were estimated at single concentration of retinyl palmitate,
20 l
M
.
b
Due to instability of D50580 enzyme the range of k
cat
estimates for 10 and 20 min incubations is reported.
Ó FEBS 2002 Hydrolysis of retinyl palmitate by carboxylesterases (Eur. J. Biochem. 269) 4395
DISCUSSION
Liver is the primary site for the complex regulation vitamin
A uptake from chylomicrons, storage of vitamin A esters
and mobilization of retinol for transport to target tissues [3].
The primary goal of this study was to identify carboxyles-
terases that are expressed in rat liver and investigate their
ability to function as retinyl palmitate hydrolases. We
identified five glycosylated carboxylesterases in rat liver
microsomal extracts that had activity with 4-methylumbel-
liferyl acetate as substrate. In agreement with the literature,
ES10 and ES4 (Fig. 1, peaks 1 and 2) accounted for > 80%
of 4-methylumbelliferyl acetate and retinyl palmitate
hydrolase activity (Table 5). Hence they are the most
abundant broad substrate specificity carboxylesterases in rat
liver [29]. The multiplicity and tissue-specific expression of
the less abundant rat liver carboxylesterases are controver-
sial. Minor peaks 3–5 (Tables 1 and 2) account for only 6%
of 4-methylumbelliferyl hydrolase activity in the liver. This
low abundance makes their purification challenging. More-
over, the identification of rat liver carboxylesterases based
on pI values is difficult because of the complexity of their
banding patterns and the variation in the reported values
from one laboratory to another [30]. These carboxylesterase
isoenzymes have overlapping substrate specificities so it is
equally difficult to differentiate them by substrate specificity
[28,16]. Hence, we decided to purify and sequence five
nonspecific carboxylesterases by LC/ESI-MS prior to
evaluating them as retinyl palmitate hydrolases.
An efficient purification procedure was developed to
separate the carboxylesterase isoenzymes from rat liver
microsomes. Concanavalin A chromatography was used to
isolate the microsomal glycoproteins and preparative non-
denaturing PAGE was used to separate isoenzymes. Five
carboxylesterase forms were purified (Fig. 2 and Table 1).
Recovery from nondenaturing PAGE was always > 90%.
From three separate preparations, the yield of low abun-
dance carboxylesterases ES3, AY034877 and D50580
proved very reproducible. Their identity was determined
by individually sequencing the tryptic peptides for all five
peaks from multiple preparations by LC/ESI-MS. Four of
the five peaks were positively identified by LC/ESI-MS
(Fig. 4). Peak 1 was confirmed as ES10, also known as
hydrolase A, pI 6.0 or RH1. Peak 2 exhibited two major
bands on nondenaturing PAGE as shown in Fig. 4. Both
bands were positively identified as ES4 (Table 3). There are
three closely related genes reported in the database: ES4
[27], hydrolase B [10] and hydrolase C [31]. The amino acid
sequence for ES4 and hydrolase B differs by only 10 amino
acids; that of ES4 and hydrolase C differs by 38 amino
acids. The amino acids that would differentiate between ES4
and hydrolase B (boxed in Table 3) and ES4 and hydrolase
C are underlined in Table 3 and were examined from both
bands and agree with the ES4 sequence. Peak 3 was
identified as ES3 and peak 5 was confirmed to be protein
product of gene D50580. Tryptic peptides for peak 4 yielded
high quality MS data as shown in Fig. 3 but no known
protein could be assigned to this peak from analysis of the
nonredundant protein database. Peak 4 appeared to be a
new carboxylesterase isoenzyme. From a combination of
Edman amino acid sequencing, design of degenerate
oligonucleotide primers, PCR, and 5¢-and3¢-RACE, a
new isoenzyme, AY034877 was cloned. The previous MS
data for peak 4 was reanalyzed with the new sequence and
27% of the protein sequence could be assigned to the newly
identified protein, as shown by peptides underlined in
Fig. 5. The protein encoded by AB010635 gene does not
contain a consensus glycosylation sequence and consistent
with this we only found this isoenzyme in the protein
fraction that did not bind concanavalin A (not shown).
Hence, analyses by mass spectrometry resulted in identifi-
cation of three known carboxylesterases ES10, ES4 and
ES3, two protein products of cloned genes AB010635 and
D50580 and one new carboxylesterase, AY034877. We were
unable to identify ES2 (serum carboxylesterase) or hydro-
lase C in our rat liver microsomal extracts. So far we have
described at least four proteins arising from four different
genes in the hydrolase ÔCÕ region [29] suggesting that the
identification of isoenzymes from this region is more
complicated than previously appreciated.
The six rat carboxylesterases were divided into two
groups based on the sequence homology analysis, CES1 and
CES2 [16]. There is about 70% identity within a class and
about 50% identity between classes. This classification was
further supported by phylogenetic analysis (Fig. 9). In this
study, a nongapped alignment of all known rat carboxyl-
esterase protein sequences was created by ClustalW method
using
MACVECTOR
7.0 software (Oxford Molecular Ltd)
followed by generation of a tree by the neighbor joining
method (Fig. 9). The same tree was generated using
PHYLIP
package ( />html) with
PROTDIST
and
NEIGHBOR
software. For the six
carboxylesterases identified in this study, ES10, ES4 and
ES3 isoenzymes belong to CES1 and D50580; and
AB010635 and AY034877 belong to CES2, as predicted
by sequence identity analysis. Phylogenetic tree analysis of
the carboxylesterase supergene family has been described by
Satoh and Hosokawa by UPGMA method and the tree was
rooted to human class I (hCE-1) isoenzyme [16]. In
agreement with that study, all three rat CES1 isoenzymes
Fig. 8. Multiple tissue northern analysis for rat liver carboxylesterase.
Gene specific oligonucleotides were designed for each rat liver carb-
oxylesterase. The same blot was probed sequentially for each isoen-
zyme. Origene Technologies supplied b-actin probe along with the
blot. Oligo probes were hybridized at 55 °C in QuikHyb solution and
washed at 55 °Cin2· NaCl/Cit with 0.1% SDS.
4396 S. P. Sanghani et al. (Eur. J. Biochem. 269) Ó FEBS 2002
are classified as class I, however, rat CES2 isoenzymes were
not identified in their report.
The results of homology search of the new carboxylest-
erase cDNA sequence (AY034877) against the nonredun-
dant database using BLAST revealed that it was 80%
identical to hamster carboxylesterase [32] and 70% identical
to rat isoenzymes D50580 [28] and AB010635 (GI accession
number), all genes that belong to the CES2 family.
AY034877 encodes a protein of 558 amino acids with 26
amino acids of N-terminal signal peptide as predicted by
analyzing the C, Y and S score with Signal P1.1 [33]. The
signal peptide is shown in italics in Fig. 5. The new
carboxylesterase has molecular weight of 58 kDa as deter-
mined by SDS/PAGE and pI of 6.0 (Table 4). Analysis
of the new protein by
SCANPROSITE
software (http://www.
expasy.ch/tools/scnpsit1.html) reveals one potential glyco-
sylation site at amino acids 275–278, which is consistent
with its ability to bind concanavalin A. AY034877, has an
endoplasmic reticulum retention signal at the C-terminus
(–HAEL), which is consistent with its localization in rat liver
microsomes. Potential catalytic triad residues, Ser227,
Glu344 and His456, were identified by homology to other
isoenzymes and are marked by arrows in Fig. 5. Common
structural features for all six rat liver carboxylesterases
(Table 4) identified in this study were obtained by alignment
of the protein sequences. All six had a N-terminal
endoplasmic reticulum translocation signal of 18–26 amino
acids in length. The C-terminal HXEL endoplasmic retic-
ulum retention signal is a variant of the consensus eukary-
otic endoplasmic reticulum retention signal of KDEL [34].
All three rat liver CES1 isoenzymes, ES10, ES4 and ES3,
followed Michaelis–Menten kinetics for hydrolysis of retinyl
palmitate. The K
m
value for all three isoenzymes was about
1 l
M
, much lower than previously determined K
m
values for
pig retinyl palmitate hydrolase (27.5 l
M
) [35] and rat serum
carboxylesterase (69 l
M
) [13]. This difference in kinetic
constants probably reflects the different assay conditions,
for example, the use of sodium cholate in our assay increases
the solubility of retinyl palmitate, purification of retinyl
palmitate substrate prior to use, efficient sample preparation
by SPE in our assay compared to extraction and the identity
of isoenzymes studied. We found ES4 to be most efficient in
hydrolyzing retinol palmitate with V
max
of 7.5 nmolÆ
min
)1
Æmg
)1
in agreement with the reported V
max
of
7.3 nmolÆmin
)1Æ
mg
)1
[9]. In contrast to the previous reports
[9,13], the calculated k
cat
value of 0.2 min
)1
(Table 5) for
both ES10 and ES3 suggests that they can efficiently
hydrolyze retinyl palmitate. Based on the analysis of three
separate experiments for purification on nondenaturing
preparative PAGE ES10 and ES4 account for more than
83% of carboxylesterase protein in rat liver microsomes.
From their retinyl palmitate catalytic efficiency, we estimate
that ES10 and ES4 account for 94% of total carboxylest-
erase retinyl palmitate hydrolase activity and hence will
be most important carboxylesterase isoenzymes in liver
retinoid metabolism.
Of the three CES2 proteins identified in this study the
very low abundance of AB010635 prevented us from
investigating its role as retinyl palmitate hydrolase. Both
D50580 and AY034877 were not stable at 37 °Candso
their Michaelis–Menten kinetics could not be determined
because initial rate assays were nonlinear. However their
apparent k
cat
values were estimated to be 0.27 min
)1
and
0.05 min
)1
, respectively (Table 5). From the abundance of
isoenzymes in rat liver microsomes and the specific activities,
we predict that the relative contribution to total liver retinyl
palmitate hydrolysis would be ES10 ES4 ES3 ‡
AY034877 D50580. However the important issue of
vitamin A trafficking and storage in specific liver cells will
depend on the relative expression of isoenzymes in hepato-
cytes, stellate cells, Kupffer cells and endothelial cells.
The multiple tissue analyses (Fig. 8) show that carboxyl-
esterases are highly expressed in metabolizing tissues such as
lung, small intestine, liver, stomach, kidney, skin and testis.
Their distribution suggests that carboxylesterases may be
well positioned to enable metabolism of retinyl esters. For
example, expression of AY034877 and ES3 in small intestine
suggest that they may be involved in dietary vitamin A
uptake. The pharmacokinetics of retinyl ester metabolism
will be determined by the tissue specific expression of
carboxylesterase and their catalytic efficiency for ester
hydrolysis. Such understanding of retinyl ester metabolism
will be possible only upon identification of all expressed
isoenzymes and studying the role of individual isoenzymes
in retinoid metabolism.
ACKNOWLEDGEMENTS
This work is supported by grants R21AA12413-02 and R01DA06836-
06 from National Institutes of Health. Dr Sanghani is supported by
grant T32HL07182-22 from National Institutes of Health.
REFERENCES
1. Vogel, S., Gamble, M.V. & Blaner, W.S. (1999) Biosynthesis,
Absorption, metabolism and transport of retinoids. In Handbook
of Experimental Pharmacology Retinoids (Nau,H.&Blaner,W.S.,
eds), pp. 31–95. Springer, New York.
2. Blaner, W.S. (1994) The Liver: Biology and Pathobiology (Arias,
I.M., Boyer, J., Fausto, N., Jakoby, W.B., Schachter, D.A., &
Shafritz, D.A., eds), pp. 529–541. Raven Press, Ltd., New York.
Fig. 9. Phylogenetic tree for rat liver carboxylesterases. The phyloge-
netictreewasgeneratedby
MACVECTOR
7.0 software. Neighbor joining
method used a nongapped
CLUSTALW
alignment of all the carboxyl-
esterase proteins to generate the tree. GI accession numbers for their
cDNA identifies the carboxylesterases and their trivial names are in
brackets. The gene products that are identified in this study are shown
in bold. Hydrolase C and the small intestine (AB010632) were not
identified. The serum esterase lacks the microsomal retention signal
and is not expected to be present in rat liver microsomes.
Ó FEBS 2002 Hydrolysis of retinyl palmitate by carboxylesterases (Eur. J. Biochem. 269) 4397
3. Harrison, E.H. (2000) Lipases and carboxylesterases: possible
roles in the hepatic utilization of vitamin A. J. Nutr. 130, 340S–
344S.
4. Harrison, E.H. (1998) Lipases and carboxylesterases: possible
roles in the hepatic metabolism of retinol. Annu. Rev. Nutr. 18,
259–276.
5. Weng,W.,Li,L.,vanBennekum,A.M.,Potter,S.H.,Harrison,
E.H., Blaner, W.S., Breslow, J.L. & Fisher, E.A. (1999) Intestinal
absorption of dietary cholesteryl ester is decreased but retinyl ester
absorption is normal in carboxyl ester lipase knockout mice.
Biochemistry 38, 4143–4149.
6. van Bennekum, A.M., Li, L., Piantedosi, R., Shamir, R., Vogel,
S., Fisher, E.A., Blaner, W.S. & Harrison, E.H. (1999) Carboxyl
ester lipase overexpression in rat hepatoma cells and CEL defi-
ciency in mice have no impact on hepatic uptake or metabolism of
chylomicron-retinyl ester. Biochemistry 38, 4150–4156.
7. Blaner, W.S., Obunike, J.C., Kurlandsky, S.B., al Haideri, M.,
Piantedosi, R., Deckelbaum, R.J. & Goldberg, I.J. (1994) Lipo-
protein lipase hydrolysis of retinyl ester. Possible implications for
retinoid uptake by cells. J. Biol. Chem. 269, 16559–16565.
8. Troen, G., Nilsson, A., Norum, K.R. & Blomhoff, R. (1994)
Characterization of liver stellate cell retinyl ester storage. Biochem.
J. 300, 793–798.
9. Mentlein, R. & Heymann, E. (1987) Hydrolysis of retinyl esters by
non-specific carboxylesterases from rat liver endoplasmic
reticulum. Biochem. J. 245, 863–867.
10. Yan, B., Yang, D., Brady, M. & Parkinson, A. (1994) Rat kidney
carboxylesterase. Cloning, sequencing, cellular localization, and
relationship to rat liver hydrolase. J. Biol. Chem. 269, 29688–
29696.
11. Robbi, M. & Beaufay, H. (1988) Immunochemical characteriza-
tion and biosynthesis of pI-6.4 esterase, a carboxylesterase of rat
liver microsomal extracts. Biochem. J. 254, 51–57.
12. Robbi, M. & Beaufay, H. (1994) Cloning and sequencing of rat
liver carboxylesterase ES-3 (egasyn). Biochem. Biophys. Res.
Commun. 203, 1404–1411.
13. Sun, G., Alexson, S.E. & Harrison, E.H. (1997) Purification and
characterization of a neutral, bile salt-independent retinyl ester
hydrolase from rat liver microsomes. Relationship to rat carboxy-
lesterase ES-2. J. Biol. Chem. 272, 24488–24493.
14. Yan, B., Yang, D., Brady, M. & Parkinson, A. (1995) Rat testi-
cular carboxylesterase: cloning, cellular localization, and relation-
ship to liver hydrolase A. Arch. Biochem. Biophys. 316, 899–908.
15. Robbi, M., Beaufay, H. & Octave, J.N. (1990) Nucleotide
sequence of cDNA coding for rat liver pI 6.1 esterase (ES-10), a
carboxylesterase located in the lumen of the endoplasmic
reticulum. Biochem. J. 269, 451–458.
16. Satoh, T. & Hosokawa, M. (1998) The mammalian carboxyl-
esterases: from molecules to functions. Annu.Rev.Pharmacol.
Toxicol. 38, 257–288.
17. Sporn, M.B., Roberts, A.B. & Goodman, D.S. (1994) The
Retinoids: Biology, Chemistry and Medicine, 2nd edn. Raven Press,
New York.
18. Brzezinski, M.R., Abraham, T.L., Stone, C.L., Dean, R.A. &
Bosron, W.F. (1994) Purification and characterization of a human
liver cocaine carboxylesterase that catalyzes the production of
benzoylecgonine and the formation of cocaethylene from alcohol
and cocaine. Biochem. Pharmacol. 48, 1747–1755.
19. Bradford, M.M. (1976) A rapid and sensitive method for the
quantitation of microgram quantities of protein utilizing the
principle of protein-dye binding. Anal. Biochem. 72, 248–254.
20. Pedersen, P.L., Greenawalt, J.W., Reynafarje, B., Hullihen, J.,
Decker, G.L., Soper, J.W. & Bustamente, E. (1978) Preparation
and characterization of mitochondria and submitochondrial par-
ticles of rat liver and liver-derived tissues. Methods Cell Biol. 20,
411–481.
21. Hosokawa, M., Maki, T. & Satoh, T. (1987) Multiplicity and
regulation of hepatic microsomal carboxylesterases in rats. Mol.
Pharmacol. 31, 579–584.
22. Ornstein, L. (1964) Disc electrophoresis I. Annal. NY Acad. Sci.
121, 321.
23. Dean,R.A.,Zhang,J.,Brzezinski,M.R.&Bosron,W.F.(1995)
Tissue distribution of cocaine methyl esterase and ethyl transferase
activities: correlation with carboxylesterase protein. J. Pharmacol.
Exp. Ther. 275, 965–971.
24. Speicher, K.D., Kolbas, O., Harper, S. & Speicher, D.W. (2000)
J. Biomol. Tech. 11, 74–86.
25. Davis, M.T., Stahl, D.C., Swiderek, K.M. & Lee, T.D. (1994)
Capillary liquid chromatography/mass spectrometry for peptide
and protein characterization. Methods: a Companion to Methods
in Enzymology 6, 304–314.
26. Arndt, R., Heymann, E., Junge, W. & Krisch, K. (1973) Pur-
ification and molecular properties of an unspecific carboxylester-
ase (E1) from rat-liver microsomes. Eur.J.Biochem.36, 120–128.
27. Robbi, M., Van Schaftingen, E. & Beaufay, H. (1996) Cloning and
sequencing of rat liver carboxylesterase ES-4 (microsomal palmi-
toyl-CoA hydrolase). Biochem. J. 313, 821–826.
28. Sone, T. & Wang, C.Y. (1997) Microsomal amidases and
carboxylesterases. Comp. Toxicol. 3, 265–281.
29. Morgan, E.W., Yan, B., Greenway, D., Petersen, D.R. &
Parkinson, A. (1994) Purification and characterization of two rat
liver microsomal carboxylesterases (hydrolase A and B). Arch.
Biochem. Biophys. 315, 495–512.
30. Simon, B., de Looze, S., Ronai, A. & von Deimling, O. (1985)
Identification of rat liver carboxylesterase isozymes (EC 3.1.1.1)
using polyacrylamide gel electrophoresis and isoelectric focusing.
Electrophoresis 6, 575–582.
31. Yan, B., Yang, D. & Parkinson, A. (1995) Cloning and expression
of hydrolase C, a member of the rat carboxylesterase family. Arch.
Biochem. Biophys. 317, 222–234.
32. Sone, T., Isobe, M., Takabatake, E. & Wang, C.Y. (1994) Cloning
and sequence analysis of a hamster liver cDNA encoding a novel
putative carboxylesterase. Biochim. Biophys. Acta 1207, 138–142.
33. Nielsen, H., Engelbrecht, J., Brunak, S. & von Heijne, G. (1997)
Identification of prokaryotic and eukaryotic signal peptides and
prediction of their cleavage sites. Protein Eng. 10, 1–6.
34. Munro, S. & Pelham, H.R. (1987) A C-terminal signal prevents
secretion of luminal ER proteins. Cell 48, 899–907.
35. Schindler, R., Mentlein, R. & Feldheim, W. (1998) Purification
and characterization of retinyl ester hydrolase as a member of the
non-specific carboxylesterase supergene family. Eur. J. Biochem.
251, 863–873.
36. Marshall, R.D. (1972) Glycoproteins. Annu. Rev. Biochem. 41,
673–702.
37. Taylor, P. & Radic, Z. (1994) The cholinesterases: from genes to
proteins. Annu. Rev. Pharmacol. Toxicol. 34, 281–320.
4398 S. P. Sanghani et al. (Eur. J. Biochem. 269) Ó FEBS 2002