Báo cáo khoa học: "Word classification based on combined measures of distributional and semantic similarity" docx
Bạn đang xem bản rút gọn của tài liệu. Xem và tải ngay bản đầy đủ của tài liệu tại đây (357.79 KB, 4 trang )
Word classification based on combined measures of distributional and
semantic similarity
Viktor Pekar
Bashkir State University,
450000 Ufa, Russia
Steffen Staab
Institute AIFB, University of Karlsruhe
/>& Learning Lab Lower Saxony
Abstract
The paper addresses the problem of
automatic enrichment of a thesaurus by
classifying new words into its classes.
The proposed classification method
makes use of both the distributional data
about a new word and the strength of the
semantic relatedness of its target class to
other likely candidate classes.
1 Introduction
Today, many NLP applications make active
use of thesauri like WordNet, which serve as
background lexical knowledge for processing the
semantics of words and documents. However,
maintaining a thesaurus so that it sufficiently
covers the lexicon of novel text data requires a
lot of time and effort, which may be prohibitive
in many settings. One possibility to (semi-)
automatically enrich a thesaurus with new items
is to exploit the distributional hypothesis. Ac-
cording to this approach, the meaning of a new
word is first represented as the totality of textual
contexts where it occurs and then assigned to that
semantic class which members exhibit similar
occurrence patterns.
The distributional approach was shown to be quite
effective for tasks where new words need to be as-
signed to a limited number of classes (up to 5; e.g.,
Riloff and Shepherd, 1997; Roark and Charniak,
1998). However, its application to numerous classes,
as would be the case with a thesaurus of a realistic
size, proves to be much more challenging. For ex-
ample, Alfonseca and Manandhar (2002) attain the
learning accuracy'
of 38% when assigning new
words to 46 WordNet concepts.
In the present paper we propose a method that is
particularly effective for the task of classifying words
into numerous classes forming a hierarchy. The po-
sition of a class inside the hierarchy reflects the de-
gree of its semantic similarity to other classes.
Besides distributional data, our method integrates
this semantic information: the classification decision
is a function of both (1) the distributional similarity
of the new word to the target class and (2) the strength
of the semantic relatedness of the target class to
other likely candidates. Thus, using the thesaurus as
background knowledge we aim to make up for pos-
sible insufficient quality of the distributional data.
2 Similarity measures
We evaluate our approach on the task where
nouns are classified into a predefmed set of semantic
classes. Thereby, the meaning of each noun
n
is rep-
resented as a distributional feature vector, where
features are verbs vc V linked to the noun by predi-
cate-object relations. The values of the features
are conditional probabilities
P(vIn)
estimated from
the frequencies observed in the corpus.
To measure the similarity between vectors of
nouns
n
and
m,
we used the L
1
distance metric
2
:
L
i
(n ,
=
El
P(vI
n)— P(v I m) I
(1)
ecV
To assign a noun to a class, we use the
k
near-
est neighbors algorithm (KNN): for each test
noun, it first determines a set of
k
nearest neigh-
bors according to the similarity metric and as-
Learning Accuracy (Hahn and Schattinger 1998) as an evaluation measure
is described in Section 3.
2
We also experimented with the cosine, Jaccard coefficient and the skew
divergence getting somewhat more favorable results for L1.
147
signs the noun to the class that has the majority
among the nearest neighbors. In doing so, a clas-
sifier produces a ranked list of candidate classes,
where the rank of a class is determined by the
number of its members present in the nearest
neighbor set. Our classification method combines
the ranking score for a class given by the classi-
fier with the semantic relatedness between sev-
eral top-ranking candidates. It prefers to assign
new words to those classes that are semantically
related to other likely candidate classes and dis-
favors those classes that appear to be semanti-
cally distant from other candidates.
To assess the semantic similarity between
classes in a thesaurus, we needed such a measure
that is independent of corpus data'. We chose the
measure used in (Hahn and Schattinger 1998). To
compare classes
c
and
d,
one first determines
their least common hypernym
h.
The semantic
similarity
T
between c
and
d
is then defined as
the proportion of the length
len(h,r)
of the path
between
h
and the root node
r
to the sum of
lengths len(h,r), len(c,h),
and
len(d,h):
r)
len(h,
T(c,d)=
(2)
len(h,r)+ len(c,h)+ len(d, h)
T
is directly proportional to the length between
the least common hypernym and the root, which
captures the intuition that a given length between
two concrete concepts signifies greater similarity
than the same length between two abstract con-
cepts.
T
is such that 1, with
T =
1 signify-
ing the maximum semantic similarity.
These two sources of evidence are then com-
bined to calculate a new score for each class
c:
S(c)=
A(c) + EA(d)•TP
(c,d)
(3)
deD
where A
(c)
is the score for the class
c
given by
the classifier
4
;
D
is a set of top ranking classes
other than
c
(their number is chosen experimen-
tally);
T(c,d) is semantic similarity between
c
and
a class de D. The function is dependent on the free
parameter
fi
(/3>1), which modifies
T
in such a
way that only those classes
d,
that are semantically
closest to
c,
contribute to the final score for
c.
The classification procedure can be summa-
rized as follows:
3
See (Budanitsky and Hirst, 2001) for a review of semantic similarity meas-
Ures.
In principle, it can be any type of a classifier that assigns some score to each
class, such as votes of nearest neighbors in the case of KNN or probabilities
in the case of Naive B ayes.
Step 1: For a new word w, a standard classifier
proposes a set of most likely candidate classes; the
score A
(c)
for each of the classes is remembered.
Step 2: A new score
S(c)
for each class
c
is com-
puted by adding to A
(c)
the sum of A (d)
over
de D,
each weighted by the semantic similarity
T(c,d).
Step 3:
w
is assigned to
c
with the biggest
S(c).
3 Test data and evaluation methods
The proposed method was tested on the dis-
tributional data on nouns obtained from two cor-
pora: the British National Corpus (BNC) and the
Associated Press 1988 corpus (AP)
5
. The BNC
data consisted of over 1.34 million verb-object co-
occurrence pairs, whereby the objects were both
direct and prepositional; only those pairs extracted
from the corpus were retained that appeared more
than once and which involved nouns appearing
with at least 5 different verbs. The AP dataset con-
tained 0.73 million verbs-direct objects pairs, which
involved 1000 most frequent nouns in the corpus.
The semantic classes used in the experiments
were constructed from WordNet noun synsets as
follows. Each synset positioned seven edges be-
low the top-most level formed a class by sub-
suming all its hyponym synsets. Then all classes
that contained less than 5 nouns were discarded.
Thus the BNC nouns formed 233 classes with
1807 unique nouns and the AP nouns formed 137
classes with 816 unique nouns. For both datasets,
presence of a noun in multiple classes was allowed.
The experiments were conducted using ten-
fold cross-validation. The nouns present in the
constructed classes were divided into a training
set and a test set. After that the ability of the cla s-
sifiers to recover the original class of a test noun
was tested. Their performance was evaluated in
terms of precision and in terms of learning accu-
racy (Hahn and Schattinger, 1998). The latter is a
measure designed specifically to evaluate the
quality of classifying instances into a hierarchy
of classes. It describes the semantic similarity
between the assigned class and the correct class
(Equation 2) averaged over all test instances.
4 Evaluation results
The experiments were conducted with
k =
1, 3,
5, 7, 10, 15, 20, 30, 50, 70 and 100. We first corn-
5
Available at http://vivvv
,.cs.cornell.edu/homeillee/datit/sim.html.
148
pared the following three versions of KNN. The
first was the one that determines the score for a
class by simply counting its members among the
nearest neighbors ("baseline"). The second was
the distance-weighted version of KNN: each
neighbor voted for its class or classes with a
weight proportional to its distributional similarity
to the test word ("distributional similarity weight-
ing"). The weight in the third version was deter-
mined according to Equation 3, whereby A
(c)
was just the number of votes for the class (i.e.,
without considering the distributional similarity
values, "semantic similarity weighting").
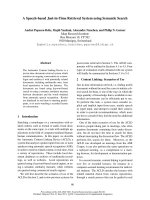
Figure 1 describes the precision demonstrated
by these three weighting possibilities on the BNC
data (for "semantic similarity weighting", the
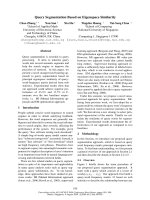
parameter 13 was tuned to 5). Figure 2 describes
the learning accuracy of these three versions of
KINN
(fi
was set to 1).
Table 1 compares them on the data of the two
corpora (the number in parentheses specifies the
k
for which the evaluation score was achieved).
BNC
AP
Baseline
P
0.197498
(7)
0.296187
(5)
LA
0.316951
(15)
0.406649
(7)
Dist.
Weight
P
0.222335
(20)
0.351345
(5)
LA
0.384695
(15)
0.489225
(5)
Sem.
Weight
P
0.207815
(7)
0.313185
(5)
LA
0.389333
(30)
0.455253
(15)
Table 1. Comparison of the 3 versions of KNN on the
BNC and AP datasets .
As seen from these results, both the distrib
u-
tional and semantic weighting schemas exhibit
better performance than the non-weighted ver-
sion of KNN. The semantic weighting schema
performs not as well as the distributional one in
terms of precision.
In
terms of learning accuracy,
however, it surpasses it at greater values of
k.
This
can be explained by the fact that one is more
likely to obtain valuable semantic information
about a class, when one estimates its relatedness
in the thesaurus to a bigger number of classes. At
a certain point, however, the increase of the num-
20nn
30nn
50nn
7Orr
100m
— Baseline
Dist.Weight
—
N
—
Sem.Weight
5nn
7m
10nn
15nn
0
0.
0,23
0,22
0,21
0,2
0,19
0,18
0,17
0,16
0,15
0,14
3nn
Figure 1. Performance of the 3 versions of KNN in terms of precision: (1) without weighting of neighbors ; (2)
with weighting by their distributional similarity to the test word and (3) with weighting by their semantic simi-
larity to each other.
Figure 2. Performance of the 3 versions of KNN in terms of Learning Accuracy.
149
ber of classes taken into account harms its per-
formance (see the decreasing curve for k>30,
Figure 2).
We thus saw that both distributional and
mantic weighting provide useful evidence about
the class for a new word. In the next step, we
tested their combination: in Equation 3, A (c)
was the sum of neighbors' votes, each weighted
by the distributional similarity of the neighbor to
the test word. Figure 3 compares the precision
and learning accuracy of the combined weighting
schema to the distributional weighting. Table 2
compares the best results of two schemas on the
data of the both corpora.
BNC
AP
Comb.
Weight
P
0.225762
(20)
0.359408
(5)
LA
0.420175
(15)
0.511683
(5)
Dist.
Weight
P
0.222335
(20)
0.351345
(5)
LA
0.384695
(15)
0.489225
(5)
Table 2. The comparison of the combined and the
distributional weighting schemas.
The combined weighting schema thus showed
relative improvement on the distributional one:
1.5% (BNC) and 2.3% (AP) in terms of precision
and 9.2% (BNC) and 4.5% (AP) in terms of
learning accuracy.
5 Conclusion
We have proposed a method to enlarge a the-
saurus, which takes advantage of the semantic
relatedness between top-scoring candidate classes
proposed by a classifier for each new word. Al-
though the method showed only marginal im-
provement on the standard distance-weighted
version of KNN (up to 2.3% of relative im-
provement), it definitively outperformed it in
terms of learning accuracy (up to 9.2% of relative
improvement).
References
E.Alfonseca and S.Manandhar. 2002. Extending a
Lexical Ontology by a Combination of Distribu-
tional Semantics Signatures.
Proceedings of
EKAW-2002:1-7.
A.Budanitsky and G.Hirst. 2001. Semantic distance in
WordNet: An experimental, application-oriented
evaluation of five measures. Proceedings of North
American Chapter of ACL Workshop on WordNet
and Other Lexical Resources.
U.Hahn and K.Schattinger. 1998. Towards text know-
ledge engineering.
Proceedings of AAAMAAI:524-
531.
B.Roark and E.Charniak. 1998. Noun-phrase co-
occurence statistics for semi-automatic semantic
lexicon construction.
Proceedings of COLING-ACL:
1110-1116.
E.Riloff and J.Sheppard. 1997. A corpus-based T-
proach for building semantic lexicons.
Proceed-
ings of EMNLP:127-132.
0,45
0,4
ec 0,35
E
m
c.)
0
'
I
0,3
—lc—
LA, Dist.Weight
—X— P, Dist.Weight
cs)
'
c
.E
co
3
0,25
—0— LA,Comb.Weight
—.—
P, Comb.Weicht
■■
0,2
0,15
inn
3nn
5nn
7nn
10nn
15nn
20nn
30nn
50nn
.
70nn
100nn
Figure 3. The comparison of the distributional and the combined weighting schemas.
150