Overview of Indian Paper Industry ppt
Bạn đang xem bản rút gọn của tài liệu. Xem và tải ngay bản đầy đủ của tài liệu tại đây (815.31 KB, 48 trang )
Presented by
Dr. R.M.Mathur
CPPRI
Central Pulp & Paper Research Institute
Saharanpur, U.P., INDIA
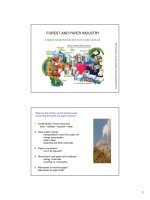
Overview of
Indian Paper Industry
1
PAPER INDUSTRY AT A GLANCE
¾Total number of Pulp & Paper Mills 666
Wood Based 34
Agro Based 165
Recycled Fiber Based Mills 467
¾Pulp & Paper Mills in Operation 568
¾Pulp & Paper Mills Closed 98
¾Installed Capacity of Mills 9.5
million tonnes
¾Per-capita consumption 7.0 kg
(Paper & Paperboard)
¾Production 6.5 million tonnes – P&B
0.9 million tonnes - Newsprint
¾Turnover Rs. 16000 crore
¾Exchequer Rs. 2500 crore
¾Employment Direct-3 Lakh / Indirect-10 Lakh
The industry is fragmented with capacities ranging from 2 to 800 tonnes per day
2
GROWTH OF PAPER INDUSTRY … Contd…
Paper capacity and production in India 1950-2006
0
2
4
6
8
10
1950 1960 1970 1980 1990 2000 2005 2006
Million Tonnes
Capacity Production
Nearly 1. 25million tones of capacity is closed
¾ Technological obsolescence
¾ Environmental issues
Reasons for Closed Capacities
Nearly 194 mills under the purview of the Board of Industrial
and Financial Reconstruction (BIFR) and nearly 60 mills
(with a capacity of 1,25 million tonnes is closed).
With the implementation of ECF norms expected to involve
higher cash outlays, the viability of smaller plants is an area
of concern.
High level of sickness in the industry
4
STRUCTURE OF PAPER INDUSTRY
34
165
467
0
100
200
300
400
500
Wood Based
Mills
Non Wood
Based Mills
RCF Based Mills
Categorization of the Mills Based on Cellulosic
Raw Materials
Number of Mills
5
Structure of Paper Industry
Paper
Copier Coated Kraft DuplexMaplitho Creamwove
Newsprint
Paper & paper
Board
Writing & printing paper
Industrial Paper
Grey and
white
board
and MG
poster
6
Percent Share of products
Indian Paper
Industry
6.5 Million Tonnes
Speciality Paper
(4%)
Coated
(18.47%)
Kraft
(54.02%)
Duplex
(28.26%)
Others
(17.72%)
Creamw
ove
(55.0%)
Maplith
o(inclb
copier)
(26.53%)
Industrial Paper
(58.1%)
Writing Printing
paper
(37.9%)
7
Fiber Resources and their Availability
Fiber
Resource
Sources of Resources Production
Million
Tonnes
Proportion
in
Production
(%)
No. of
Mills
Proportion
of Mills (%)
Wood Eucalyptus, Coniferous and
other broad leaves
2.08 32.0 34.0 5.1
Agri residues Bagasse, rice and wheat
straw, cotton stalks, etc.
1.95 30.0 165.0 24.7
Waste paper Domestic and imported waste 2.41 38.0 467.0 70.2
Source: Federation of Paper Traders Association of India
8
PER CAPITA CONSUMPTION
While India accounts for nearly 15 per cent of the world population, it consumes
only 1 per cent of the world paper production. India.s per capita consumption of
paper at about 7kgs is very low as compared to the world average of 50 kgs.
Consumption Per Kgs
324
202
98
32
29
24 24
6
0
50
100
150
200
250
300
350
US
A
E
U
Ma
l
a
y
sia
Th
a
ila
n
d
China
In
d
o
n
e
s
ia
A
sia
I
n
d
ia
Kgs.
7
DEMAND & SUPPLY SCENARIO
10
Paper Industry to witness firm Demand
¾ Demand for paper industry is closely linked to the economic
growth of a country.
¾ The paper industry has grown at a steady 6.0 per cent over the last
few years and it is expected to grow by 6.6 per cent over the next
2-3 years.
¾ The increase in demand will stem from faster growing varieties of
paper -coated paper, copier paper and duplex boards.
¾ Capacities to the tune of 1.5 million tonnes (20 %of current
capacity) will come on-stream over the next 3 years. This will result
in a decline in operating rates over the next 2-3 years till the
additional supply is absorbed by the incremental demand.
¾ Although input costs are expected to increase over the next few
years, the rise in price of paper will not be steep due to an
improvement in plant efficiency due to the the modernisation being
carried out by mil
ls.
11
Paper- Variety wise demand forecast
2004-05 2005-06 2006-07 (E) 2007-08 (E) 2008-
09(E)
2009-10
(E)
CAGR(%)
Writing and printing paper 2181 2307 2441 2583 2727 2880 5.7
Uncoated paper 1887 1987 2091 2202 2311 2428 5.2
Craemwove 1185 1235 1288 1344 1398 1455 4.2
Maplitho (incl unbranded copier) 575 605 634 665 698 734 5.0
Branded copier 127 147 169 192 215 239 13.5
Coated Paper 294 321 350 381 415 452 9.0
Coated crome paper 114 123 133 143 154 166 7.9
Art paper 101 113 127 142 159 177 11.9
Art boards 80 85 90 96 102 109 6.4
Industrial Paper 3370 3589 3821 4068 4331 4615 6.5
Kraft 1833 1964 2102 2249 2406 2574 7.0
Duplex (incl. Coated and uncoated) 963 1037 1115 1201 1294 1395 7.7
Grey and white board 274 284 294 304 315 326 3.5
MG poster 299 305 310 313 317 320 1.3
Speciality 239 257 277 298 321 346 7.7
Total of above 5790 6154 6539 6949 7379 7840 6.3
Newsprint 1347 1491 1623 1792 1902 2000 8.2
Total 7137 7645 8162 8741 9281 9840 6.6
Thousand tonnes
12
RECYCLED FIBRE - RECOVERY & RECYCLING
Million tons
0
2
4
6
8
1995 2000 2005 2010
Recovery Imports Consumption
¾ Import of waste paper is continuously increasing
¾ At present more than 80% of consumption is met through imports.
COSTS AND PRICES
14
Cost Structure
The main costs for a paper manufacturer are raw materials and energy.
These two account for nearly 60-70 percent of net sales.
Raw materail
cost
27%
Power & fuel
20%
Personnel cost
11%
Overheads
32%
Chemicals
10%
15
Indicative Cost Structures
Indicative cost structure per tonne of paper
(Rs.)
Rs. / tonne Percent of total
cost
Raw material
Wood & bamboo/ Mixed Waste and Market BKP 5000 27
Stores Chemical and spares
Sodium sulphate 320 2
Lime 800 4
Chlorine 700 4
Fuel
Coal for boilers 3750 20
11637 57
Personnel costs 1800 11
Overheads 5,500 32
Total costs 18937 100
16
Energy Usage Pattern in a mill
Power consumption (%) Steam consumed (%) Potential
Large mills Small mills Large mills Small mills savings in
power
Chipping 4 6 - - 25
Pulping 22 29 21 11
Stock making 18 25 - 58 12
Recycling chemicals 16 - 44 - 33
Paper making 40 40 35 42 40
Note
In India, only 55-58 per cent of energy is used and the balance (42-45 per cent) is wasted.
However, international plants use 76-78 per cent of energy and waste only 22-24 per cent.
Source: CRIS INFAC, Industry
17
Energy usage pattern: International vs Indian Paper Mills
Source: CPPRI
n.a : Not applicable
Steam t/t Electricity Kwh/t
International Indian International Indian
Chip conveying - 20 20
Digestor 0.61 40 40
Washing and screening - 1.30 30 110
Oxygen delignification 0.18 75 n.a
Bleaching 0.83 0.30 100 80
Paper machine 1.50 2.50 253 600
Soda recovery 1.50 2.60 55 125
Power plant 0.83 1.20 60 125
Kiln & recausticising n.a n.a 25 n.a
Hot water Supply n.a n.a 32 50
Wastepaper treatment n.a n.a 30 40
Miscellaneous/unaccounted/loss
es
0.00 1.10 30 110
Total consumption 5.45 9.00 750 1300
Bleached varieties
INDIAN PAPER INDUSTRY IN GLOBAL
PERSPECTIVES
19
0 20000 40000 60000 80000 100000 120000
Venezuela
Chile
Colambia
Argentina
South Africa
Australia
Thailand
Mexico
India
Taiwan
United Kingdom
Rus sia
Br azil
Indonesia
Sweeden
Kore a
France
Finland
Germany
Canada
Japan
China
US
Paper & Board Capacity (2000)
‘000 tonnes
India is among the top fifteen global producers
Source : ICRA report to IPMA : 2000
INDIAN PAPER INDUSTRY IN GLOBAL PERSPECTIVES
INDIA
PERCENTAGE OF WORLD PAPER PRODUCTION
¾ World Paper & Board consumption is dominated by three major regional
blocks- North America, Western Europe & Asia.
¾ The Paper & Board and Newsprint production in India is nearly 7.5 million
tons as against world paper production of 340 million tons.
North
A
meric a,
31.0%
Rest, 9.0%
Eur ope,
28.0%
India,
1.6%
Asia, 30.4%
Indian Paper Industry in Global Perspectives… Contd…
21
CONSUMPTION OF BASIC INPUTS
Indian Paper Industry in Global Perspectives… Contd…
Input Norms
(per tonne basis)
Mills in India
(
Wood Based)
Mills Abroad
Raw material, tonnes 2.0- 2.4 1.8-2.0
Energy, GJ 23-37 18-22
Water, m3 120-200 20-60
Chemical Recovery,% 85-95 95-98
Manpower, no. 14-20 5-7
Technical manpower, no. 2 4
Fibre Recovery, % 15 40
22
COMPETITIVENESS OF THE SECTOR
¾ As compared to USA, Europe, the paper industry in India is far
below the quality standards of the products.
¾ It is not as competitive as in other Asian countries such as ; Japan,
Indonesia, Thailand, Malaysia & China.
¾ The paper industry in India is less competitive as compared to
similar sectors such as; cement and capital goods.
¾ The possible reasons which makes paper industry less competitive
compared to other similar sectors are –
(i) Availability of good fibrous raw materials;
(ii) Level of technology.
23
Raw Material Sourcing
Rational long term policy on
Duties and Taxes
Technology Up-gradation
Scheme
Policy for Industrial
Plantation
Technology Up gradation &
Restructuring
Product Focus
Implication of WTO
Capacity Expansion
Environmental Policy
Rational pricing policy for
Power & water
IMPROVING
RETURN/MARGINS
INDUSTRY
GOVERNMENT
STRATEGIES FOR IMPROVING COMPETITIVENESS
Environmental Credentials
Technology – Status and
Upgradation