Nothing But Net 2009 Internet Investment Guide potx
Bạn đang xem bản rút gọn của tài liệu. Xem và tải ngay bản đầy đủ của tài liệu tại đây (1.81 MB, 340 trang )
Global Equity Research
05 January 2009
Nothing But Net
2009 Internet Investment Guide
Global Internet
Imran Khan
AC
(1-212) 622-6693
J.P. Morgan Securities Inc.
Bridget Weishaar
(1-212) 622-5032
J.P. Morgan Securities Inc.
Lev Polinsky, CFA
(1-212) 622-8343
J.P. Morgan Securities Inc.
Vasily Karasyov
AC
(1-212) 622-5401
J.P. Morgan Securities Inc.
China Internet
Dick Wei
AC
(852) 2800-8535
J.P. Morgan Securities (Asia Pacific) Limited
Russia Internet
Elena Bazhenova
AC
(7-495) 937-7314
J.P. Morgan Bank International LLC
Korea Internet
Angela Hong
AC
(82-2) 758-5719
J.P. Morgan Securities (Far East) Limited
See page 332 for analyst certification and important disclosures, including non-US analyst disclosures.
J.P. Morgan does and seeks to do business with companies covered in its research reports. As a result, investors should be aware that the firm may
have a conflict of interest that could affect the objectivity of this report. Investors should consider this report as only a single factor in making their
investment decision. Customers of J.P. Morgan in the United States can receive independent, third-party research on the company or companies
covered in this report, at no cost to them, where such research is available. Customers can access this independent research at
www.morganmarkets.com or can call 1-800-477-0406 toll free to request a copy of this research.
Please see our separate notes out today
changing ratings for Amazon and Dice
Holdings. We also have a separate note
out today changing estimates and
introducing 2009 price targets for the
remainder of our Internet coverage. All
data and valuation priced as of 30
December 2008.
2
Global Equity Research
05 Januar
y
2009
Imran Khan
(1-212) 622-6693
Table of Contents
Key Investment Themes 5
Dot.Khan’s Top Ten Things to Watch for in 2009 15
U.S. Sector Outloooks 17
Search Advertising Outlook 19
Graphical Advertising Outlook 25
Ad Networks on the Rise 29
Ad Exchanges: A New Marketplace 37
eCommerce Outlook 40
Online Travel Outlook 47
The Mobile Market 53
Online Payment Outlook 62
Social Networks Primer 70
Online Music Primer 78
The Challenges for Online Video 81
Widgets: Popularity Is Growing, but Can It Be Monetized?83
Online Photo Market Outlook 86
Cloud Computing Outlook 90
Virtual Online Worlds Primer 95
Internet for Social Good 100
International Sector Outlooks 103
China Internet Market Overview 105
Russia Sector Outlook 140
Korean Internet Outlook 150
U.S. Company Previews 155
Amazon.com, Overweight, ($50.76) 157
Blue Nile, Inc., Underweight, ($23.67) 166
Dice Holdings, Neutral, ($4.11) 174
eBay, Neutral, ($13.96) 181
Expedia, Overweight, ($7.80) 191
Google, Overweight, ($303.11) 198
IAC, Neutral, ($15.77) 205
MercadoLibre, Overweight, ($15.69) 213
Omniture, Overweight, ($9.85) 222
Orbitz Worldwide, Neutral, ($3.65) 229
3
Global Equity Research
05 Januar
y
2009
Imran Khan
(1-212) 622-6693
Priceline, Overweight, ($70.82) 235
RealNetworks, Inc, Neutral, ($3.55) 243
Shutterfly, Inc., Overweight ($6.75) 249
ValueClick, Neutral, ($6.56) 257
Yahoo!, Overweight, ($11.97) 264
International Company Outlooks 273
Baidu, Overweight, ($126.93) 275
China Finance Online, Neutral, ($7.05) 282
NetEase, Neutral, ($22.10) 289
Ninetowns, Neutral, ($0.83) 295
Shanda, Overweight, ($30.75) 300
Sina, Overweight, ($22.89) 306
Sohu, Overweight, ($46.22) 312
The9, Overweight, ($13.68) 318
UOL, Neutral, R$7.3 324
Note: ValueClick is covered by U.S. Advertising & Marketing Services analyst Townsend Buckles. UOL is covered by
Latin American Media & Internet analyst Andre Baggio. RealNetworks is covered by Vasily Karasyov.
The authors acknowledge the contribution of Jigar Vakharia of J.P. Morgan Services
India Private Ltd., Mumbai, and Shelby Taffer, of J.P. Morgan Securities, Inc., to
this report.
4
Global Equity Research
05 Januar
y
2009
Imran Khan
(1-212) 622-6693
Figure 1: J.P. Morgan Internet Technology Universe
$ in millions, except per share data
Ticker Rating
Price Mkt Cap Ent .Val. EPS Y/Y EPS Growth Cal PE PEG EBITDA ($M) Y/Y EBITDA Growth Ent. Val/EBITDA Rev ($M) Y/Y Revenue Growth
12/30 12/30 12/30 2008E 2009E 2010E '07/'08E '08/09E 09/10E 2008E 2009E 2010E 2008E 2009E 2010E 2008E 2009E 2010E '07/'08E '08/09E '09/10E 2008E 2009E 2010E 2008E 2009E 2010E '07/'08E '08/09E '09/10E
Search/Advertising
Google GOOG OW 303.11 96,321 83,789 19.23 21.16 25.26 23% 10% 19% 15.8 14.3 12.0 0.5 0.4 0.3 9,142 10,210 12,278 32% 12% 20% 9.2 8.2 6.8 15,689 17,597 21,762 35% 12% 24%
Yahoo* YHOO OW 11.97 16,729 7,857 0.63 0.33 0.32 34% -48% -3% 18.9 36.3 37.6 0.8 1.5 1.5 1,779 1,847 1,901 -8% 4% 3% 4.4 4.3 4.1 5,422 5,400 5,877 6% 0% 9%
Group Average 17.3 25.3 24.8 0.6 0.9 0.9 12% 8% 12% 6.8 6.2 5.5 20% 6% 16%
Leading e-Commerce brands
Amazon AMZN OW 50.76 22,131 20,627 1.32 1.20 1.54 18% -9% 28% 38.4 42.4 33.1 1.9 2.1 1.7 1,398 1,419 1,734 28% 2% 22% 14.8 14.5 11.9 18,711 21,694 26,165 26% 16% 21%
Blue Nile NILE UW 23.67 360 333 0.94 0.76 0.95 -10% -19% 25% 25.3 31.2 24.9 1.3 1.6 1.2 29 26 34 -4% -10% 30% 11.6 12.9 9.9 310 293 323 -3% -6% 10%
Dice DHX N 4.11 271 302 0.35 0.28 0.29 34% -20% 2% 11.7 14.5 14.2 0.6 0.7 0.7 67 64 68 7% -5% 6% 4.5 4.7 4.5 156 147 154 9% -6% 5%
eBay EBAY N 13.96 17,994 13,812 1.35 1.39 1.57 NA 3% 13% 10.4 10.1 8.9 0.4 0.4 0.4 3,101 3,202 3,470 7% 3% 8% 4.5 4.3 4.0 8,690 9,572 10,770 13% 10% 13%
Expedia EXPE OW 7.80 2,275 2,753 1.30 1.26 1.40 6% -3% 11% 6.0 6.2 5.6 0.6 0.6 0.6 781 756 883 7% -3% 17% 3.5 3.6 3.1 2,964 2,919 3,288 11% -2% 13%
InterActive Corp IACI N 15.77 2,209 842 0.34 1.02 1.10 NA NA 7% 46.7 15.4 14.4 4.7 1.5 1.4 176 234 258 25% 33% 10% 4.8 3.6 3.3 1,476 1,548 1,687 11%5%9%
Mercadolibre MELI OW 15.69 695 632 0.36 0.54 0.75 65% 50% 38% 43.4 28.9 21.0 1.4
1.0 0.7 40 50 69 70% 27% 36% 15.9 12.5 9.2 138 164 219 62% 19% 34%
Orbitz Worldwide OWW N 3.65 304 304 (3.63) (0.27) (0.30) NA NA 9% NM NM NM NM NM NM 145 136 143 -1% -6% 5% 2.1 2.2 2.1 895 865 922 6% -3% 7%
Priceline.com PCLN OW 70.82 3,460 3,005 5.79 5.64 7.40 43% -3% 31% 12.2 12.6 9.6 0.8 0.8 0.6 365 336 439 60% -8% 30% 8.2 8.9 6.9 1,851 1,837 2,081 33% -1% 13%
Real Networks RNWK N 3.55 504 98 (0.05) 0.02 0.02 NA NA 39% NM NM NM NM NM NM 58 71 72 1% 21% 2% 1.7 1.4 1.4 607 595 609 7% -2% 2%
Shutterfly SFLY OW 6.75 169 129 0.30 0.43 0.64 -38% 42% 48% 22.3 15.7 10.6 1.1 0.8 0.5 33 49 62 1% 49% 26% 3.9 2.6 2.1 209 224 266 12% 8% 19%
Group Average 24.0 19.7 15.8 1.4 1.1 0.9 18% 9% 18% 6.9 6.5 5.3 17% 4% 13%
Enabling Platforms
Akamai^ AKAM NR 14.46 2,589 2,344 1.61 1.71 1.87 7% 9% 0% 8.4 7.7 7.7 0.3 0.3 0.3 364 409 420 12% 12% 0% 5.7 5.1 5.1 784 882 975 25% 13% 11%
Omniture OMTR OW 9.85 752 773 0.42 0.61 0.77 NM 44% 26% NM 16.2 12.8 NM 0.5 0.4 59 77 98 164% 31% 26% 13.1 10.0 7.9 296 410 511 107% 38% 25%
Salesforce.com^ CRM NR 30.96 3,724 3,194 0.32 0.52 0.85 69% 50% 0% 59.6 39.7 39.7 1.5 1.0 1.0 159 229 218 31% 44% -5% 24.3 13.9 14.7 1,083 1,350 1,591 46% 25% 18%
Websense^ WBSN NR 14.27 646 720 1.36 1.41 1.52 3% 10% 0% 10.2 NA NA 0.7 NA NA 138 124 130 126% -10% 5% 5.2 5.8 5.5 346 354
371 51% 2% 5%
Group Average 26.1 21.2 20.1 0.8 0.6 0.6 83% 19% 7% 12.1 8.7 8.3 57% 19% 14%
J.P. Morgan Internet Technology Universe
Source: Company reports and J.P. Morgan estimates for J.P. Morgan rated companies; Factset/First Call estimates used for non-covered companies. EBITDA = Operating Income + D&A +/- extraordinary charges
Data in this table and this report is priced as of December 30, 2008 close
5
Global Equity Research
05 Januar
y
2009
Imran Khan
(1-212) 622-6693
Key Investment Themes
Macroeconomic Conditions Will Likely Dominate
Performance
2008 was an extraordinary year, as the fallout from the mortgage business nearly
crippled U.S. financial systems. The financial sector underwent a massive
restructuring, with Lehman Brothers filing for bankruptcy, the government seizing
control of Fannie Mae and Freddie Mac, the government bailing out AIG, Goldman
Sachs and Morgan Stanley reorganizing as bank holding companies, and Bear
Stearns, Merrill Lynch, Wachovia, and WaMu, among others, ceasing to operate as
independent entities. Financial sector instability and mark-to-market losses almost
froze the credit market, leading to cash flow problems for both businesses and
consumers. A Zillow.com report estimates that American homeowners will
collectively lose more than $2 trillion in home value by the end of 2008. Meanwhile,
the U.S. auto industry sits on the verge of bankruptcy without a government bailout.
All of these events significantly impacted the overall economy, and we are facing the
worst recession since the ’70s.
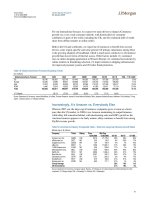
The Internet industry is not immune from this recession. We expect significant
revenue growth deceleration (in some cases negative growth) for Internet companies
in 2009. However, we continue to see strong long-term fundamentals with worldwide
Internet penetration continuing to rise, newspaper and magazine businesses
continuing to lose ad spend market share, and consumer dependence on mobile and
Internet devices rising. We believe 4Q’08 and 1Q’09 will be the toughest financial
quarters for Internet companies, as we expect limited credit availability, weaker
foreign exchange currency rates, low consumer confidence, increased
unemployment, and cautious corporate expense control to plague companies.
However, we expect to see the economy stabilize in 2Q and modestly improve in
2H’09. The J.P. Morgan economic forecast calls for (1.6)% Y/Y Real GDP growth in
F’09, with 2H growth accelerating to (1.0)% Y/Y.
6
Global Equity Research
05 Januar
y
2009
Imran Khan
(1-212) 622-6693
Newspaper Market Share Losses Should Accelerate
Although we think all advertising mediums will suffer in this economic recession, we
expect the environment to have a more adverse impact on newspaper ad revenue.
Figure 2: Newspaper Ad Spend Continues to Decline
$ in billions
46.2
48.2
49.4 49.3
37.2
45.4
-18%
-8%
0%
2%
5%
5%
0.0
10.0
20.0
30.0
40.0
50.0
60.0
2003 2004 2005 2006 2007 2008
-20%
-15%
-10%
-5%
0%
5%
10%
Newspaper Ad Spend Y/Y Growth
Source: NAA.org, J.P. Morgan estimates
In our opinion, newspapers face a significant number of headwinds that will likely
contribute to this decline. First, we believe consumer news consumption behavior is
changing. Magazines and newspapers usually have a significant lag time between the
news occurrence and its publication, as the process of writing, printing, and
distribution is complex. Therefore, instead of reading newspapers, consumers are
becoming more dependent on the Internet for breaking news.
Secondly, we think newspapers have failed to manage their cost structure. In our
view, they try to be the source for all news, and we think this model is unsustainable.
We think recent layoffs will hinder newspapers from broadly covering all news and
will thus make them even more irrelevant to the hyper-local or vertical-specific blogs
and postings on the Internet. Instead, we think newspapers need to allocate more
resources to investigative journalism. This would enable newspaper companies to
provide exclusive content and more in-depth opinions that could be difficult to glean
from citizen journalists.
Finally, blogs have existed long enough that they are becoming mainstream, with
some bloggers making their living off the blogs. As a result, we think some bloggers
and publications have become as trusted a news source and opinion provider as
traditional media. Thus, we think that when the economy recovers, newspaper dollar
losses will go to the Internet.
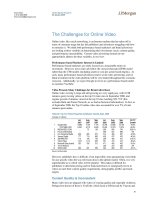
Long-term Secular Trends Remain Positive
Although the economic news cycle is largely negative, we believe the longer-term
secular trends that are driving the growth of online activity remain quite positive, and
we expect these trends to help Internet companies continue growing even as overall
economic activity remains sluggish.
7
Global Equity Research
05 Januar
y
2009
Imran Khan
(1-212) 622-6693
In particular, we see growing broadband penetration as a catalyst for more robust
commercial Internet activity. As such, we believe the continuing increase in
broadband uptake, as well as increases in connection speeds, provide a tailwind for
growth at Internet companies.
Figure 3: Broadband Penetration in the US Continues to Increase
Broadband subs in millions
6.2 12.4 19.2
27.7
37.4
48.0
58.1
69.9
78.9
55%
45%
35%
20%
13%
21%
29%
100%
0
20
40
60
80
100
2000 2001 2002 2003 2004 2005 2006 2007 2008E
0%
20%
40%
60%
80%
100%
US Broadband Subs Y/Y Growth
Source: OECD, J.P. Morgan estimates
More specifically to eCommerce, we believe the growth of online retail is closely
related to increasing broadband penetration; the growth trajectories have closely
paralleled each other over the past several years.
Figure 4: eCommerce Growth Parallels Increased Broadband Penetration
Units as indicated
0
10000
20000
30000
1H'02 2H'02 1H'03 2H'03 1H'04 2H'04 1H'05 2H'05 1H'06 2H'06 1H'07 2H'07 1H'08
0%
5%
10%
15%
20%
25%
30%
eCommerce, $M Broadband Penetration, %
Source: Department of Commerce, OECD, J.P. Morgan estimates
Note: OECD data defines penetration as Broadband subscriptions per 100 people
As such, we think continued increases in broadband penetration will be a catalyst for
eCommerce continuing to take share away from overall retail sales going forward,
providing opportunities for growth even if retail sales as a whole stagnate.
The Internet Is More and More a Performance-driven Model
Over the last five years, performance-based advertising has gained market share over
the CPM-based model. This trend is most clearly seen in the U.K., where the online
ad market is more mature (~15% of ad dollars are spent online compared to only
~8% in the U.S.). In the U.K. market, we think roughly 85% of total online ad dollars
are spent on the performance-based model.
8
Global Equity Research
05 Januar
y
2009
Imran Khan
(1-212) 622-6693
Figure 5: Performance-based Ad Spend Growth Has Outpaced Non-performance Based Ad
Growth
$ in millions
0
5000
10000
15000
20000
25000
30000
2003 2004 2005 2006 2007
Global Performance Based Ad Market Global Non-Performance Based Ad Market
Source: J.P. Morgan Estimates, Company Reports, ComScore, Nielsen Net Ratings, IDC, IWS, IAB
We think this trend will not only continue but accelerate in this recessionary
environment. We have seen advertisers place higher value on clear ROIs. As such,
we believe the shift to performance-based models is only going to accelerate. In
2009, we think the display advertising market will be very tough and faced with
declining CPMs. Search will likely still be a winner.
The Online Video Strategy Does Not Appear to Be Working
Although online video usage is a large and rapidly growing medium, no suitable
advertising platform has been developed, in our view. Performance-based marketers
who are primarily focused on a measurable return on investment have likely been
alienated by the cost-per-thousand (CPM) model rather than the CTR models
(including cost-per-click or cost-per-action based display). Even brand advertisers
have been mostly unattracted to this platform. We think this is due to the inability to
guarantee viewership for any specific video the way television does in the upfront
model. Often, it is very unpredictable as to which video will be popular.
Furthermore, content quality is inconsistent with many video sites plagued with
videos of varying quality and copyright violations. As a result, we do not see a highly
profitable advertising model solution for online video publishers in the near term.
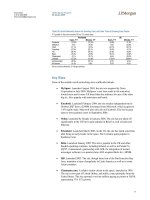
Brick & Mortar Retail Bankruptcies Could Boost
eCommerce
A variety of brick-and-mortar retailers have entered bankruptcy in recent months,
and protracted weakness in consumer spending could threaten more operators. We
believe such a trend would have two divergent impacts on eCommerce, in the near
and longer term.
• Near term, we expect B&M bankruptcies and especially store closings to
lead to pricing pressure, and thus margins pressure on the survivors in both
online and offline retail.
• In the medium to long term, we think thinning the B&M herd could prove
to be a positive for online retailers, which could find it easier to win and
maintain wallet share in a marketplace with fewer competitors.
9
Global Equity Research
05 Januar
y
2009
Imran Khan
(1-212) 622-6693
We think one significant winner is likely to be Amazon, which stands to gain from
the decline of players in both its core media arena (given the difficulties for Borders)
and in its growing electronics business (Circuit City et al.)
Table 1: Notable Retail Bankruptcies, F’07 – F’08
units as indicated
Company name Product line(s) # stores # stores closing Bankruptcy filing date
Advantage Rent-A-Car Inc Car Rental 86 35 8-Dec-08
Boscov's Department Stores Department Store 50 10 4-Aug-08
Circuit City Electronics 775 155 10-Nov-08
Friedman's Inc Jewelry 473 455 4-Apr-08
Goody’s Apparel 355 69 9-Jun-08
KB Toys Toys 460 120 11-Dec-08
Levitz Furniture Furniture 76 27-Oct-08
Lillian Vernon Direct Retailer 20-Feb-08
Linens ‘N Things Housewares 500 120 2-May-08
Mervyn’s Department Store 150 177 29-Jul-08
Movie Gallery Movie Rental 4600 520 17-Oct-07
Mrs. Fields Cookies Store 1200 15-Aug-08
Sharper Image Electronics 96 19-Feb-08
Shoe Pavilion Shoe 115 16-Jul-08
Steve & Barry’s Apparel 175 9-Jul-08
The Bombay Co. Furniture 388 15-Oct-07
Value City Furniture Furniture 100 27-Oct-08
Whitehall Jewelers Jewelry 375 23-Jun-08
Wickes Furniture Furniture 43 3-Feb-08
Source: Company reports, press reports, J.P. Morgan estimates
Note: # of stores closing as of the date of announcement of bankruptcy filing; more stores may have closed subsequently.
Net Neutrality Will Become a More Important Public Issue
Recently, the WSJ reported that Google is in discussions with telco and cable
companies to establish a potential alliance to ensure high speed delivery services for
Google content. Google responded by clarifying that the company remains a very
strong proponent of Net Neutrality and is simply looking to upgrade its network
through edge caching, which allows for the temporary storage of frequently accessed
data on local servers. Edge caching is a common practice used by ISPs and
application and content providers in order to improve the end user experience. The
WSJ article also reported that Microsoft and Yahoo! have quietly removed
themselves from the Net Neutrality alliances.
We think the Net Neutrality debate will move more to the forefront of mainstream
discussions in 2009. In our opinion, Net Neutrality is essential for the Internet
industry and the openness it offers.
• Consumers want faster service. Our checks with industry insiders show that
speed is one of the most critical contributors of market share gain or loss. If
companies are able to sign exclusive partnerships with telcos and operators, it
will likely reduce competition. It will also make it difficult for early stage
companies to succeed, thus reducing the innovation that has fueled economic
growth and created hundreds of thousands of jobs over the last decade.
• Large companies already have a speed advantage over smaller companies.
For example, we think Google’s data center investments have given it a large
advantage over other search engines, which has led to market share gains. As
such, creating additional partnerships will likely only hurt small business
formation, which is very key to the success of the U.S. economy, in our opinion.
10
Global Equity Research
05 Januar
y
2009
Imran Khan
(1-212) 622-6693
• There is a risk larger companies will get preferential pricing. In a sense,
preferential pricing is not different than the issue that the oil industry faced in the
early 1900s. Using its large and growing volume of oil shipments, Standard Oil
negotiated an alliance with the railroads that gave it secret rebates and thereby
reduced its effective shipping costs to a level far below the rates charged to its
competitors. In 1911, the Supreme Court found Standard Oil Company of New
Jersey in violation of the Sherman Antitrust Act because of its excessive
restrictions on trade, particularly its practice of eliminating its competitors by
buying them out directly or driving them out of business by temporarily slashing
prices in a given region.
• We are sympathetic to the telco and cable companies’ overhead. We
recognize that they have to invest heavily in infrastructure to support Internet
access. However, we would prefer to see tiered pricing for broadband access over
differential treatment of Internet content.
Ultimately, we think it will be extremely negative for the industry as a whole if
Internet openness is not protected.
Social Networking Needs a New Monetization Approach
We do not believe social networks can drive sufficient revenue from an ad-based
model to grow profits. We do not expect broad adoption of advertising on social
networking sites by large advertisers, and we think that, to the extent advertising
takes hold on social networking sites, it will more frequently be in the form of
performance-driven ads than display.
We believe the near to medium term presents several significant challenges to the ad-
based revenue model for social networks that will prevent these sites from reaching
their valuation expectations:
• Ad spending forecast looks weak. In a weak ad market, with allocations
declining to a variety of existing media, we think adding another
experimental ad channel could prove difficult.
• Large advertisers may be put off by environment. We continue to
believe adoption could be particularly slow among traditional advertisers,
which may not want to advertise their brand alongside content they can’t
fully control.
• Advertising on social networks can be complicated. Successful
advertising on these sites involves more than just an incremental extension
of existing campaigns. Some advertisers end up pulling back after an initial
lack of success, while others are reluctant to add yet another wrinkle to their
marketing approach.
Given the above challenges, we think revenue at social networks will need to come
from sources other than display advertising. We see several possibilities, not all of
which can apply to each network:
• More performance-based advertising models, such as CPA ads or lead
generation;
11
Global Equity Research
05 Januar
y
2009
Imran Khan
(1-212) 622-6693
• Sales of virtual goods, which can further the depth of the user experience
on a social site;
• A model that exposes a site to the classifieds or eCommerce markets, both
of which are gaining market share from their offline counterparts; and
• Paid premium memberships or selling a la carte paid features (such as
the ability to post more or higher-quality photos).
Several sites are already pursuing a variety of these approaches (both LinkedIn and
Classmates, e.g., sell premium memberships). We expect much more
experimentation as the market continues to mature.
Mobile Is Long-term Interesting, but Near-term Challenging
With 84% of Americans using mobile phones (CTIA), we firmly believe the mobile
market is a promising opportunity. Given this level of reach and better mobile
Internet technologies and hardware, we think this medium is becoming attractive to
advertisers. As a result, Google, Yahoo!, and MSN are strategically focusing on
establishing market share in this industry.
Figure 6: Technology Penetration in the US (2008)
as labeled
0.00%
20.00%
40.00%
60.00%
80.00%
100.00%
PC Mobile Mobile Web
Subscribers
Mobile Internet Users
0
50
100
150
200
250
300
Usage (M) Penetration
Source: CIA Government Stats ( (Feb 2008); International
Telecommunications Union ( CIA Government Stats
( (Mar 2008) for Vietnam and Hong Kong mobile phone data, "OECD
Broadband Statistics to June 2007", OECD; www.point-topic.com; mybroadband.co.za; Hong Kong and India government statistics;
European Travel Commission; www.bezeq.co.il; Santiago Times newspaper; Nielsen Mobile data, JPMorgan Estimates
However, although mobile phone penetration is high, the mobile search market is in
the early adoption stage. In 1Q’08, only 15.6% of wireless subscribers were using
mobile Internet services, according to Nielsen Mobile data. Even within this small
subset of mobile Internet users, usage drastically trails that on PCs. Nielsen Online
reports that the PC Internet user visits more than 100 domains per month, whereas
mobile Internet users visit 6.4 individual websites per month, on average.
We think mobile Internet adoption will not accelerate until the introduction of better
phones and technologies. 3G networks perform up to 6x faster than prior mobile
Internet networks (Nielsen), which we think will greatly improve the user experience
and make it more comparable to that on a PC. Additionally, new phones such as the
iPhone have improved the size and resolution of the screens. However, we note that
12
Global Equity Research
05 Januar
y
2009
Imran Khan
(1-212) 622-6693
smart phone technology has not yet become the norm and uptake of mobile Internet
likely has a ways to go.
Additionally, we find it unlikely that advertisers will quickly be adopting mobile
advertising. In addition to not having the scale and reach of the Internet, mobile
advertising is difficult, as it involves dealing with multiple ad networks and mobile
service providers and creating ads that can be viewed on small screens. Furthermore,
we think advertisers will cut back on experimental models of ad spend in the face of
this economic recession.
M&A: Slow in 1H’09, but Could Pick Up in 2H
We believe M&A activity is likely to remain quite slow in the first half of the year as
companies and management teams try to understand the scope and length of the
economic downturn.
Further, we think sellers are likely to be resistant to sales at reduced valuations, and
may prefer stock transactions that expose them to upside in the event of an eventual
turnaround.
Additionally, we think companies are likely going to exercise caution in parting with
any cash on their balance sheets – whether for acquisitions or for share buybacks.
We have already seen some of this caution manifest itself this year, when the ten
largest companies in the Internet/media space (see table below) spent 66% of their
TTM Free Cash Flow on share buybacks (compared to the equivalent figure of 126%
a year ago.)
The companies remained relatively acquisitive, although two of the largest
acquisitions were originally announced in 1H’07 (News Corp.’s $5.1B cash payout
for Dow Jones and Google’s $3.2B cash payout for DoubleClick). Excluding those
deals, cash acquisitions would have been relatively flat Y/Y, at 28% of free cash
flow, in line with the equivalent figure a year ago.
Table 2: At Largest Internet and Media Companies, Buybacks Less Popular
$ in millions
FCF Cash Acquisitions Cash Buybacks
GOOG 4,707 72% 0%
YHOO 1,386 60% 22%
AMZN 970 45% 0%
EBAY 2,456 29% 102%
TWX 5,946 52% 14%
DIS 4,767 14% 93%
NWS 2,049 263% 40%
VIA 969 24% 175%
CBS 1,487 137% 3%
MSFT 15,654 19% 103%
Total (3Q’08 TTM) 40,390 49% 66%
Total - year ago (3Q’07 TTM) 38,853 28% 126%
Source: Company reports, J.P. Morgan estimates
We believe some deal activity is likely to recover by the second half of ’09, assuming
the environment stabilizes somewhat, and management teams feel more comfortable
with the outlook.
For CBS and MSFT, estimates
used in this section are from J.P.
Morgan analysts Michael Meltz,
CFA and John DiFucci,
respectively.
13
Global Equity Research
05 Januar
y
2009
Imran Khan
(1-212) 622-6693
To the extent acquirers are willing to part with cash, we expect them to have the
resources: large Internet and media companies continue to generate significant cash
flows. At the four large-cap Internet companies, we are modeling a significant
deceleration in Y/Y FCF growth for F’09: from 36% in F’08E, we expect only 12%
Y/Y FCF growth at the four largest Internet firms in our coverage. Including the
Media universe, the respective expectations are for 13% growth in ’08 and 5% in ’09.
Including Microsoft, J.P. Morgan estimates call for nearly $40B in FCF generated in
the broader Internet space.
Table 3: We Project $10B+ in FCF at Large Internet Companies
$ in millions
2007 2008E 2009E
GOOG 2,272 4,825 6,086
YHOO 1,352 1,699 1,056
AMZN 1,184 661 1038
EBAY 2,187 2,351 2,472
TWX 4,045 5,135 6,017
DIS* 3,832 3,868 3,588
NWS* 2,802 2,482 1,951
VIA 1,539 1,608 1,705
CBS 1,983 1,324 1,257
MSFT 19,652 15,528 14,831
Total 40,848 39,482 40,002
Y/Y Growth -3% 1%
All excluding MSFT 21,196 23,954 25,171
Y/Y Growth 13% 5%
Large-Cap Internet 6,994 9,537 10,652
Y/Y Growth 36% 12%
Source: Company reports and J.P. Morgan estimates.
Note: For Disney, News Corp., fiscal year data used rather than calendar year; MSFT CY’08 FCF impacted by a $3.1B cash tax
payment.
We continue to see three key factors as motivating factors for M&A activity:
• Traffic. Developing high-traffic sites is difficult, and larger companies are often
willing to pay for sites that have proven an ability to generate traffic.
• Technology. Companies that develop a technology that is difficult or
uneconomical to replicate are often targets for acquisitions; such companies may
also generate traffic but the technology is often a motivator for the buyer.
• Transactional. Companies with a proven track record of revenue and sales
generation can make attractive targets, as well; an example of a transactional-
focused acquisition is the 2007 purchase of Mezimedia by ValueClick.
We Think an IPO Market Recovery Is More Likely in 2010
The IPO market was virtually nonexistent through most of F’08, with Rackspace as
the lone significant deal in the Internet and Internet-related sector; compared to 13
such deals in F’07 (see chart below).
14
Global Equity Research
05 Januar
y
2009
Imran Khan
(1-212) 622-6693
Table 4: Internet and Related IPOs, F’07 and F’08
Units as indicated
Pricing Date Issuer Name Symbol Amt ($M) Mkt cap ($M) % mcap Offering Price Price, 12/30 Performance
06/26/07 Comscore Inc SCOR 101 457 22% 16.50 12.19 -26%
10/02/07 Constant Contact CTCT 123 433 28% 16.00 12.84 -20%
07/17/07 Dice Holdings Inc DHX 221 805 27% 13.00 4.11 -68%
03/21/07 Glu Mobile Inc GLUU 86 327 26% 11.50 0.39 -97%
11/16/07 Internet Brands Inc INET 48 334 14% 8.00 5.51 -31%
06/07/07 Limelight Networks Inc LLNW 276 1,192 23% 15.00 2.29 -85%
08/09/07 MercadoLibre Inc MELI 333 752 44% 18.00 15.69 -13%
07/19/07 Orbitz Worldwide Inc OWW 510 1,244 41% 15.00 3.65 -76%
07/25/07 Perfect World Co Ltd PWRD 217 894 24% 16.00 16.68 4%
02/15/07 Salary.com Inc SLRY 69 158 44% 10.50 2.11 -80%
05/16/07 TechTarget Inc TTGT 115 508 23% 13.00 3.90 -70%
02/08/07 U.S. Auto Parts Network Inc PRTS 115 298 39% 10.00 1.37 -86%
03/08/07 Xinhua Finance Media Ltd XFML 300 883 34% 13.00 0.55 -96%
08/07/08 Rackspace Hosting RAX 188 1,460 13% 12.50 5.59 -55%
Source: Company reports, FactSet, J.P. Morgan estimates
We think the market climate is unlikely to moderate significantly in the near term in
order for the IPO window to reopen soon. Given the lead time involved in most deal
activity, we think it is therefore more likely that it will not be until 2010 that the IPO
market starts to show signs of a recovery.
Our Top Picks
We think the significant declines in share prices in the stock market create
opportunities to buy the best positioned companies at a reasonable valuation. In our
coverage universe, we think Google (Price Target $430), Amazon (Price Target $65),
Priceline (Price Target $86), Baidu (lead analyst Dick Wei; Price Target $300), and
MercadoLibre (Price Target $24) are the best positioned global Internet companies
and offer the best risk/reward return for investors. Please see the appropriate
company sections for a detailed analysis of our thesis.
15
Global Equity Research
05 Januar
y
2009
Imran Khan
(1-212) 622-6693
Dot.Khan’s Top Ten Things to Watch for in
2009
1. Potential search deal likely between Yahoo! and Microsoft
2. Net Neutrality should become an important mainstream issue
3. Performance-driven advertising should continue to rise
4. Challenges in monetizing video advertising should persist
5. Mobile usage should continue its strong growth momentum, but mobile
advertising will likely be challenging this year
6. Amazon’s low pricing strategy should continue to bring value seeking
customers
7. Possible bankruptcies in brick-and-mortar retail should create opportunities
for eCommerce companies
8. CPMs should remain under pressure
9. Consolidation activities could potentially resume during 2H’09
10. Promotional activity in the OTA space should increase
16
Global Equity Research
05 Januar
y
2009
Imran Khan
(1-212) 622-6693
17
Global Equity Research
05 Januar
y
2009
Imran Khan
(1-212) 622-6693
U.S. Sector Outloooks
U.S. Sector Outlooks
18
Global Equity Research
05 Januar
y
2009
Imran Khan
(1-212) 622-6693
19
Global Equity Research
05 Januar
y
2009
Imran Khan
(1-212) 622-6693
2009 Search Advertising Outlook
As macroeconomic weakness bled into the advertising market, we reduced our
Search Advertising Market Forecast twice in 2008. We are now further revising our
most recently updated estimates (published 11/3/2008). We believe global paid
search revenues will reach $33.2B in 2009, down from the $39.6B expected in
Nothing but Net 2008. We think the search market growth rate will decelerate given
the following factors:
• Overall ad budget weakness;
• Moderation in keyword price inflation; and
• Possible decrease in the volume of highly monetizable searches.
However, in the long term, we think the search market industry will benefit from the
changes that result from this recession. We think the rate of adoption of performance-
based advertising over more traditional forms, especially newspapers, has recently
increased and that these shifts will be sticky. Furthermore, we think Internet users
will use search more for comparison shopping and that they will become more
comfortable responding to ads.
Global Search Expected to Grow 12% in F’09
On the back of 34% Y/Y growth in F’08, we forecast that global paid search
revenues will grow 12% in 2009. From a metrics standpoint, we believe query
volumes will grow 24% in F’09, while RPS will decline 9%. We anticipate a climb
in search usage as consumers become more price-conscious and engage in
comparison shopping; however, we think monetization will be pressured, as
decreased ad budgets will likely result in less bidding for keywords. We continue to
see personalized search and vertical search as hot topics. Beyond 2008, we expect the
global paid search market to grow at a 19% CAGR through 2011.
Table 5: J.P. Morgan’s Global Search Advertising Revenue Forecast
units as indicated
Global
2003 2004 2005 2006 2007 2008E 2009E 2010E 2011E
’08-’11E
CAGR
Internet Population (M) 710 820 924 1,020 1,113 1,205 1,295 1,380 1,471 6.9%
Queries / Month / User 17 22 29 36 44 53 60 68 74 12.1%
Number of Queries (M) 142,017 220,128 323,827 441,796 585,395 760,474 939,917 1,119,430 1,308,646 19.8%
RPS (per 1,000 searches) $19.04 $23.42 $28.17 $33.58 $37.58 $38.81 $35.28 $37.00 $37.65 -1.0%
% Coverage 35.3% 38.7% 41.7% 43.9% 44.5% 44.0% 43.8% 43.7% 43.8% -0.1%
% Clickthrough Rate 16.3% 17.3% 18.8% 20.6% 21.5% 22.0% 22.1% 22.2% 22.8% 1.1%
$ Revenue / Click $0.33 $0.35 $0.36 $0.37 $0.39 $0.40 $0.36 $0.38 $0.38 -2.0%
Global Search Forecast ($M) 2,704 5,156 9,121 14,835 21,999 29,511 33,158 41,417 49,277 18.6%
Y/Y Growth 123.4% 90.7% 76.9% 62.6% 48.3% 34.1% 12.4% 24.9% 19.0%
Source: J.P. Morgan estimates, company reports, comScore, Nielsen//NetRatings, IDC, IWS
US Search Expected to Grow 10% in F’09
We are now modeling 10% Y/Y growth in F’09, down significantly from 2008’s
23% growth rate. Broken down by metrics, we are modeling US query volume
growth of 19% Y/Y in 2009 (a minor deceleration from the 24% we observed in
20
Global Equity Research
05 Januar
y
2009
Imran Khan
(1-212) 622-6693
2008), driven by an increase in the number of searches conducted per user and a
slight increase of 2.5% in the domestic Internet population.
On the monetization front, we expect the domestic RPS to reach only $75.33 per
1000 searches in 2009, down from $81.59 in 2008 (a 7.7% decline). We expect this
RPS decline to be driven by decreases in advertisers’ budgets, which should lead to
lower keyword bids.
Table 6: J.P. Morgan’s US Search Advertising Revenue Forecast
Units as indicated
United States
2006 2007 2008E 2009E 2010E 2011E
08-'11E
CAGR
Internet Population (M) 203 211 217 222 227 231 2.2%
Queries / Month / User 47 57 68 79 90 100 13.5%
Number of Queries (M) 114,896 144,080 177,938 211,746 245,626 277,557 16.0%
RPS (per 1,000 searches) $74.86 $81.65 $81.59 $75.33 $81.84 $84.94 1.3%
% Coverage 62.8% 63.5% 62.0% 62.0% 62.0% 63.2% 0.6%
% Clickthrough Rate 26.2% 27.3% 28.0% 27.0% 27.5% 28.0% 0.0%
$ Revenue / Click $0.46 $0.47 $0.47 $0.45 $0.48 $0.48 0.7%
US Search Forecast ($M) 8,602 11,764 14,518 15,951 20,102 23,576 17.5%
Y/Y Growth 47.2% 36.8% 23.4% 9.9% 26.0% 17.3%
Source: J.P. Morgan estimates, Company reports, comScore, Nielsen//NetRatings, IDC, and IWS
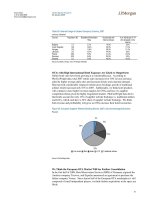
Our Proprietary Research Shows…
Market Share Shifts Are Likely to Continue
In November, the J.P. Morgan Internet Team surveyed 766 US residents to determine
Internet usage behavior. Our market research confirmed the trends reported by
comScore. Among survey participants, Google was the dominant search engine, with
59.0% of participants listing it as their most frequently used search engine, up from
54.6% in last year’s survey. Yahoo! remained second among participants, with
20.0% of participants using it most frequently, down from last year’s 21.8% market
share among our survey participants. MSN, Ask, and AOL trailed with 7.7%, 6.6%,
and 2.0% of participants using them most frequently, respectively.
Figure 7: Most Frequently Used Search Engine
% of participants
AOL, 6.6%
Ask, 2.0%
Google, 59.0%
MSN, 7.7%
Yahoo, 20.0%
Other, 3%
Don't Use / Don't
Know, 2%
Source: J.P. Morgan research
21
Global Equity Research
05 Januar
y
2009
Imran Khan
(1-212) 622-6693
Google Is Most Used by Young, High Income Participants
Although Google dominates all demographic levels, our survey found it had its
largest market share among those aged 18-41, and those with incomes over $100K.
The majority of Yahoo!, MSN and AOL users in our study fell into the over-42 age
group. MSN and AOL had their largest market shares among users with income
levels of $50K-$99K, while the market share for Yahoo! was highest among those
who earned $49K or less.
Table 7: Market Share by Age and Income Level
% of participants
Ages Incomes:
All 18-41 42+ $0-$49K $50-$99K $100K+
AOL 6.6% 4.8% 8.0% 5.9% 7.3% 6.9%
Ask 2.0% 2.5% 1.7% 2.5% 2.2% 0.0%
Google 59.0% 67.1% 52.2% 55.9% 60.4% 70.1%
MSN 7.7% 5.1% 9.5% 7.4% 7.7% 6.9%
Yahoo 20.0% 18.0% 22.7% 24.1% 17.6% 12.6%
Other 3.1% 2.2% 3.7% 3.2% 2.9% 2.3%
Don't Use/Don't Know 1.5% 0.3% 2.2% 1.0% 1.8% 1.1%
Source: J.P. Morgan research
62% of Respondents Would Be Willing to Consider Switching Search Engines
When asked what improvements by other search engines would cause them to switch
from their preferred brand, only 38% of respondents stated that nothing would cause
them to switch, as they were satisfied with their current search engine. This was
consistent with last year’s survey responses. Again, the most frequently selected
improvement was results that better matched the search term, with 45% of
respondents stating that this would cause them to switch search engines. Other
factors that would cause respondents to consider switching search engines were
faster response speeds to searches (28%), the user friendliness of the site (27%), and
the ability to preview web content (23%).
Table 8: Factors that Would Cause Search Engine Switching
% of participants
All AOL Ask Google MSN Yahoo Other
Results that better match my search
term
45.0% 42.0% 25.0% 48.6% 33.3% 43.3% 34.8%
Results that include video, web,
music and oother forms of
information
11.5% 12.0% 18.8% 11.5% 14.0% 9.6% 13.0%
A more uncluttered easy to navigate
site
26.5% 20.0% 31.3% 24.9% 36.8% 29.9% 17.4%
The ability to preview web content 22.6% 24.0% 25.0% 21.9% 22.8% 26.1% 8.7%
Faster response speed to searches 27.8% 36.0% 18.8% 25.8% 35.1% 29.3% 26.1%
Other 0.7% 0.0% 0.0% 0.7% 3.5% 0.0% 0.0%
Nothing, happy with current search
engine
38.2% 30.0% 31.3% 37.5% 38.6% 41.4% 52.2%
Source: J.P. Morgan research
The Int’l Search Market Is Now Larger than the US Market
We continue to believe the opportunities for paid search in the international
marketplace are even more significant than in the US. By our estimate, while the UK
is at par or ahead of the US market, the overall international paid search market is
still 3+ years behind the US in terms of development.
22
Global Equity Research
05 Januar
y
2009
Imran Khan
(1-212) 622-6693
The international market is now larger than the domestic market, reaching $15.0B in
F’08. As such, we believe the international markets will be a key growth driver in the
upcoming year. We think the largest driver will be query growth. While we expect
the US to experience query growth of 19% Y/Y, we believe international markets
will see a 25% Y/Y lift in the number of queries. However, offsetting these gains are
likely declines in foreign currency exchange rates. As such, we see international RPS
declines of 8% Y/Y in USD, which should mostly offset the higher query growth.
We are now modeling F’09 paid search revenue growth of 15% Y/Y to $17.2B.
Beyond 2008, we expect the international paid search market to grow at a 20%
CAGR through 2011.
Table 9: J.P. Morgan’s International Search Advertising Revenue Forecast
Units as indicated
International
2006 2007 2008E 2009E 2010E 2011E
08-'11E
CAGR
Internet Population (M) 817 903 988 1,072 1,153 1,239 7.8%
Queries / Month / User 33 41 49 57 63 69 12.2%
Number of Queries (M) 326,900 441,315 582,536 728,170 873,804 1,031,089 21.0%
RPS (per 1,000 searches) $19.07 $23.19 $25.74 $23.63 $24.39 $24.93 -1.1%
% Coverage 37.2% 38.3% 38.5% 38.5% 38.5% 38.6% 0.1%
% Clickthrough Rate 17.2% 18.4% 19.1% 19.8% 19.8% 20.5% 2.4%
$ Revenue / Click 0.30 0.33 0.35 0.31 0.32 0.32 -3.5%
Int'l Search Forecast ($M) 6,233 10,235 14,993 17,208 21,315 25,701 19.7%
Y/Y Growth 90.1% 64.2% 46.5% 14.8% 23.9% 20.6%
Source: J.P. Morgan estimates, Company reports, comScore, Nielsen//NetRatings, IDC, IWS
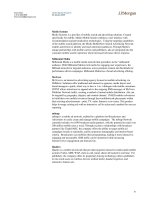
We Think Google Will Continue to Take Market Share
We estimate that Google has a 74% dollar market share currently (including revenues
from AOL, Ask, and other affiliates). We believe its share will continue to grow at an
accelerated pace in 2009 now that 1) the AOL and Ask TAC rates are locked in
under a new multiyear contract, 2) Yahoo! is comping its monetization gains from
Project Panama, and 3) we think advertisers are more likely to cut their spend with
the other search engines and stick with the leader in a recession. On a query volume
basis, we also expect Google to continue to excel in market share gains. 2008 saw
Microsoft attempt everything from creating contests to increase search volume to
actually paying users to purchase items through Microsoft search ads. Despite this,
Google’s US core search market share increased to 62.9% in September 2008 from
58.4% in December 2007.
23
Global Equity Research
05 Januar
y
2009
Imran Khan
(1-212) 622-6693
Figure 8: US Core Search Market Share,
September 2008
62.9%
20.2%
8.5%
4.1%
4.3%
Google Sites Yahoo! Sites
Microsoft Sites AOL LLC
Ask Network
Source: comScore and J.P. Morgan estimates
Figure 9: US Core Search Market Share,
December 2007
58.4%
22.9%
9.8%
4.6%
4.3%
Google Sites Yahoo! Sites
Microsoft Sites AOL LLC
Ask Network
Source: comScore and J.P. Morgan estimates
Search Advertising Likely to Be Winner in Macroeconomic
Aftermath
Although we acknowledge that all types of advertising, including search, will likely
be hit by advertising budget reductions in 2009, we think search advertising will be
the long-term winner in the reshuffling of budget allocations. We believe the weak
macroeconomic environment has forced advertisers to test performance-based search
advertising at an accelerated pace. Even after economic strength returns, we think
advertisers will stick with their new allocations based on better metrics and higher
measurable returns. Specifically, we see newspaper and radio advertisements
suffering the most from these budget shifts.
24
Global Equity Research
05 Januar
y
2009
Imran Khan
(1-212) 622-6693
Table 10: Percent Change in Measured US Ad Spending, 1H’08
MEDIA SECTOR % CHANGE
TELEVISION MEDIA -0.40%
· Network TV -2.40%
· Cable TV 3.10%
· Spot TV -4.40%
· Syndication - National 10.20%
· Spanish Language TV -0.10%
MAGAZINE MEDIA -1.80%
· Consumer Magazines -1.80%
· B-to-B Magazines -5.90%
· Local Magazines -2.80%
· Sunday Magazines 4.80%
· Spanish Language Magazines 7.10%
NEWSPAPER MEDIA -7.40%
· Local Newspapers -7.10%
· National Newspapers -9.50%
· Spanish Language Newspapers -11.00%
INTERNET (Display Advertising Only) 13.00%
RADIO MEDIA -6.50%
· Network Radio 3.40%
· National Spot Radio -7.40%
· Local Radio -7.50%
OUTDOOR 1.80%
FSIs 2.00%
TOTAL -1.60%
Source: TNS Media Intelligence and J.P. Morgan estimates
25
Global Equity Research
05 Januar
y
2009
Imran Khan
(1-212) 622-6693
2009 Graphical Advertising Outlook
2008 was a difficult year, as display advertising pricing (CPMs) was pressured not
only from a non-premium inventory glut but also from lower ad budgets spent on
premium slots. Unfortunately, we see these trends continuing into 2009. Specifically,
we think 2009 growth will be impacted by:
• Lower ad budgets given macroeconomic weakness and shifts towards
performance-based advertising;
• Continued pressure on non-premium inventory pricing as social networks and
other non-traditional sites struggle to find a monetization model that works;
• Difficult comps due to the 2008 Olympics and political campaigns; and
• Continued trouble finding an appropriate way to monetize video inventory
without alienating viewers.
Having said this, we see pockets of strength for publishers who provide better
targeting capabilities and who effectively use ad networks and ad exchanges to better
monetize non-premium inventory.
We Expect the Global Graphical Advertising Market to Grow
6.7% in F’09
We now think 2009 will be a weak year for graphical advertising publishers, as we
expect the graphical ad sector to under-perform performance-based advertising in a
down economy. On the back of estimated 14% Y/Y growth in 2008, we believe
global graphical advertising revenues will grow 7% in F’09. From a metrics
standpoint, we believe page views will grow 10% Y/Y while RPMs decline ~3%
Y/Y. We expect the global Internet population growth to remain strong at 7% Y/Y,
reaching 1.3B in 2009. We expect the global graphical advertising market to grow at
an 11% CAGR through 2011.
Table 11: J.P. Morgan's Global Graphical Advertising Revenue Forecast
Units as indicated
Global
2002 2003 2004 2005 2006 2007 2008E 2009E 2010E 2011E
08-'11E
CAGR
Internet Population (M) 593 710 820 924 1,020 1,113 1,205 1,295 1,380 1,471 6.9%
Pages Viewed / User / Day 33 34 36 37 38 39 40 41 43 44 2.7%
Total Pages Viewed (B) 7,209 8,897 10,724 12,607 14,275 15,986 17,793 19,590 21,510 23,539 9.8%
RPM (per 1,000 pages) $1.02 $0.75 $0.81 $0.87 $0.97 $1.07 $1.09 $1.06 $1.09 $1.13 1.2%
Global Graphical Forecast ($M) 7,354 6,674 8,642 10,984 13,829 17,068 19,368 20,670 23,494 26,536 11.1%
Y/Y Growth -19.6% -9.2% 29.5% 27.1% 25.9% 23.4% 13.5% 6.7% 13.7% 12.9%
Source: J.P. Morgan estimates, Company reports, comScore, Nielsen//NetRatings, IDC, IWS, and IAB
US Growth Likely to Mirror the Global Market at 6.3% in F'09
We expect the US graphical advertising market to grow 6.3% in 2009, well below
our year-ago estimate of 16.6%. We think that during 1H’09, US graphical
advertising revenue will be flat to down slightly Y/Y. However, as the economy
stabilizes, we expect 2H’09 display advertising to improve, resulting in our F’09
estimate of 6.3% Y/Y growth. We believe page view growth will slow to 6.5% in