Impact of democracy on literacy rate
Bạn đang xem bản rút gọn của tài liệu. Xem và tải ngay bản đầy đủ của tài liệu tại đây (163.78 KB, 8 trang )
INTERNATIONAL JOURNAL OF RESEARCH IN BUSINESS AND SOCIAL SCIENCE 9(7)(2020) 204-211
Research in Business & Social Science
IJRBS VOL 9 NO 7 SPECIAL ISSUE ISSN: 2147-4478
Available online at www.ssbfnet.com
Journal homepage: />
Impact of democracy on literacy rate: A cross country study
Md Arif Hosen(a),
Sujan Chandra Paul (b),
Md Harun Or Rosid(c*)
(a,b)
(c)
Department of Accounting & Information Systems, University of Barishal, Bangladesh
School of Management, Huazhong University of Science and Technology (HUST), Wuhan, PRC.
ARTICLE INFO
ABSTRACT
Article history:
Received 17 November 2020
Received in rev. form 03 Dec. 2020
Accepted 07 December 2020
Keywords:
Literacy rate, Electoral Process,
Pluralism Index,
Government Index, Political
Participation Index, Political Culture
Index, Civil Liberties Index.
JEL Classification:
M10, M15
This study investigates the impact of democracy indices on the literacy rate. Panel Data of 134
Countries from 2007-2018 were collected from the website the World Bank and Gapminder. This study
uses Ordinary Least Square (OLS), Pooled Ordinary Least Square (POLS), Driscoll-Kraay (DK),
Second Stage Least Square (2SLS), Generalized Methods of Moments (GMM) methods. This research
has found that political participation index and political culture index has a significant positive
relationship with literacy rate in all the method. The functioning of government index has a significant
positive relationship and electoral process and pluralism index has a significant negative relationship
with literacy rate in all the methods except the GMM method. The civil liberties index has a significant
negative relationship with literacy rate in POLS and in the other models, there is no significant
relationship between the civil liberties index and literacy rate.
© 2020 by the authors. Licensee SSBFNET, Istanbul, Turkey. This article is an open access article
distributed under the terms and conditions of the Creative Commons Attribution (CC BY) license
( />
Introduction
Education encourages democracy so people can make informed choices on elections, and is thus a pillar of a healthy and prosperous
society Lipset (1959). If autocracy is the tyranny of the rich, then the poor and middle class may define democracy as tyranny.
Because schooling is the only way for parents to boost their children's chances of a prosperous life (Keefer et al. 2004), democracy
will achieve a country's educational standard (Besley et al. 2006).
Literacy is seen as an important contribution to socio-economic development. A country's economic success relies largely on the
natural capital it possesses, and human resources are an important aspect of economic resources. Ample school infrastructure
continues to improve the rate of literacy and is one of the main components of benchmarks for human growth. A family's socioeconomic status has much to do with the level of literacy of a child and the level of literacy has to do with employment. The higher
the income of the household, the more likely it is that the children will have a high degree of literacy, that is to say, while
analphabetism does not cause poverty, poverty causes illiteracy (Street, 1995).
Lake and Baum (2001) explain how democratic political rivalry creates political forces that enhance the delivery of public services
at the cost of rentals from members. Autocratic governments, on the other hand, will gain large rents by limiting such facilities
without having to face significant consequences. Bueno de Mesquita et al. (2003) offers a somewhat different case for why liberalism
broadens access to and raises support for education. They argue that broad-based school programs should be described as public
goods, and that engaging in these programs is a cost-effective way of preserving electoral support for leaders with big "competitive
coalitions" (as in democracies), and comparatively costly for leaders with tiny coalitions (as in many autocracies).
Acemoglu and Robinson (2006) also claim that the comparatively poor majority will press for free education under democracy (where
they have more political power), while autocratic leaders will reject these costly educational programs that favor non-elites as well
(see also Meltzer and Richards, 1981; Saint-Paul and Verdier, 1993; Boix, 2003; North, Wallis and Weingast, 2009). Finally,
Stasavage (2005), focusing on the African context, develops a model explaining why democratically elected leaders will invest more
* Corresponding author. ORCID ID: 0000-0002-4179-958X
© 2020 by the authors. Hosting by SSBFNET. Peer review under responsibility of Center for Strategic Studies in Business and Finance.
/>
Hosen et al., International Journal of Research in Business & Social Science 9(7)(2020), Special Issue, 204-211
in primary education. Popular rural communities in African countries have strong desires to invest scarce public money on basic
education rather than policies that favor urban interests (such as costly university systems), and these rural communities face far less
cost of organising political action under democracy than autocracy (see also Bates, 1981).
As far as empirical research is concerned, Lake and Baum (2001) note a clear positive cross-country link between democracy and
numerous human resource proxies, including student-to-fourth grade success levels, pupil-teacher ratios, separate school attendance
ratios, and also literacy rates (which is, of course, a blunt proxy for quality education). But, many other researches – including case
reports, small-n longitudinal experiments, and observational tests using time series variance – indicate that democracy extends access
to and increases support for both primary and secondary schooling (Lindert, 2005; Stasavage, 2005; Engerman, Mariscal and
Sokoloff, 2009; Huber and Stephens, 2012). For example, during the 19th and early 20th centuries, the historic increase of access to
lower-level education in the US, UK, and Scandinavian countries seemed to have mirrored the increase of civil freedoms and, in
particular, suffrage extensions (see Lindert, 2005).
Studying post-colonial Africa, Stasavage (2005) reveals how populism is closely associated with primary education expenditure in
particular, and how elections led to the eventual elimination of school fees by Harding and Stasavage (2014). Interestingly, Harding
and Stasavage (2014) also mention evidence from Kenyan voters’ polls showing that they are conditioning their voting actions on
the abolition of school fees, providing more concrete evidence for the type of theoretical argument discussed above.
The objective of the study is to focus on the relationship of democracy indices (electoral process and pluralism index, functioning of
government index, political participation index, political culture index, civil liberties index) with literacy rate.
To attain the above objective rest of the part of the paper has been arranged in the following manner. Section 2 reviews the literature,
section 3 discusses methodology, section 4 delineated hypothesis, section 5 illustrates model construction, section 6 explains results
and discussion followed by conclusion, references and appendices.
Literature Review
Amartya Sen argued that “Politically unfree citizens – whether rich or poor – are deprived of a basic liberty and of a fundamental
constituent of good living” (2004, p10). He also emphasizes that not only does economic prosperity matter to people, but that
democracy provides people with stability by encouraging them to keep the rulers responsible for their decisions. But politicians, who
are chosen by the electorate, have more opportunities to fulfill the voters' wishes for re-election. This argument suggests that socialism
would mean improved lives for the people, which Sen shows by the fact that a democratic nation has never undergone a significant
famine (1999).
The relationship between democracy and education is discussed in many studies which explore the opposite direction, whether
education increases the probability of democratization (Glaeser et al. 2006). Tsai (2006) studies the effect democracy has in developed
countries on human growth. Regarding personal growth, he combines two different categories: physical well-being and educational
resources. The measurement of educational success is calculated as the rate of enrollment for primary school, the rate of completion
of fifth grade and the rate of enrolment for high school. He conducts the least absolute regressions of error to allow outliers to have
less impact on the results. Tsai also explores the rate of change in human development, calculated as the 1995-1998 level of human
growth relative to 1975-1984 averages. Ultimately, he controls the amount of GNP for government expenditure on education. The
findings indicate that educational rates in democracies were considerably and obviously higher than in autocracies. The association
between the rate of secondary school enrolment and the level of income was positive and substantial although government spending
on education was low and poor. Tsai noticed that autocracies had greater increases in primary and secondary school enrollment rates
than the democratic and semi-authoritarian countries did, but he acknowledges that most autocracies began at lower enrolment levels,
making it harder to reach high rates of change. Democracies and semi-authoritarian countries have invested more resources on
education, but the larger sums expended have not resulted in better educational results, suggesting a greater reliance on universities
(2006).
Noble Laurites Theodore Schultz and Gary Becker theorize that in the labour markets, employment makes workers earn higher
incomes. In fact, by investing in human resources via education, labour efficiency can be improved. It is often argued that increased
workforce productivity is a function of low supplies of human resources and is also a result of rising incomes on the economy
(HDRSA, 1998). Lower literacy translates through elevated rates of undernourishment, according to Food and Agriculture
Organisation and World Food System (2010). As reported in South Asia's Human Development Report (1998), "A farmer with four
years of education is 9 percent more competitive than his zero-educated counterparts," according to the World Bank. Burchi (2006)
analyzed the relationship between employment, economic development, and food security through a cross-country study. He found
that 100 percent increase in school enrollment among younger children would reduce food insecurity by around 22 percent, but this
association was observed only for basic education but not for higher education.
Schultz (1988) and Becker (1993) have accepted the evidence of investments in intellectual capital through employment contributing
to higher incomes and higher levels of business profitability. Empirical data from Bangladesh clearly backed the hypothesis by
analyzing wage disparities among high school educated women found to be 7 times higher than the wages of non-educated women
205
Hosen et al., International Journal of Research in Business & Social Science 9(7)(2020), Special Issue, 204-211
(World Bank 1993). For Pakistan, it was observed that with 10 percent rise in male literacy, 2.7 percent rise in farm productivity
while 10 percent increase in some other input raises half the production level as opposed to education (Rosegrant and Evenson 1993).
Surprisingly, qualified neighbors often have positive effects on the quality of the job relative to the neighbors who are illiterate.
Foster and Rosenzweig (1995) conducted this sort of study in India. They found a 4 percent higher rate of productivity among nonschooling farmers if their neighbors had finished primary school education compared to the analphabets. Investing in human capital
not only tends to increase incomes, income and profitability, but also fosters specific levels of return in the event of several years
spent in educational institutions. In a report carried out by the World Bank (1994), it was examined that Nepalese citizens earned
100% return on investment on primary education, 29.1 and 15% on lower secondary and higher education, and 2.17% return on
bachelor education, respectively. This was also delineated in the same report that the rate of return in the case of girls schooling was
significantly higher than in the case of boys.
Lind (2008) analyses the reasons for and against literacy by stakeholders and concludes that "adult literacy has been de facto
overlooked in real policies and capital allocations." The language disparity between official and unofficial languages creates a variety
of issues that also harm linguistically, educationally and socio-economically vulnerable minority language speakers (Wagner, 2003).
Research Methodology
Data
We use both quantitative and qualitative data that are obtained from secondary sources. This research gathers quantitative data in
form of literacy rate, democracy indices (electoral process and pluralism index, functioning of government Index, political
participation index, political culture index, civil liberties index) of 134 countries from year 2007-2018. On the other hand, articles
and working papers compile the qualitative evidence. Quantitative data were collected from Website World Bank and Gapminder.
The quantitative data were primarily used to establish a regression model and to facilitate the study of sequences. The qualitative
data, such as journal and working paper, were used for model creation and research improvements.
Data Processing
The corresponding move would be to evaluate and identify variables after obtaining the secondary data. There are seven variables
used to measure regression analysis when building the model. Literacy rate is used as dependent variable and others such as electoral
process and pluralism index, functioning of government index, political participation index, political culture index, civil liberties
index are used as independent variable.This paper conducted regression analyzes using Stata 15.1. Ordinary Least Square (OLS),
Pooled Ordinary Least Square (POLS), Driscoll-Kraay (DK), Second Stage Least square (2SLS), Generalized Methods of Moments
(GMM) methods are used to test the hypothesis.
Hypotheses
Based on the analytical framework and previous studies, this study defines the following hypotheses:
H1. Electoral Process and Pluralism Indices (EPPI) has a positive relationship with literacy rate
H2. Functioning of Government Indices (FGI) has a positive relationship with literacy rate.
H3. Political Participation Indices (PPI) has a positive relationship with literacy rate.
H4. Political Culture Indices (PCI) has a positive relationship with literacy rate.
H5. Civil Liberties Indices (CLI) has a positive relationship with literacy rate.
Model Construction
This research simplifies the model by directly relating literacy rate and some independent variables such as electoral process and
pluralism indices, functioning of government indices, political participation indices, political culture indices, and civil liberties
indices. The hypothesized relationship can be expressed as the following regression model:
L = f (LnEPPI, LnFGI, LnPPI, LnPCI, LnCLI )
Where,
LnEPPI=Electoral Process and Pluralism Indices,
LnFGI= Functioning of Government Indices,
LnPPI= Political Participation Indices,
LnPCI= Political Culture Indices,
LnCLI= Civil Liberties Indices.
After formulating the model, the next step is to define the equation. Since it is assumed that electoral process and pluralism indices,
functioning of government indices, political participation indices, political culture indices, civil liberties indices are helpful for
increasing literacy rate, a positive sign has been used for the coefficients of all indices.
The full equation model for the regression analysis is as follows:
206
Hosen et al., International Journal of Research in Business & Social Science 9(7)(2020), Special Issue, 204-211
L = α +β1LnEPPI +β2LnFGI + β3LnPPI +β4LnPCI+ β5LnCLI+ μ
Results and Discussion
With the aim to identify the impact of democracy indices on literacy rate, first, we are going to analyze the correlations among the
variables we obtained from literature. A combined correlation matrix is given below to report the variables.
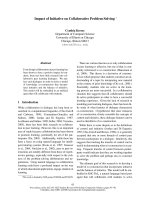
Table 1: Pairwise correlations matrix
Variables
(1) lnLR
(2) lnEPPI
(3) lnFGI
(4) lnPPI
(5) lnPCI
(6) lnCLI
(1)
1.000
0.079
0.283
0.274
0.226
0.188
(2)
(3)
(4)
(5)
(6)
1.000
0.437
0.657
0.261
0.800
1.000
0.443
0.451
0.545
1.000
0.383
0.687
1.000
0.458
1.000
Table 1 shows little association among the variables indicating very low chance of endogeneity. Limited by the layout, only the
correlation coefficient matrices and collinearity test results are provided here. However, the results meet the requirements of the
correlation coefficient test and VIFs test. Also, the results show significance at least at .10 level for all the variables. No variable is
showing association over .90 level.
Econometric Models
Multiple regression models have been run with the same dependent (literacy rate) and independent variables (EPPI, FGI, PPI, PCI,
CLI). In the following section the results of those models are presented and interpreted below.
Ordinary Least Square (OLS) model
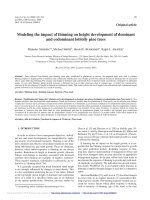
Table 2: Ordinary Least Square (OLS) model
lnLR
Coef.
lnEPPI
-.042
lnFGI
.059
lnPPI
.152
lnPCI
.05
lnCLI
.019
Constant
3.523
Mean dependent var
R-squared
F-test
Akaike crit. (AIC)
*** p<.01, ** p<.05, * p<.1
St.Err.
.006
.008
.017
.022
.015
.078
4.426
0.143
53.608
-442.765
t-value
p-value
-6.54
0
7.29
0
8.76
0
2.26
.024
1.29
.198
44.95
0
SD dependent var
Number of obs
Prob > F
Bayesian crit. (BIC)
[95% Conf
Interval]
-.054
-.029
.043
.075
.118
.186
.007
.093
-.01
.049
3.369
3.676
0.227
1608.000
0.000
-410.468
Sig
***
***
***
**
***
In Ordinary Least Square (OLS) Model, table 2 shows functioning of government index, political participation index and political
culture index have significant positive relationship with literacy rate. The more governmental functioning, political participation
and political culture of a country, the more will be the literacy rate for the countries. Electoral process and pluralism indices have
the significant negative relationship with the literacy rate of a country. On the contrary other independent variables have mixed but
insignificant nature of relationship with literacy rate though the overall model is significant at 10% level. For more robustness of
the results, the next model is run.
Pooled Ordinary Least Square (POLS) model
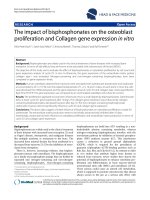
Table 3: Pooled Ordinary Least Square (POLS) model
lnLR
Coef.
lnEPPI
-.005
lnFGI
-.008
lnPPI
.074
lnPCI
.005
lnCLI
-.053
Constant
4.387
Mean dependent var
Overall r-squared
Chi-square
R-squared within
*** p<.01, ** p<.05, * p<.1
St.Err.
.003
.004
.006
.011
.01
.06
4.426
0.000
184.865
0.115
t-value
p-value
-1.70
.088
-1.94
.052
12.09
0
0.42
.677
-5.18
0
72.89
0
SD dependent var
Number of obs
Prob > chi2
R-squared between
[95% Conf
Interval]
-.01
.001
-.017
0
.062
.086
-.017
.027
-.074
-.033
4.269
4.505
0.227
1608.000
0.000
0.001
Sig
*
*
***
***
***
207
Hosen et al., International Journal of Research in Business & Social Science 9(7)(2020), Special Issue, 204-211
In Pooled Ordinary Least Square Model, table 3 shows political participation index and political culture index have significant
positive relationship with literacy rate. The more political participation and political culture of a country, the more will be the
literacy rate for the countries. Electoral process and pluralism indices, functioning of government index and civil liberties indices
have the significant negative relationship with the literacy rate of a country. On the contrary other independent variables have
mixed but insignificant nature of relationship with literacy rate though the overall model is significant at 1% level. For more
robustness of the results, the next model is run.
Driscoll-Kraay pooled OLS (DK) model
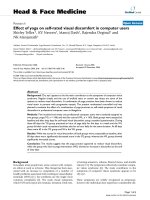
Table 4: Driscoll-Kraay pooled OLS model
Regression with Driscoll-Kraay standard errors
Method: Pooled OLS
Group variable (i): ID
maximum lag: 2
lnLR
lnEPPI
lnFGI
lnPPI
lnPCI
lnCLI
_cons
Coef.
-0.042
0.059
0.152
0.050
0.019
3.523
Number of obs
Number of groups
F( 5, 11)
Prob > F
R-squared
Root MSE
Std.Err.
0.006
0.003
0.016
0.017
0.008
0.052
T
-6.920
17.890
9.670
2.990
2.550
68.000
= 1608
= 134
= 466.50
= 0.0000
= 0.1433
= 0.2105
P>t
0.000
0.000
0.000
0.012
0.027
0.000
95%Conf.
-0.055
0.052
0.117
0.013
0.003
3.408
Interval]
-0.028
0.067
0.186
0.086
0.036
3.637
In Driscoll-Kraay pooled OLS model, Table 4 shows functioning of government index, political participation index, political culture
index and civil liberties index have significant positive relationship with literacy rate. The more governmental functioning, political
participation, political culture and civil liberties, the more will be the literacy rate for the countries. On the contrary other independent
variable (EPPI) has significant negative relationship with literacy rate though the overall model is significant at 5% level. For more
robustness of the results, the next model is presented.
Two stage least square (2SLS) model
Table 5: Two stage least square (2SLS) model
lnLR
Coef.
lnEPPI
-.042
lnFGI
.059
lnPPI
.152
lnPCI
.05
lnCLI
.019
Constant
3.523
Mean dependent var
R-squared
F-test
*** p<.01, ** p<.05, * p<.1
St.Err.
.006
.008
.017
.022
.015
.078
4.426
0.143
53.608
t-value
p-value
-6.54
0
7.29
0
8.76
0
2.26
.024
1.29
.198
44.95
0
SD dependent var
Number of obs
Prob > F
[95% Conf
Interval]
-.054
-.029
.043
.075
.118
.186
.007
.093
-.01
.049
3.369
3.676
0.227
1608.000
0.000
Sig
***
***
***
**
***
Table 5 shows functioning of government index, political participation index and civil liberties index have significant positive
relationship with literacy rate. The more governmental functioning, political participation and civil liberties help to increase literacy
rate for the countries. On the contrary other independent variable (EPPI) has significant negative relationship with literacy rate though
the overall model is significant at 5% level. Civil liberties index has positive but insignificant relationship with the literacy rate. For
more robustness of the results, the next model is added.
Generalized method of moments (GMM) model
Table 6: Generalized method of moments (GMM) model
lnLR
Coef.
L.lnLR
.835
lnEPPI
.001
lnFGI
.007
lnPPI
.027
lnPCI
-.029
lnCLI
-.004
Constant
.733
Mean dependent var
Number of obs
*** p<.01, ** p<.05, * p<.1
208
St.Err.
.057
.003
.005
.008
.012
.013
.266
4.428
1340.000
t-value
p-value
14.58
0
0.44
.659
1.28
.199
3.21
.001
-2.30
.021
-0.34
.734
2.75
.006
SD dependent var
Chi-square
[95% Conf
.723
-.005
-.003
.01
-.053
-.029
.211
0.225
665.195
Interval]
.948
.007
.016
.043
-.004
.021
1.255
Sig
***
***
**
***
Hosen et al., International Journal of Research in Business & Social Science 9(7)(2020), Special Issue, 204-211
Table 6 shows political participation index and political culture index have significant positive relationship with literacy rate. The
more political participation and political culture is helpful for increasing literacy for the countries. On the contrary other independent
variables (EPPI, FGI, CLI) have insignificant positive and negative relationship with literacy rate though the overall model is
significant at 5% level.
Comparative coefficient analysis of the empirical models
Table 7: Comparative coefficient analysis of the empirical models
Model
Regression equation
OLS
L = 3.523 - 0.059 lnEPPI + 0.059 lnFGI + 0.152 lnPPI + 0.05 lnPCI + 0.010 lnCLI
POLS
L = 4.387 - 0.005 lnEPPI - 0.008 lnFGI + 0.074 lnPPI + 0.005 lnPCI - 0.053 lnCLI
DK
L = 3.523 - 0.042 lnEPPI + 0.059 lnFGI + 0.152 lnPPI + 0.050 lnPCI + 0.019 lnCLI
2SLS
L = 3.523 - 0.042 lnEPPI + 0.059 lnFGI + 0.152 lnPPI + 0.050 lnPCI + 0.019 lnCLI
GMM
L = 0.733 + 0.001 lnEPPI + 0.007 lnFGI + 0.027 lnPPI - 0.029 lnPCI - 0.004 lnCLI
The results of different models establish that political participation index and political culture index has significant positive
relationship with literacy rate in all the method. Functioning of government index has significant positive relationship and electoral
process and pluralism index has significant negative relationship with literacy rate in all the methods except GMM method. Civil
liberties index has significant negative relationship with literacy rate in POLS and in the other models there is no significant
relationship between the civil liberties index and literacy rate.
Based on the findings of the study, it can be recommended that a country should not put it concentration mostly on enhancing
governmental functioning, political participation and political culture for increasing literacy rate of a country. Other democracy
indices like electoral process and pluralism index, civil liberties index are affecting the literacy rate of a country in an unstructured
and undesired way. The insight of this finding may require separate study. Overall, the study of 134 countries through a 12 years’
dynamic panel data has come up with valuable findings to understand the economies of the world with respect to literacy rate and
democracy indices.
The broad finding that democracy is not necessarily enhancing literacy rate in every aspect except for governmental functioning,
political participation and political culture. Specifically, this paper had mainly contributed in two aspects: firstly, it has predicted and
shown the relationship of literacy rate with democracy indices across the countries of the world and secondly it has scrutinized and
identified the impact of different democracy indices on literacy rate through robust models like DC, 2SLS, GMM.
Conclusion
The ultimate objective of the research was achieved through the present study. The relationship between democracy and literacy has
now been discovered. How democracy affects a nation's literacy rate has been well illustrated in the study. Different indices of
democracy have shown various forms of effect on literacy. This study showed that in all the approaches, the political participation
index and the political culture index have a significant positive relationship with the rate of literacy. The functioning of the
government index has a significant positive relationship, and the democratic mechanism and pluralism index in all methods except
the GMM system have a significant negative relationship with the literacy rate. The index of civil liberties has a substantial negative
relationship with the literacy rate in POLS, and there is no significant relationship between the index of civil liberties and the literacy
rate in other models.
The academia would be complemented through the analysis on the impact of democracy indices on literacy rate. This study will show
how to use these different regression models jointly come up with the same results. Besides, academics of economic arena would be
aware of the fact that which democracy indices are increasing literacy rate most. They will also be assisted to analyze further how
to conduct more refined studies regarding literacy rate and democracy indices. The concept of literacy rate and democracy indices
can also be used in broad theoretical discussion of the economic world in upcoming future.
Data were not collected for all the countries of the world because of the availability in the database. Also, more than 12 years’ data
would have been more conclusive. Data had to be converted for analysis which may lead to discrepancies. Besides, many variables
have been untouched in this research. Future study may be conducted on finding out the most important determinants of literacy rate
besides the democracy indices.
References
Acemoglu, D., & Robinson, J. A. (2006). Economic origins of dictatorship and democracy. Cambridge University Press.
Aristotle(350BC), Politics, Book Eight, Part 1.
Burchi, F. (2006, August). Education, human development, and food security in rural areas: Assessing causalities. In International
Conference of the Human Development and Capability Association: Freedom and Justice, September, Groningen, the
Netherlands.
209
Hosen et al., International Journal of Research in Business & Social Science 9(7)(2020), Special Issue, 204-211
Bates, R. H. (1981). Food policy in Africa—political causes and social effects. Food Policy, 6(3), 147-157.
Besley, K. (2006).Health and democracy. American Economic Review, 2006-0596:2, 313-318
Boix, C. (2003). Democracy and redistribution. Cambridge University Press.
De Mesquita, B. B., Smith, A., Siverson, R. M., & Morrow, J. D. (2005). The logic of political survival. MIT press.
Do, Q. T., & Iyer, L. (2010). Geography, poverty and conflict in Nepal. Journal of Peace Research, 47(6), 735-748.
Engerman, S. L., Mariscal, E. V., & Sokoloff, K. L. (2002). The evolution of schooling institutions in the Americas, 1800-1925.
Foster, A. D., & Rosenzweig, M. R. (1995). Learning by doing and learning from others: Human capital and technical change in
agriculture. Journal of political Economy, 103(6), 1176-1209.
Shleifer, A., Glaeser, E. L., & Ponzetto, G. (2006). Why Does Democracy Need Education? National Bureau of Economic
Research.
Huber, E., & Stephens, J. D. (2012). Democracy and the left: Social policy and inequality in Latin America. University of Chicago
Press.
HDRSA. (1998). Human Devlopment Report South Asia: Published by Human development centre. Oxford University Press,
Oxford.
Keefer, P., & Khemani, S. (2004). Democracy, public expenditure, and the poor. World Bank.
Lipset, S. M. (1959). Some social requisites of democracy: Economic development and political legitimacy. The American political
science review, 53(1), 69-105.
Lind, A. (2008). Literacy for all: Making a difference. Unesco.
Lake, D. A., & Baum, M. A. (2001). The invisible hand of democracy: political control and the provision of public services.
Comparative political studies, 34(6), 587-621.
Meltzer, A. H., & Richard, S. F. (1981). A rational theory of the size of government. Journal of political Economy, 89(5), 914-927.
North, D. C., Wallis, J. J., & Weingast, B. R. (2009). Violence and social orders: A conceptual framework for interpreting
recorded human history. Cambridge University Press.
Lake, D. A., & Baum, M. A. (2001). The invisible hand of democracy: political control and the provision of public services.
Comparative political studies, 34(6), 587-621.
Lindert, P. H. (2005). Growing Public: Social Spending and Economic Growth Since the Eighteenth Century, Vols. 1 (The Story)
and 2 (Further Evidence). ILR Review, 58(4), 84.
Rosegrant, M. W., Evenson, R. E., & Mahmood, M. (1993). Agricultural Productivity Growth in Pakistan and India: A
Comparative Analysis [with Comments]. The Pakistan Development Review, 32(4), 433-451.
Stasavage, D. (2005). Democracy and education spending in Africa. American journal of political science, 49(2), 343-358.
Saint-Paul, G., & Verdier, T. (1993). Education, democracy and growth. Journal of development Economics, 42(2), 399-407.
Sen, A. (2004). What’s the Point of Democracy. American Academy of Arts and Sciences Bulletin, 57(3).
Sen, Amartya (1999), Utvecklingsomfrihet, Daidalos AB, Edition 2002, Uddevalla.
Schultz, T. P. (1988). Education investments and returns. Handbook of development economics, 1, 543-630.
Street BV (1995). Social illiteracies. London and New York: Longman. pp. 9-15.
Tsai, M. C. (2006). Does Political Democracy Enhance Human Development in Developing Countries? A Cross‐National Analysis.
American Journal of Economics and Sociology, 65(2), 233-268.
World Bank. (1993). Staff appraisal report on Female Secondary School Assistance. Report No. 15496-IN, 16 February 1993.
Stasavage, D. (2005). Democracy and education spending in Africa. American journal of political science, 49(2), 343-358.
Wagner, D. A. (2003). Smaller, quicker, cheaper: Alternative strategies for literacy assessment in the UN Literacy Decade.
International Journal of Educational Research, 39(3), 293-309.
World Bank. (1994). Nepal: Critical issues in secondary education and options for reform Report No. 12243-NEE 26 August 1994.
World Food Programme & Food and Agriculture Organization. (2010). State of Food Insecurity in the World: Addressing Food
Insecurity in Protracted Crisis”. Food and Agriculture Organization of the United Nations, Rome 2010. ISBN 978-92-5106610-2.
Publisher’s Note: SSBFNET stays neutral with regard to jurisdictional claims in published maps and institutional affiliations.
© 2020 by the authors. Licensee SSBFNET, Istanbul, Turkey. This article is an open access article distributed under the terms and conditions of the
Creative Commons Attribution (CC BY) license ( />International Journal of Research in Business and Social Science (2147-4478) by SSBFNET is licensed under a Creative Commons Attribution 4.0
International License.
210
Hosen et al., International Journal of Research in Business & Social Science 9(7)(2020), Special Issue, 204-211
Appendix: List of countries which data are used
Afghanistan
Egypt
Lithuania
Senegal
Albania
El Salvador
Madagascar
Serbia
Algeria
Equatorial Guinea
Malawi
Sierra Leone
Angola
Eritrea
Malaysia
Singapore
Argentina
Estonia
Mali
Slovenia
Armenia
Ethiopia
Malta
South Africa
Azerbaijan
Fiji
Mauritania
South Korea
Bahrain
Gabon
Mauritius
Spain
Bangladesh
Gambia
Mexico
Sri Lanka
Belarus
Georgia
Moldova
Sudan
Benin
Ghana
Mongolia
Suriname
Bhutan
Greece
Montenegro
Tajikistan
Bolivia
Guatemala
Morocco
Tanzania
Bosnia and Herzegovina
Guinea
Mozambique
Thailand
Botswana
Guinea-Bissau
Myanmar
Timor-Leste
Brazil
Guyana
Namibia
Togo
Bulgaria
Haiti
Nepal
Trinidad and Tobago
Burkina Faso
Honduras
Nicaragua
Tunisia
Burundi
Hungary
Niger
Turkey
Cambodia
India
Nigeria
Turkmenistan
Cameroon
Indonesia
North Korea
Uganda
Central African Republic
Iran
Oman
Ukraine
Chile
Iraq
Pakistan
United Arab Emirates
China
Italy
Panama
Uruguay
Colombia
Jamaica
Papua New Guinea
Uzbekistan
Comoros
Jordan
Paraguay
Venezuela
Congo, Dem. Rep.
Kazakhstan
Peru
Vietnam
Congo, Rep.
Kenya
Philippines
Zambia
Costa Rica
Kuwait
Poland
Zimbabwe
Cote d'Ivoire
Kyrgyz Republic
Portugal
Croatia
Lao
Qatar
Cyprus
Latvia
Romania
Czech Republic
Lebanon
Russia
Dominican Republic
Lesotho
Rwanda
Ecuador
Liberia
Saudi Arabia
211