Power line communication in a distribution network: Methodology, design and application
Bạn đang xem bản rút gọn của tài liệu. Xem và tải ngay bản đầy đủ của tài liệu tại đây (374.41 KB, 5 trang )
24
Nguyen Huu Hieu
POWER LINE COMMUNICATION IN A DISTRIBUTION NETWORK:
METHODOLOGY, DESIGN AND APPLICATION
Nguyen Huu Hieu
The University of Danang, University of Science and Technology;
Abstract - Recently, many methods of transmitting data have been
studied and employed in power system in order to acquire
measuring parameters (power, voltage, etc) and to control electric
devices in power system. The advantage of power-line
communication is to utilize the existing infrastructure, but existing
harmonics in power system have certain impacts on the accuracy
of obtained information. This paper proposes a method of
transmitting data on lines of distribution network. The paper utilizes
a proper modulation method as well as proposes designs,
especially filters, to minimize impacts of existing harmonics in
power system on the accuracy of obtained information.
Key words - power line communication; distribution network; carrier
frequency; frequency shift keying; modulation; electric frequency.
1. Introduction
Consumption electricity can be considered as a major
reason for greenhouse or global warming effects that cause
environmental impacts due to use of fossil fuels, especially
coal. Smart grid technology is an essential requirement that
reduces overall these effects with demand management
that manages electricity more efficiently and effectively
[1]. In the technology, the operation of switching devices
has been becoming automatic and optimal in order to save
electrical energy, to stabilize loads, to abate the length of
time of blackout, to reduce the usage of human resource,
etc. And in order to perform the operation of switching
devices in a fast and accurate way, the act of data
transmission plays a significant role. There are many
method of data transmission; among the methods, powerline communication is concerned by scientists.
Power-line communication (PLC) uses existing
infrastructure which is power system infrastructure;
therefore, it can be easily applied in a wide area, regardless
of geographic factors. However, transmission lines are not
designed to transfer data; they also do not have an identical
characteristic admittance. The data which is transferred by
power system lines has high frequency. Thus, admittance of
the lines weakens the amplitude of signals. Besides, devices
connected to power system lines are quite diverse with
different resistances; they can generate harmonics with
different frequencies. Hence, there is noise in PLC method.
Although there are many ways to overcome the two
disadvantages, but researchers point out that PLC can be
applied for the following fields [2]: smart metering
infrastructure, communications between electric vehicles
and power grid via power line without introducing other
wired or wireless equipment, transferring data seamlessly
from smart gird controllers to home networks and vice versa.
In Vietnam, research works and application of PLC
have been applied, for instance: acquire distant
comptometer indices at Central Power Corporation and
Southern Power Corporation. However, such applications
have not been used widely.
With the current situation of power system of Vietnam,
the authors aim to apply PLC technique in distribution
network for the purposes:
• Acquire comptometer indices and transfer them to
transformer stations 22/0,4kV.
• Inform to system in case of broken lines.
• Control home devices for reducing consumption
electricity.
With the purposes, our PLC mode can be used in the
following constraints:
• For systems with small scale: transmission distance
is about 800 m.
• Transmission speed can reach to 100 bps or higher.
• Noise resistance: this is an important standard.
With a good noise-resistance system which well resists
any noise from other devices, obtained signals will be
accurate. If obtained signals are not accurate, electric
devices can be malfunctioned. And our PLC must have:
• Simple software and easy operation,
• The lowest price,
• Additional impact: having no impact on other
electronic devices such as TV, computer, recorder,
• Small power losses.
In this paper, structure and principle of power-line
communication are introduced. Then, manufacturation,
installation and practical measurement of PLC devices
proposed will be presented.
2. Methodology Background
2.1. Modulation for power line communication
Usually, a carrier (or modulated) signal is needed to
convey data in a PLC system. Depending on the speed of
digital information transmission, different modulation
techniques can be used. With low transmitting bit rate (up
to a few hundreds of kbits/s), it may be suitable to use ASK
(Amplitude Shift Keying) where the information is
represented by the presence or absence of the carrier signal
[3]. Similarly, we can also use FSK (Frequency Shift
Keying) or PSK (Phase Shift Keying) in which the
information values 0/1 are differentiated respectively by
frequencies or phases of the carrier. In cases of higher bit
rates (up to dozens or hundred of Mbits/s), more
sophisticated modulation techniques should be used in
order to eliminate the intersymbol interference (ISI) [3].
Modulation techniques suitable to this purpose can be
CDMA and OFDM.
In our application, which requires rather low
transmitting bit rate, we preferred the FSK modulation.
ISSN 1859-1531 - THE UNIVERSITY OF DANANG, JOURNAL OF SCIENCE AND TECHNOLOGY, NO. 12(85).2014, VOL. 1
𝑠𝐶 (𝑡) = ∑ 𝐴𝐶,𝑘 𝑅𝑒𝑐𝑡𝑇𝑐 (𝑡 − 𝑘. 𝑇𝐶 )
𝑘
Where RectT(t) is a rectangular function with duration
T, 𝐴𝐶,𝑘 is the sequence of bit “0” and bit “1”, 𝑇𝐶 is the bit
duration.
In the FSK modulation, a bit “1” will be represented by
a sinusoidal function with frequency 𝑓1 in the bit
duration 𝑇𝐶 , meanwhile a bit “0” is assigned to
frequency 𝑓2 . With this FSK modulation technique, the
modulated signal can have constant amplitude but has two
different frequencies (𝑓1 ≠ 𝑓2 ). Consequently, a FSK
signal can be written as follow:
bandwidth can also be eliminated by using Limiter if its
amplitude is higher than the FSK signal amplitude (fB in
Figure 2). However, it could be a problem if noise
frequency is inside the FSK signal bandwidth and its
amplitude is smaller than the FSK signal amplitude. A
solution to this situation is to use “matched filter”. More
details about this method can be found in [5].
IN BAND
INTERFERENCE
OUT OF BAND
INTERFERENCE
FM DETECTOR
INPUT BAND PASS FILTER
AMPLITUDE
The digital data signal can be represented by:
25
𝑠𝐹𝑆𝐾 (𝑡) = 𝐴𝑐𝑜𝑠(2𝜋[𝐹𝐶 ± 𝐹∆ ]𝑡) = 𝐴𝑐𝑜𝑠([𝑊𝐶 ± 𝑊∆ ]𝑡)
Where -𝐹∆ corresponds to bit “0” and +𝐹∆ corresponds
to bit “1”. FC is the carrier frequency, ±𝐹∆ is the amount of
frequency shifting from the carrier frequency.
2.2. FSK demodulation
There may be several methods to demodulate a FSK
signal. The first one is to multiply the signal with its
delayed version then low-pass filtered. If we choose the
𝜋
delay T in such a way that 𝑊𝐶 . 𝑇 = , then the low pass
2
filter result is proportional to the deviation from the carrier
frequency; hence the corresponding bit value can be
determined [4]. This method can be explained as follows.
Let 𝑤 = 𝑊𝐶 ± 𝑊∆ , then:
cos(𝑤𝑡) cos(𝑤(𝑡 − 𝑇)) =
1
2
(cos(𝑤𝑇) + cos (2𝑤𝑡 − 𝑤𝑇))
After the low-pass filter, the term cos(wT) is obtained.
Yet we have:
cos(𝑤𝑇) = cos(𝑊𝐶 𝑇 ± 𝑊∆ 𝑇) = −𝑠𝑖𝑛(±𝑊∆ 𝑇)
= ∓sin (𝑊∆ 𝑇)
Therefore, we can determine the transmitted bit value.
Another method [5], which is a bit more complex, is
presented in the following figure.
DATA
OUT
SFK
SIGNAL
BAND PASS
FILTER
LIMITER
FM
DISCRIMINANT
LOW PASS
FILTER
DECISION
(SLICER)
Figure 1. Demodulation for FSK signal
In this FSK demodulation, the band pass filter is used
to remove noise with frequencies outside the FSK signal
bandwidth. The limiter allows eliminating noise with high
amplitude if this noise falls inside the FSK bandwidth.
Finally, the low-pass filter removes noise with frequencies
above the baud rate. More details can be found in [5].
2.3. Noise problem in FSK demodulation
In reality, noise can prevent us from correctly
demodulating FSK signals. From the above analysis, we
can carefully design a band-pass filter to remove noise
components with frequency outside the FSK signal
bandwidth (fA in Figure 2). Noise inside the FSK signal
fa
fspace
fb
fc
fmark
FREEQUENCY
Figure 2. Examples of noise in FSK signal (from [5])
2.4. Amplitude equalization before filtering
(a)
(b)
Figure 3. (a) Ideal band pass filter, (b) Real band pass filter
We often use a band-pass filter to get signal
components between frequency f1 and f2, which can be
represented in Figure 4a. However, we cannot in reality
design such an ideal filter that has an abrupt change
between the pass band and the stop band. In fact, we can
only have band-pass filters like one in Figure 4b. Yet, in
this case some components with frequencies outside the
interval [f1, f2] can still be present. In a worst case, these
unwanted components can mask the useful signals inside
the interval [f1, f2] if the amplitudes of these wanted signals
are small. Hence, a solution to this problem is to make all
components have the same amplitude before filtering.
This can be done by estimating the frequencies and
amplitudes of all sinusoidal components in the signal. The
spectrum of the latter is analyzed using DFT (Discrete
Fourier Transform). In the frequency domain, we can
determine the frequencies and amplitudes of the
components. From this information, the amplitude of each
component can be amplified appropriately to the same value.
The resulting signal is then applied to the selected filtering.
3. Design of power-line communication devices
3.1. Choice of power-line carrier frequency
Currently, there is no concrete study on determining the
frequency of digital data signal which is transmitted on
power lines. If low frequencies are employed, noise will be
high, that makes it difficult to filter and rectify information
26
Nguyen Huu Hieu
and lowers transmission speed. If high frequencies are
employed, it requires a high accuracy of components in
circuit board as well as electromagnetic disturbances
(Electromagnetic Compatibility). From references of PLC
criterion as well as many studies, the frequency range 3 –
3000 kHz is employed [6]. Through experiments of
transmission quality, the authors chose the frequency of
100Hz for digital data signal.
3.2. Signal Modulation
As it was presented in section 2.2, FSK method is
employed in our study. Each data packet (perhaps powers,
voltages or device addresses, etc.) is encoded into 16-bit: 1
start bit, 7 device addresses bits, 8 data bits with the
structure as the below figure.
Start bit
7 device addresses bits
8 data bits
Figure 4. Structure of each data packet
As we know, transmitted data on power lines has noise
and that could result in data losses. Thus, it is necessary for
each bit to be transmitted with a band of sinusoidal pulse,
which has a frequency of 100Hz. And each band of pulse
is introduced into power system when voltage is 0. Sent
data packets are encoded differently:
• Start bit: a band of 400 sine pulses (span 4 ms).
• Bit 1: a band of 300 sine pulses (span 3 ms).
• Bit 0: no information is emitted (no pulse).
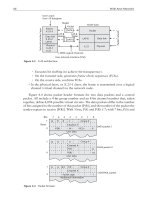
Figure 5 present principal wave (50Hz) of power
system and carrier ware of 16-bit data (including 1 start bit)
which are introduced into power lines.
Ware of power system
Start bit
bit 0
bit 1
Carrier ware (f=100 KHz)
Figure 5. Carrier ware of 16-bit (start bit + device addresses
bits 0100010 + data bit 11001011)
So, At signal receiving unit, data bits are determined in
accordance with the number of 100Hz-sinusoidal pulses
which are received at the moment of 0.
- 350-400 pulses: start bit.
- 250-300 pulses: bit 1.
- <250 pulses: bit 0.
So, at signal receiving unit, data reading begins when the
start bit is trigged and stops after 16 bits are read (about 0.16 s).
3.3. Schematic circuit
Two main parts of a PLC device are emitting module
and receiving module.
• Emitting module
In order to introduce signals into power lines, emitting
module needs to integrate with function blocks:
Figure 6. Block diagram of emitting part
Emitting unit: emits signals by microprocessors with
nominal voltage, 5V. The signals pass amplifying unit with
the shape of sinusoidal pulses (peak amplitude 6V,
frequency 100 kHz).
Isolating unit: uses pulse transformers with the ratio 1:4
and capacitors in order to alleviate low frequencies. The
signals will be introduced into power lines with peak
amplitude 20V, frequency 100 kHz.
• Receiving module
Receiving modules receive and analyze signals. There
are two parts of the receiving module: filter unit and
retrieving unit:
Filter unit: filters existing signals on power lines and
captures signals with frequency of 100 kHz.
Retrieving part: this part is comprised of two small
parts: comparator and solving unit. Signals which were
filtered are introduced into comparator, if their amplitude
is sufficiently high (about mVs), they’ll return to 1;
otherwise they’ll return to 0. In the solving unit, pulses with
the value of 1 are counted in order to determine different
bits (start bit, bit 1, bit 0). Alter solving 16 bits, mainboard
will determine the sending signal.
There are many studies and researches concerning the
design of the modules [7]. A simple model is proposed,
contains two parts:
- High-pass filters: block low frequency signals; only
high frequency signal is allowed to pass through.
- Resonant filters: are employed for filtering bands of
frequency which are adjacent to the frequency of emitting
signal. (fc±10% fc, fc: carrier frequency).
However, there remain certain difficulties. With real
band pass filters, frequencies which do not belong to
limitations will not efficiently be cut as it was presented in
section 2.4. Therefore, obtained information could be
inaccurate.
The authors propose to add amplification in retrieving
part, as it is presented in the Figure 7. The aim of this unit
is to amplify and limit all amplitudes of harmonics
(including carrier waves 100 kHz) up to a given voltage
value (in the present study, this value was 0.9V). With this
application unit, there is no need to concern about the
amplitudes of harmonics (only the frequencies of
harmonics are to be considered). So, building filters only
depends on frequency characteristics.
ISSN 1859-1531 - THE UNIVERSITY OF DANANG, JOURNAL OF SCIENCE AND TECHNOLOGY, NO. 12(85).2014, VOL. 1
27
Other part is comparator. The objective of comparator
is limiting all harmonic amplitudes at 0.9 V. Parameters in
this part are calculated by using formulas [8]: R16 = 4.7 k
Ω, R17 = 68 Ω, R19 = 220 Ω, R20 = 47 Ω.
Resonant filter: After crossing amplification circuit, all
signals are taken amplitude 0.9 V, this signal is passed
through resonant filters with 100 kHz at center frequency
to eliminate interference.
Figure 7. Block diagram of receiving part
3.4. Calculation and design of PLC device
The authors develop existing reference to design parts
of emitting unit and receiving unit [8]. PIC 13f877 was
used as mainboard. In addition to that, IC LM339 was used
to detect and receiving signals.
In this paper, structure as well as parameters of
receiving module is presented explicitly. This is also a new
novelty of our method.
• High-pass filter
Structure of high-pas filter is presented in Figure 8.
Figure 10. Resonant filter
The circuit consists two circuit parallel LC filters. Its
resonant frequency is: f o =
Figure 8. Structure of high-pas filter
The cut-off frequency is f c =
= R =
1
2 RC
1
2 C
The cut-off frequency is chosen to be 15 kHz and C
contains two compensators 11 nF in parallel.
Thus: R1 = 1 kΩ.
1
.
2 L.C
Carrier wave has frequency at f0= 100 kHz. Thus, the
value of L and C can be chosen: L = 56 and C = 47 nF.
By using [8], the resonance bandwidth of the filter is
90-100 kHz.
3.5. Analysis and assessment of filter
After designing, manufacturing, the receiving module is
experimented in various cases. Through pulse generator,
which increases harmonic source and existing harmonics in
power system, harmonic source which is needed to study has
a frequency range from 100 Hz to 100 kHz. Figure 11.a.
presents high frequencies harmonics in the tested system.
• Amplification
(a)
(b)
Time/div = 2 us
Vol/div= 2V
(a)
(b)
Figure 11. Signal input (a) and output (b) of the receiving module
Figure 9. Amplification structure:
(a) amplitude amplification; (b) comparator
This component contains two parts (see Figure 9):
One amplifies all harmonic amplitudes (gain 250). This
part uses basic BJT amplifier configurations type of CE.
Utilizing [8], parameters are determined as follows:
R4 = 10 k; R5 = 4.7 k; R6 = 4.7 k; R7 = 2.2 k
C3 = 10 nF; C4 = 10 nF; C5 = 47 nF
Figure 11.b present out-put signal of the filter, it is seen
that undesirable parts of harmonics were all filtered, and there
exists only a harmonic part of the carrier wave (100 kHz).
In comparison of currently existing PLC filters, the
authors’ filter has some prominent characteristics:
-The input voltage at resonant filter is limited at 0.8V;
thereby, the current is limited too. Thus, it ensures that the
inductor of resonant filter works at linear state.
-With the fact that amplitudes of all harmonics are
returned to same value, values of all undesirable harmonics
will be eliminated at resonant filter (hence, not being
affected by real filter as in section 2.4). Thus, the width of
bandwidth filter reduce (at ± 10%. 100 kHz), it increases
signal reliability.
28
Nguyen Huu Hieu
4. Application
The authors apply the theory and the new approach of
receiving module in order to manufacture PLC devices.
Objective of this system is to regulated the load demand.
Our system includes 1 master and many slavers.
Master administrates general information of loads (in
this case, it is active power), order slavers to transmit
information of load or perform switching tasks.
Slaver: each slaver regulates one device or a group of
devices such as lights, engine, etc. (which are marked 1, 2,
3,…, to be maximum of 6 devices); each slaver is equipped
with address bar comprised of 7 bits. Slaver receives orders
from Master and then effectuates them (sending signal or
switching tasks).
Information exchange contains:
- Master sends 16 bits command code, including start
bit, address of slaver (7 bits) and necessary task (the other
8 bits). Command code is presented at Table 1.
- Slaver receives and performs. Slaver must send
feedback to master, which is comprised of 16 bits: start bit,
self-address of slaver (7 bits) and finished task (the other 8
bits). There are two types of finished task: if it is data
transmission task (power), the 8-bit-structure is comprised
of: bit ‘0’ + 7 bits containing data (for example active
power), if it is order task, it’ll transmit 8 bits of ‘1’.
- Within 3s, in the case that Master cannot receive
information from slavers, then repeat the sending process.
After 3 times of repeating, if master cannot still receive,
sending - receiving process is considered to be failed.
Table 1. Command code of some tasks
Order
Transmission of active power
Transmission of reactive power
Tripping the 1st device
Tripping the 2nd device
…
Tripping the 6th device
Connecting the 1st device
Connecting the 2nd device
…
Connecting the 6th device
Command code
11111111
11110000
11000001
11000010
…
11100000
10000001
10000010
…
10100000
Some remarks should be retained:
- The time of a half circle of power system (50Hz): 10ms;
- The maximal length of each range of pulse (equivalent
to 1 bit): 4ms;
- The time to send information (16 bits); 16x10=160ms;
- The time for Master and a slaver encodes information
is negligeable.
Clearly, length of a range of information is negligible
in comparation with the time of a circle (4/10=40%);
thereby, there’s no risk of overlapping pulses. The time to
conduct completely an order (sending an order, performing
the order, receiving feedback) takes 160x2=320ms=0.32s.
With load control and information acquisition (power), this
amount of time is also negligible.
Experiment on devices were carried out at our
laboratory (PLC devices are in different rooms). The orders
in Table 1 were carried out.
After days of experiment, the difference between
sending signals from slaver and receiving ones of master is
negligible. Switching signals are performed precisely.
With the presence of making-noise devices; such as
drilling machine, grinding machine, etc.; the system
operates well. In the test of the influence on ‘sensitive’
devices: such as TV; there appears no negative effect.
Measuring results of harmonics when the system operates
proves that the Vietnam quality criterion of guaranteed.
5. Conclusion
In the paper, the authors propose a proper method of
design for power-line communication on distribution
network. The authors also built a practical experiment
model. The model proves to be reliable with high accuracy
when it is utilized for communication in a building.
The devices based on the result of the study can be
applied for acquiring comptometer index of households
from a transformer station 22/0.4 kV. Besides, they can be
used for controlling home electric devices in order to save
the power. This is the aim of future research.
REFERENCES
[1] G. Shafiullah, A. Oo, A. Ali and P. Wolfs, "Smart Grid for a
Sustainable Future”, Smart Grid and Renewable Energy, Vol. 4 No.
1, 2013, pp. 23-34 doi: 10.4236/sgre.2013.41004.
[2] H. Ferreira, L. Lampe, J. Newbury, and T. Swart, “Power line
communications: Theory and applications for narrowband and
broadband communications over power lines”, John Wiley and
Sons, 2010.
[3] Mainardi E. and Bonfe M., Power line communication in homebuilding automation systems, www.intechopen.com.
[4] Texas Instruments, FSK Modulation and Demodulation with the
MSP430 Microcontroller, Application Report, 1998.
[5] Watkins-Johnson Company, FSK: Signals and Demodulation, Technotes, Vol.7, No. 5, 1980.
[6] Rieken, David W., and Michael R. Walker. "Ultra low frequency
power-line communications using a resonator circuit." Smart Grid,
IEEE Transactions on 2.1 (2011): 41-50.
[7] Texas Instruments, Powerline communication Analog Front-End.
[8] Microchip, X-10 Home automation using the PIC16F877A
[9] Truong Van Tam, Electric Circuit, Lecture note.
(The Board of Editors received the paper on 26/10/2014, its review was completed on 30/10/2014