Analysis of land availability for utility scale power plants and assessment of solar photovoltaic development in the state of arizona, USA (2)
Bạn đang xem bản rút gọn của tài liệu. Xem và tải ngay bản đầy đủ của tài liệu tại đây (2.75 MB, 46 trang )
Accepted Manuscript
Analysis of land availability for utility-scale power plants and assessment of solar
photovoltaic development in the state of Arizona, USA
Debaleena Majumdar, Martin J. Pasqualetti
PII:
S0960-1481(18)31014-0
DOI:
10.1016/j.renene.2018.08.064
Reference:
RENE 10491
To appear in:
Renewable Energy
Received Date: 20 March 2018
Revised Date:
12 July 2018
Accepted Date: 17 August 2018
Please cite this article as: Majumdar D, Pasqualetti MJ, Analysis of land availability for utility-scale power
plants and assessment of solar photovoltaic development in the state of Arizona, USA, Renewable
Energy (2018), doi: 10.1016/j.renene.2018.08.064.
This is a PDF file of an unedited manuscript that has been accepted for publication. As a service to
our customers we are providing this early version of the manuscript. The manuscript will undergo
copyediting, typesetting, and review of the resulting proof before it is published in its final form. Please
note that during the production process errors may be discovered which could affect the content, and all
legal disclaimers that apply to the journal pertain.
ACCEPTED MANUSCRIPT
M
AN
US
C
RI
PT
Analysis of land availability for utility-scale power
plants and assessment of solar photovoltaic
development in the State of Arizona, USA
Debaleena Majumdar
TE
D
School of Geographical Sciences and Urban Planning
Arizona State University, Tempe, AZ 85287, USA
Email:
Phone: 765-337-8330
EP
Martin J. Pasqualetti
AC
C
Professor, School of Geographical Sciences and Urban Planning
Senior Sustainability Scientist, Julie Ann Wrigley Global Institute of Sustainability
Director, Energy Policy Innovation Council (EPIC)
Arizona State University, Tempe, AZ 85287, USA
Email:
Phone: 480-965-4548
ACCEPTED MANUSCRIPT
1
2
Analysis of land availability for utility-scale power plants and assessment of solar
photovoltaic development in the State of Arizona, USA
3
4
Abstract
Solar photovoltaic (PV) can help meet the growing demand for clean electricity in Arizona. This
paper answers where solar PV development has taken place in Arizona, how much suitable land
is available for utility-scale PV development, and how future land cover changes can affect the
availability of this suitable land. PV development suitability scores are calculated for the land
across Arizona based on topography, location, solar resource and public opinion factors. Ground
truthing is used to identify the scenario which best explains Arizona’s PV power plant
developments from several decision-making scenarios. Less than two percent of Arizona's land is
considered Excellent for PV development. Most of this land is private land or owned by state
trust. If the available suitable land is fully developed with solar PV, Arizona has the potential to
become a regional energy hub. However, in the next few decades suitable areas for solar PV
generation can get rapidly depleted due to conflict with growing urban areas. If the suitable land
for PV generation is not set-aside, Arizona would then have to depend on less suitable lands,
look for multi-purpose land use options and distributed PV deployments to meet its future energy
need.
19
20
Keywords: Solar PV; Arizona; GIS; Multi-Criteria Analysis (MCA); site suitability analysis;
public opinion
21
Introduction
22
23
24
25
26
27
28
29
30
31
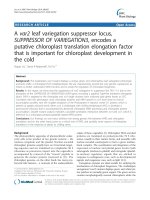
Arizona has abundant sunlight when compared to most places in the USA and Europe (Figure
1(a)). The Global Horizontal Irradiance (GHI) of Arizona is almost double that of Germany
(Figure 1(b)). Arizona could thus ideally generate the same amount of power as Germany with
half the cost in terms of requirement of photovoltaic (PV) modules or with half the space
required by Germany to install the PV modules. However, in reality, Germany generates 38.7
TWh (Terawatt-hour) of electricity from solar PV while Arizona only produces 3.75 TWh
(Federal Ministry for Economic Affairs and Energy, 2016; U.S. Electric Power Data for 2016).
Arizona also has other advantages in terms of weather characteristics such as the least cloudiness
and number of days with precipitation in the continental USA which is amicable for PV
development (Brettschneider, 2015).
32
33
34
35
36
37
38
It is projected that Arizona’s population will rise anywhere between 40-80% in by 2050
(Population Projections, 2016). With the growth of population, the total annual energy demand
of the residential, commercial and industrial sectors would increase by an additional 30-60 TWh
(terawatt-hours) by 2050 (Figure 2). This is double the total energy consumed by the residential
sector currently. As of 2015 Arizona’s total electricity use was 77.3 TWh (Arizona Energy
Factsheet, 2017). In times of this growing energy demand, the Navajo Generating Station which
is the largest coal powered facility in Arizona is expected to be decommissioned in 2019
AC
C
EP
TE
D
M
AN
US
C
RI
PT
5
6
7
8
9
10
11
12
13
14
15
16
17
18
1
ACCEPTED MANUSCRIPT
primarily due to the challenges of tightening emissions standards and competitive pricing of
cleaner energy options like solar PV and natural gas (AZ Central, 2013; Stone, 2017).
41
42
43
44
45
46
47
48
49
50
51
52
53
54
55
Arizona with its ample solar radiation also has the potential to become a regional energy hub
(Millard, 2017). An integrated western regional grid covering 14 western U.S. states which
includes Arizona, Canada’s British Columbia and Alberta provinces, and part of Baja California
state in Mexico is being planned to meet ambitious renewable energy goals (WECC, 2016;
Pyper, 2017). The regional western grid will have significant environmental and economic
benefits, including cost savings to ratepayers, reduced air pollution, and new jobs (Senate Bill
350 Study, 2016). Arizona’s neighboring state California wants 50% of their electricity from
renewable energy sources by 2030. California’s legislature has started to talk about increasing
this to 100% in keeping with the consent of most Californians (Millard, 2017). California’s
current electricity use is about 290 TWh annually which is about four times that of Arizona
(California Energy Commission, 2016). The total electricity use in the planned integrated
western regional grid is about 883 TWh annually (WECC, 2016). California now imports onethird of its electricity supply from neighboring states. The emergence of Arizona as one of the
major exporters of clean energy like from solar PV to neighboring states like California, which
have set aggressive plans for renewable energy use, would be key to meet future energy needs.
56
57
58
59
60
61
62
63
64
65
66
67
68
69
70
71
72
73
74
75
76
77
78
79
In this paper we propose development of utility-scale PV systems as an option to help meet the
growing demand for low-carbon electricity in Arizona. According to National Renewable Energy
Laboratory (NREL), the cost of utility-scale systems in U.S. is $1.03/W (US dollars/Watt)
compared to $2.80/W for residential PV systems (Fu et al., 2017). The economic benefit due to
size of utility-scale PV systems makes PV development option an attractive option when
compared to residential and commercial developments (Rogers and Wisland, 2014). The size of
a utility-scale solar PV facility can vary a lot (Donnelly-Shores, 2013). To build such facilities
the first and foremost requirement is the availability of suitable land for PV development.
Several studies have been conducted in recent years at different locations around the world to
find land area suitable for PV development (Table 1). The land area suitable for PV development
significantly varied based on location. For example, Tahri et al. (2015) showed that more than
59% of the land is ‘highly suitable’ for PV field projects in Southern Morocco. In contrast, Oman
Charabi and Gastli (2011) concluded that only 0.5% of the total land had ‘high suitability’ level
for PV installations. Suh & Brownson (2016) concluded that all solar project development is
local and specific knowledge of locale is essential for solar development projects. A recent study
by Carlisle et al. (2013) also showed that public opinion can be a factor that can influence the
availability of suitable land for PV development. In this paper, to aid the development of clean
solar PV in Arizona we focus on three major research questions: 1. How much of Arizona’s land
is suitable for solar PV development?; 2. How much electricity demand can the suitable land
meet if solar PV is developed?; 3. How do public opinion influence the availability of suitable
land?; and 4. How would land cover change affect the availability of suitable land in future? The
goal of this paper is to take a step towards identifying the least conflicted solar PV development
areas in Arizona which can inform future policies directed towards sustainable land use for clean
energy (Pearce et al., 2016; Hernandez et al., 2015a).
AC
C
EP
TE
D
M
AN
US
C
RI
PT
39
40
2
ACCEPTED MANUSCRIPT
80
Methodology
Different methods have been used to find suitable places for development of utility-scale solar
power plants (Vafaeipour et al., 2014). Trained Artificial Neural Network (ANN) was used by
Ouammi et al. (2012) to predict the annual solar radiation for the purpose of identifying suitable
sites. Grossmann et al. (2013) proposed a method of optimal site selection of solar power plants
across huge geographical areas with the aim to overcome intermittency in different time zones.
Trapani and Millar (2013) considered feasibility of offshore PV systems floating in sea assuming
land availability limitations. Bakos and Soursos (2002) reviewed one of the largest gridconnected PV systems in Greece and examined the benefits of the site for investors, owners,
operators, users and renewable energy system industry. However, the most extensively used
tools to find suitable land areas for solar PV development are Geographic Information Science
(GIS) and Multi-Criteria Analysis (MCA) (Table 1). GIS can handle, process, and analyze large
quantities of spatial data, which helps energy planners and decision makers in the spatial
allocation and site selection of solar PV development (Charabi, & Gastli, 2011). MCA is
commonly used to resolve complex problems with multiple conflicting criterions to find feasible
or best-case scenarios like finding optimal sites for PV plants (Asakereh et al., 2014; Boroushaki
& Malczewski, 2008). All GIS and MCA studies adopted a two-step approach. The first step is
to identify the factors and constraints for PV development such as location (distance from
transmission lines, distance from roads etc.), topography (slope etc.) and land use (military,
agricultural etc.) and find the suitable area. Once the suitable area is identified based on these
factors and constraints, the studies tried to determine the energy that can be generated using solar
PV in this suitable land in the second step. We adopted a similar two-step approach in this study.
In this study we however include public opinion as factors for analysis and try to understand its
influence on availability of suitable land for PV development (Carlisle et al., 2013). In addition,
this study shows the effect future of land cover changes on land available for PV development in
Arizona.
106
107
108
109
110
111
112
113
114
115
116
117
118
119
120
121
Table 2 and Table 3 gives details about the constrained areas and data sources. Table 2 lists all
the data sources used to identify the constrained land. Table 3 lists the areas of the constrained
zones in each category. About 55% of Arizona’s land is constrained for PV development (Figure
3). The constraint areas are based on a) land cover and land ownership; b) wildlife, wilderness
and recreational areas; c) places of cultural and historical importance; d) roads, highways and
railways; e) rivers and wetlands; and f) areas affected by natural and weather hazards. Forest and
National, State & Local Parks (land cover and land ownership) makes most of the constrained
area, i.e. about 25% of Arizona’s land. This land also includes all the national trails. Only 2.4%
of Arizona’s land is constrained by development. Rivers and 0.5-mile area beside it are
considered as constraints to conserve the river banks and to reduce the chances of flooding in the
PV power plant. This is also consistent with NGD/NSO (No Ground Disturbance/No Surface
Occupancy) recommendation for Colorado River which prohibits ground disturbing activities
with the 0.5-mile buffer on either side (Bureau of Land Management, 2006). A 200 ft zone
beside the wetlands is considered as constrained area. Even though we select a uniform no
development buffer zone across all wetlands in Arizona, wetland protection buffer zones can
vary from 50ft to 300 ft., depending on the type of wetland and its location (Castelle, 1992). The
AC
C
EP
TE
D
M
AN
US
C
RI
PT
81
82
83
84
85
86
87
88
89
90
91
92
93
94
95
96
97
98
99
100
101
102
103
104
105
3
ACCEPTED MANUSCRIPT
land within 0.05 mile from any road, highway or railway is also considered unsuitable for
development. This is to incorporate the effect of the width of road, highway or railway as GIS
data is available as lines. This also leaves some space from the road to the location of PV
development site for construction and future maintenance of the PV panels at the side of the
road, highway or railway. The safety standpoint is also considered as the glare from the PV
panels can sometimes visually affect the drivers (Palmer and Laurent, 2014). High risk or high
frequency areas affected by natural and weather hazards like wildfires, earthquake, dust storm
and flash floods are considered constrained zones for PV development. Any land in the
constrained area is given ‘0’ point. Any land receiving ‘0’ point for any of the constraints or
factors is considered unsuitable for PV development. This is implemented using the conditional
statement in the raster calculator module of the spatial analytics software ArcGIS (ESRI, 2017).
133
134
135
136
137
138
139
140
141
142
143
144
145
146
147
148
149
150
151
152
153
154
155
156
157
158
159
160
161
162
163
164
To find how much of Arizona’s land is suitable for solar PV development, the suitability factors
were next identified based on topography, location, solar resource and public opinion. The slope
and aspect of land is a critical topographical factor that can govern the suitability of a land for
PV development. NREL (National Renewable Energy Laboratory) suggests that utility scale PV
systems require fairly flat land with slopes less than 3% (Rico, 2008). Hernandez et al. (2015b)
considered land with a slope less than 5% (2.9 degrees) as suitable land for PV development and
the rest as unsuitable. Charabi and Gastli (2011) considered land with slope less than 5 degrees
(8.75%) as suitable land. Lands with higher slopes create a shadow effect on panels in the next
row and hence adversely affect the system output (Noorollahi et al., 2016). In general, lands with
higher slope and facing north have a lower priority because of this shadow effect. PV system
developers generally prefer south facing slopes for lands with higher slope (Kiatreungwattana et
al., 2013). The difference in total energy produced by a south facing and a north facing slope is
about 8% for a slope of 8.75% (5 degrees) (Grana, 2016). The slope of the land also has an
impact on construction costs. In this study, land with slopes less than 3% is considered most
suitable for PV development and is given ‘3’ points. Land with slope in between 3-5% is given a
‘2’ points. South facing land with a higher slope in between 5-8.75% is also scored ‘2’. North
facing land with slope in between 5-8.75% has ‘1’ point (Figure 4). The unsuitable land, i.e. land
with slope greater than 8.75% (5 degrees) receives ‘0’ points. There are 65 operating PV power
plants in Arizona as per Energy Information Administration (EIA Powerplants, 2018). Most of
the land where PV power plants are developed in Arizona have a suitability score of ‘3’ points
with respect to slope and aspect. For each factor, the land is given a suitability score of ‘3’ if all
the 17 studies listed in Table 1 give it a high suitability score and it also meets the NREL’s
suggestion for development of utility scale PV systems. The land with a suitability score of ‘2’
does not meet the NREL’s suggestion but at least received moderate suitability scores in 75% of
the studies, i.e. 13 studies out of 17 in Table 1. The land with a suitability score of ‘1’ does not
meet the NREL’s suggestion but receives low suitability scores or is considered not suitable for
PV development in 50% of the studies, i.e. 9 studies out of 17 in Table 1. The land is given a
suitability score of ‘0’ if it does not meet the NREL’s suggestion and receives lowest suitability
scores or is considered unsuitable for PV development in 75% of the studies, i.e. 13 studies out
of 17 in Table 1. We follow the same criterion based on previous studies for all the other
topographical and location factors. In this study all factors are scored on a scale of 0-3, based on
the suitability of the land for PV development.
AC
C
EP
TE
D
M
AN
US
C
RI
PT
122
123
124
125
126
127
128
129
130
131
132
4
ACCEPTED MANUSCRIPT
The location of the land based on proximity to transmission lines and to roads, highways or
railways is also a major factor that can influence site suitability for PV development. A distance
of 3 miles and less from a transmission line is generally considered suitable and yields
acceptable economics for overall PV system development (Rico, 2008; Kiatreungwattana et al.,
2013). Note that most of the existing PV power plants in Arizona is within 3 miles from the
transmission lines (Figure 5a). NREL suggests a more stringent criterion in which the distance of
a suitable PV development site should be less than 1 mile from the transmission lines
(NREL/EPA, 2017). Only 25 existing power plants is within the 1 mile distance from
transmission lines. Hernandez et al. (2015b) in their PV site suitability study for California,
assumed that a 10-km (about 6 miles) development zone on each side of a transmission line as
suitable. If the distance to transmission is more, solar PV may not be viable due to the additional
cost associated with connecting the system to the grid. Depending on the line voltage level and
the length of the transmission line, the costs can range from $50,000 to $180,000 per mile of the
additional length of transmission line (Rico, 2008). Also, while 2-3 years or less is required to
construct a utility-scale solar plant, planning, permitting, and constructing new high-voltage
transmission lines can take up to 10 years or more (Hurlbut et al., 2016). Hence solar PV
developers face difficulties securing financing without having access to the transmission
network. In this study, land within 1 mile of the transmission line is given ‘3’ points. Likewise,
land within 1-3 miles and 3-6 miles are given ‘2’ and ‘1’ points respectively (Figure 5a). The
unsuitable area, i.e. any land beyond 6 miles from the transmission line, is given ‘0’ points.
185
186
187
188
189
190
191
192
193
194
195
196
197
198
199
200
201
202
203
The distance to road, highway or railway is a factor during the installation phase of development
as contractor vehicles and emergency vehicles may find it difficult to access the site
(NREL/EPA, 2017). If the distance to road, highway or railway is more than a mile, the
additional cost associated with developing access roads may make solar PV development costprohibitive. Hernandez et al.'s (2015b) study considered land within 5 km (about 3 miles) to be
suitable. In this study land within a mile from any road, highway or railway is considered highly
suitable and is given ‘3’ points (Figure 5b). Most of the existing PV power plants is within 1
mile from a mile from a road, highway or railway. The land within 1-3 miles from any road,
highway or railway is given a score of ‘2’. Land above distance of 5 miles from any road,
highway or railway is considered unsuitable for PV development and is given ‘0’. The land
within 0.05 mile from any road, highway or railway is also considered unsuitable for
development and is treated as a constrained land for reasons mentioned earlier in this manuscript
(Figure 5b). It is worth mentioning here that BLM (Bureau of Land Management) conducted a
study to find land suitable for PV development in BLM administered lands in six southwestern
states: Arizona, California, Colorado, Nevada, New Mexico, and Utah (BLM Solar Energy
Program, 2014). It was based more on eliminating the constrained areas for development and did
not consider the distance from the transmission lines, roads, highways or railways as a factor in
their analysis. Based on the development of PV power plants in Arizona till date, low slopes and
proximity to roads are considered more important than proximity to transmission lines.
204
205
206
GHI (Global Horizontal Irradiance) is also considered a factor in this study (Figure 6). The
average GHI in Arizona is 2055 kWh/m2 per year. Most of the land in southern Arizona receives
radiation more than the state average and is given ‘3’ points. 61 of the 65 PV power plants
AC
C
EP
TE
D
M
AN
US
C
RI
PT
165
166
167
168
169
170
171
172
173
174
175
176
177
178
179
180
181
182
183
184
5
ACCEPTED MANUSCRIPT
developed in Arizona is in this zone. All studies consider such a land to be highly suitable for
utility-scale PV development. The two largest PV power plants in Arizona, i.e. Agua Caliente
Solar and Mesquite Solar 1 project are in the southern part of the state and receives GHI of 2147
and 2139 kWh/m2 per year respectively Most of northern part of Arizona has GHI lower than the
state average and is given a score of ‘2’. Land receiving solar radiation 15% below the state
average is given ‘1’ point, which is only 0.3% of Arizona’s land. This land is in the Grand
Canyon National Park where utility scale PV cannot be developed anyway. Since all the land in
Arizona receives solar radiation higher than what is received on average by Germany, none of
the land is considered unsuitable for PV development based on the incoming solar radiation.
216
217
218
219
220
221
222
223
224
225
226
227
Public opinion is also considered as a factor in this analysis (Figure 7). The buffer distances were
selected based on the public opinion survey by Carlisle et al. (2013). A suitability score of ‘3’ is
given to locations which have majority of the public support. Only 19% of the respondents
supported building a PV power plant within 1-mile from wildlife while 45% supported within 5
miles. Colorado Parks & Wildlife and BLM in some cases have recommended a 0.5-mile
restriction zone for activities in some months of a year near certain wildlife areas (Energy, 2013).
Similarly, development of PV plant received only 8.5% support within 0.25 miles from wetlands
and about 22% support within 1 mile. The 0.25-mile and 1-mile buffer zones near the developed
areas, places of cultural and historical importance and areas for recreational activities also
showed low public approval for PV development. It is worth a mention here that solar PV has
low to moderate not-it-my-backyard complaints when compared to other renewable energy
sources (Price, 2017).
228
229
230
231
232
233
234
235
236
237
238
239
A suitability scorecard with all the factors is shown in Table 4. The layout is similar to EPA’s
smart growth scorecard to find suitable land for development (EPA: Smart Growth, 2017). The
suitability scores in all the factors were added in the ‘Raster Calculator’ module of ArcGIS
(ESRI, 2017). Any area that lies in the constrained zone would automatically get a score of ‘0’.
All the layers of information are converted to raster formats with 100 m spatial resolution. Six
different levels of suitability are used to show the degree of suitability of a land for PV
development. Any land which received a full score in all the factors is considered an ‘Excellent’
land for PV development. Likewise, any land which receives 90% or more of the full score is
considered ‘Very Good’; with 80% or more is ‘Good’; 70% or more is ‘Average’; 60% or more
is ‘Below Average’ and less than 60% is considered ‘Poor’. The weights of the factors (Column
2 of Table 4) and criterions (Column 1 of Table 4) are varied and eight different decisionmaking scenarios are compared and analyzed:
240
241
242
Scenario 1A: All factors carry equal weight (Wtopo-SA = 1; Wloc-TL, Wloc-R = 1; Wres-GHI = 1; WPOWild, WPO-WL, WPO-Dev, WPO-CH, WPO-Rec = 1). Here public opinion has more influence in the
decision-making process as it has more factors.
243
244
245
Scenario 1B: Public opinion factors are not considered in the decision-making process. All other
factors have equal weight (Wtopo-SA = 1; Wloc-TL, Wloc-R = 1; Wres-GHI = 1; WPO-Wild, WPO-WL, WPODev, WPO-CH, WPO-Rec = 0)
AC
C
EP
TE
D
M
AN
US
C
RI
PT
207
208
209
210
211
212
213
214
215
246
6
ACCEPTED MANUSCRIPT
Scenario 2A: All factors carry equal weight, but solar radiation is given double the weight
(Wtopo-SA = 1; Wloc-TL, Wloc-R = 1; Wres-GHI = 2; WPO-Wild, WPO-WL, WPO-Dev, WPO-CH, WPO-Rec = 1)
249
250
251
Scenario 2B: Public opinion factors are not considered in the decision-making process. All other
factors carry equal weight, but solar radiation is given double the weight (Wtopo-SA = 1; Wloc-TL,
Wloc-R = 1; Wres-GHI = 2; WPO-Wild, WPO-WL, WPO-Dev, WPO-CH, WPO-Rec = 0)
252
253
254
Scenario 3A: All criterions carries equal weight (Wtopo-SA = 1; Wloc-TL, Wloc-R = 0.5; Wres-GHI = 1;
WPO-Wild, WPO-WL, WPO-Dev, WPO-CH, WPO-Rec = 0.2). Here public opinion has the same influence
as other criterions in the decision-making process.
255
256
257
Scenario 3B: Public opinion is not considered as a criterion. All other criterions have equal
weight (Wtopo-SA = 1; Wloc-TL, Wloc-R = 0.5; Wres-GHI = 1; WPO-Wild, WPO-WL, WPO-Dev, WPO-CH, WPORec = 0)
258
259
260
Scenario 4A: All criterions carries equal weight, but solar resource is given double the weight
(Wtopo-SA = 1; Wloc-TL, Wloc-R = 0.5; Wres-GHI = 2; WPO-Wild, WPO-WL, WPO-Dev, WPO-CH, WPO-Rec =
0.2)
261
262
263
Scenario 4B: Public opinion is not considered as a criterion. All other criterions carry equal
weight, but solar radiation is given double the weight (Wtopo-SA = 1; Wloc-TL, Wloc-R = 0.5; Wres-GHI
= 2; WPO-Wild, WPO-WL, WPO-Dev, WPO-CH, WPO-Rec = 0)
264
265
266
267
268
269
270
271
272
273
274
275
276
277
278
279
280
281
282
283
284
285
Public opinion factors are considered important in the scenarios 1-4A. It is not considered a
factor in scenarios 1-4B, like in previous studies. Scenario A’s represent scenarios with public
opinion while scenario B’s represent similar scenarios without public opinion. We kept a
consistent 3-point scale for all the parameters so that all parameters have the same influence
when given equal weights. In previous studies, the weightages given to the various factors and/or
criterions vary significantly. Solar radiation is given more importance in decision making in
scenarios 2 and 4. Studies like Carrion et al. (2008), Tahri et al. (2015) and Charabi and Gastli
(2011) gave most of the weight to the incoming solar radiation, thus making any land receiving
high solar radiation more suitable for PV development. Scenarios 2B and 4B resemble such
studies. Recent studies like that by Noorollahi et al. (2016) have given only about 35% weight to
the climate and gave more importance to factors like location. Sánchez-Lozano et al. (2013,
2014) in fact in both studies made ‘location’ the most important criterion in PV site selection.
Scenarios 1B and 3B are similar to such studies. With so much variability in between studies, the
question is which of the scenarios 1-4B, best explain the development of PV power plants in
Arizona. Assuming PV installers in Arizona till date made the best possible decision without
considering public opinion, we adopt a ground truthing approach to find how many existing PV
power plants are in the different suitability categories for each of these scenarios (Vajjhala,
2006). The scenario which shows the maximum number of existing PV power plants in the high
suitability categories, is considered as a representation of Arizona’s PV development criterion.
Here we adopt an inverse problem solving approach where we start with multiple scenarios
based on information in existing literature and find which scenario best represents the PV
development till date. All studies listed in Table 1 have adopted a forward problem solving
AC
C
EP
TE
D
M
AN
US
C
RI
PT
247
248
7
ACCEPTED MANUSCRIPT
approach, in which the weights are first obtained based on the method adopted and suitability of
the land is calculated based of those weights. Most studies have used the analytical hierarch
process (AHP) to calculate these weights.
289
Results and Discussion
290
291
292
293
294
295
296
297
298
299
300
301
302
303
304
305
306
307
308
309
310
311
312
313
314
315
316
317
318
319
320
321
322
323
324
Figure 8 shows the effect of the decision-making scenarios on land available for PV
development. Only 0.3% of Arizona's land meet all the criterions (Excellent land in Scenarios 14A). When public opinion is not considered, 1.8% of the land meet all the criterions (Excellent
land in Scenarios 1-4B). Hence inclusion of public opinion in the decision-making process
significantly reduces the area of Excellent land. However, public opinion improves the overall
suitability scores of the land for PV development in Arizona contrary to what was intuitively
expected. Most of the land falls in Very Good and Good suitability levels in all A scenarios
which consider public opinion compared to B scenarios which do not consider public opinion.
Scenario 1B, which does not take public opinion factors into account, has more of average,
below average and poor lands (more blue and yellow areas compared to Scenario 1A in Figure
8). Table 5 shows the number of existing PV power plants in the different levels of suitability for
the various scenarios. For A scenarios with public opinion, none of the existing power plants is
in the Excellent Land. Most of them lie in the Very Good and Good land. Scenario 1B represents
the scenario where most of the existing PV power plants is in the Excellent, Very Good and
Good areas. Assuming PV installers in Arizona made the best possible decision without
considering public opinion, Scenario 1B best represents Arizona’s PV development criterion.
Scenario 1 also represents the scenario which shows the maximum influence of public opinion
(difference between A and B scenarios) on the number of PV power plants in the Excellent, Very
Good and Good land. We hence present the results of Scenario 1A and 1B in the rest of
manuscript to maintain brevity. Note that an extensive optimization study on finding the best
values of weights for the various factors can be performed which may result in the best ground
trusting scenario. However we do not expect the overall trends to be very different. We
individually varied the weights of each factor in scenario 1B by 10% and observed that the
number of power PV plants in the respective levels of suitability remained the same. Also the
scenarios which gave more weight to incoming solar radiation (Scenarios 2 and 4), performed
lower than expected when ground truthing was done with existing PV power plants. From the
table presented in Figure 8, giving more weight to the solar resource in the decision-making
process, however increases the area of land in the Very Good class. Thus, land in the less
suitable classes improve its suitability level if more weight is given to the solar resource
compared to other factors/criterions. Depending on the decision-making scenario only 3.9-8.2%
of Arizona’s land is considered Excellent and Very Good for PV development. Scenario 3B and
Scenario 2A respectively shows the least and highest amount of Excellent and Very Good land
combined. In total, 82.4% of Arizona’s land is unsuitable for PV development. It is higher than
the 55% of the land shown to be constrained in Figure 3. This is due to additional unsuitable land
based on the factors like high slope and distance from transmission lines and roads.
325
326
Most of the Excellent and Very Good land for PV development is private or is owned by state
trust (Figure 9). Though Indian reservation has very little Excellent land, it has considerable
AC
C
EP
TE
D
M
AN
US
C
RI
PT
286
287
288
8
ACCEPTED MANUSCRIPT
Very Good suitable areas for solar PV development. For Scenarios 1A and 1B, about 3% and 9%
of the total Excellent land in all ownership lies in the Indian Reservation. Note public opinion
factors are not considered in Scenario 1B while it has more influence in the decision-making
process in Scenario 1A. At the county level, the ownership of land suitable for PV development
varies significantly. For instance, in the Cochise County, most of the Excellent and Very Good
areas for PV development falls in private and state trust lands. On the other hand, in Mohave
County, most of Excellent and Very Good lands is BLM-administered. In Coconino County,
most of Excellent and Very Good lands is in the Indian reservation. Till date 57 out of the 65
operating PV power plants in Arizona is in private land (Table 6). The size of the PV power
plants vary significantly from 0.9 MW to 347.7 MW.
337
338
339
340
341
342
343
344
BLM administered lands are expected to change in future because of human activities
(Protecting BLM Lands, 2017). Energy development is one of the major prospects that is being
considered on BLM lands (BLM Solar Energy Program, 2014). BLM till date has identified 19
Solar Energy Zones as priority areas for utility scale solar PV development in Arizona,
California, Colorado, Nevada, New Mexico, and Utah (BLM Solar Energy Zones, 2018). Solar
Energy Rule by BLM which became effective in 2017, aims to bring down the cost of the rates
and fees paid by solar developers on BLM-managed land and also allows for a competitive
bidding processes (BLM Solar Energy Factsheet, 2018).
345
346
347
348
349
350
351
352
Indian reservation land is now the home to the largest coal powered plant (NVG - Navajo
Generating Station) in the western US, which is expected to be decommissioned in 2019 due
tightening emissions standards. Solar PV development can be pursued in Indian Lands to
accommodate for the energy deficit and to generate local employment due to decommissioning
of NVG. The Kayenta Solar Project is the only solar PV plant in Arizona on the Indian Land. It
demonstrates that the Navajo Nation is ready for large scale PV development (Sunnucks, 2018).
However, PV development on Indian reservation land can remain hindered without accounting
for Indian values, intratribal and tribal–nontribal politics (Pasqualetti et al., 2016).
353
354
355
356
357
358
359
360
361
362
363
364
365
366
367
Arizona's most populated counties, namely the Maricopa, Pima, and Pinal, all currently have
substantial amount Excellent and Very Good land for PV development (Table 7). Thus, a part of
the growing energy need associated with the rise of population in Arizona's major population
centers could be met with solar PV. However, per capita land availability for PV development in
the populated counties is much lower when compared to counties having much lower population
like Cochise, Graham, La Paz and Greenlee. Hence, populated counties have to depend on
counties with lower population to meet their requirement for additional energy associated with
population growth. Till-date most of the operating PV power plants have been built in the
Maricopa and Pima counties followed by the Pinal county (Table 7). Thus, more populated
counties have more PV development until now. Spreading PV power generation plants across the
entire landscape of the state of Arizona is more ideal and would lead to less serious disturbances
in PV power production throughout the state due to weather fluctuations (Wirth and Schneider,
2018). Meanwhile, in the populated Maricopa, Pima, and Pinal counties in Arizona, the amount
of Excellent and Very Good land available for utility scale solar PV development is expected to
shrink significantly as urban land use expands (Table 8). Land with low slopes, which is suitable
AC
C
EP
TE
D
M
AN
US
C
RI
PT
327
328
329
330
331
332
333
334
335
336
9
ACCEPTED MANUSCRIPT
for PV development, is also the preferred land for urban development. Thus, in those counties,
Excellent and Very Good lands for PV development would only be available in BLM and Indian
reservation in future. As mentioned earlier, solar PV development in the BLM and Indian
reservation land is limited till date, with most development on private lands in Arizona. Thus, the
population centers are expected to gradually lose the potential to benefit from one of the major
attributes of solar PV, i.e. generating electricity at the point of consumption. If solar PV
development in the BLM and Indian reservation land remain limited in the near future, it would
be beneficial for the populated counties to set aside some of the state owned and/or private land
for future PV development in Arizona. This can be something similar to California's ‘Land
Conservation Act’ ( with the goal to
conserve the Excellent and Very Good land for solar PV development. The Land Conservation
Act provides relief of property tax to owners of the land in exchange for an agreement that the
land will not be developed or converted to another use.
381
382
383
384
385
386
387
388
389
390
391
392
393
394
395
396
Solar energy zone (SEZ) and renewable energy zone (REZ) are being identified at various
locations across the US, though not with the idea of setting aside the land for future solar PV
development. SEZ is limited to BLM-administered lands only. REZs were first identified at
some locations in Texas and is a similar concept with the supposed goal to help in future
transmission line planning. This study takes into consideration, proximity to transmission lines as
a factor while identifying the suitable land for PV development. It might benefit Arizona if the
scope of concepts like SEZ is extended to include all land ownership types with the goal to set
aside the Excellent and Very Good lands for future energy production. Otherwise, in future
populated counties in Arizona might have to depend on land with lower suitability for PV
development. One other possibility for populated counties would be to meld solar energy
production with agriculture in a multi-purpose land use option called “agrivoltaics” (Majumdar
and Pasqualetti, 2018). Distributed generation, where individual homes, farms, or businesses
have their own solar PV units to generate electricity, can also eliminate some of the dependency
associated with energy-land use nexus. However, distributed deployments even though feasible
at any geographic location, is not as cost-effective as utility-scale PV development on suitable
land (Rogers and Wisland, 2014).
397
398
399
400
401
402
403
404
405
406
407
408
409
The type of PV panel used is critical to the amount of energy that can be generated by a PV
power plant. Mesquite Solar 1 (2016), a utility-scale PV power plant located in Maricopa
County, uses Suntech's multi-crystalline solar panels with an efficiency of 20.3% during the
power generation process. The Agua Caliente Solar Project (2016) in Yuma County uses thinfilm technology PV panels manufactured by First Solar which has an efficiency of 16.8%. The
type of the panel used can have a significant effect on the energy density (GWh/acre-year –
gigawatt-hours per acre per year) of the PV power plant (Table 9(a)). Mesquite Solar 1 generates
about 1.5 times the energy per unit area when compared to the Agua Caliente Solar Project. The
maximum GHI received in the suitable Excellent area is 2187 kWh/m2 per year. The location of
maximum GHI can generate 0.32 or 0.47 GWh/acre depending on whether the panel used is
similar to the Agua Caliente Solar PV Project or the Mesquite Solar 1 Project. Both Agua
Caliente Solar PV Project and the Mesquite Solar 1 Project are located in areas of high GHI. All
the Excellent land is in locations of high GHI. In all the scenarios, more than 90% of the areas
AC
C
EP
TE
D
M
AN
US
C
RI
PT
368
369
370
371
372
373
374
375
376
377
378
379
380
10
ACCEPTED MANUSCRIPT
designated as Very Good and Good for PV development would generate within 10% of this
maximum energy. Hence for the suitable land incoming solar radiation is less of a critical factor
in Arizona compared to the type of PV panel used in the power plant.
413
414
415
416
417
418
419
420
421
422
423
424
425
426
427
428
429
Table 9(b) shows the amount of energy that can be generated in the suitable land using solar PV
for Scenarios 1A and 1B. All the Excellent land might not have the capability to generate the
future energy demand in Arizona using solar PV based on the decision-making scenario. With
the current available land, the Very Good land is more than capable of meeting Arizona's energy
demand in the future (Figure 2) and also make Arizona a regional energy hub exporting clean
energy like solar PV to neighboring states like California. In fact the Agua Caliente solar project,
which is the largest photovoltaic (PV) power plant in Arizona, sells the entire power generated
by the plant under a 25 year power purchase agreement (PPA) to a California based utility
company Pacific Gas & Electric (PG&E). However, in the next few decades suitable areas for
solar energy generation can get rapidly depleted due to conflict with rapid growth of urban areas
(Table 8). For example, in the Maricopa County (most populous county in Arizona) which
currently has most of the PV plants, the Excellent land available in private ownership would
reduce from 53189 acres now to 62 acres in 2060 (i.e. a reduction of more than 99%) due to
increase in built-up area in the future. Thus, with time as Arizona rapidly urbanizes, a conflict is
expected between urban and solar PV development. As mentioned earlier, if the more suitable
land is not set-aside, Arizona would then have to depend on less suitable lands, multi-purpose
land use options and distributed deployments to meet the future energy need with solar PV.
430
Conclusions
431
432
433
434
435
436
437
438
439
440
441
442
In this paper we propose utility-scale solar PV system development as an option to meet the
growing demand for low-carbon electricity in Arizona. This study is the first thorough
investigation on how much of Arizona's land is suitable for utility scale PV development and its
electricity generation potential for multiple decision making scenarios. An integrated western
regional grid covering 14 U.S. states which includes Arizona is being planned to meet ambitious
renewable energy goals. For these goals to succeed Arizona has to become the regional
renewable energy hub. The information presented is a step in that direction. This study also
analyzes the effect of public opinion factors on PV site selection and gives a quantification on
the influence it can have on the decision making process. The study also shows the conflict
between future urban development and land available for solar PV deployment in future. Its
influence on land available for PV development is analyzed. The findings are expected to
influence policy recommendations for renewable energy development in future.
443
444
445
446
447
448
449
GIS (Geographic Information System) and Multi-Criteria Analysis (MCA) are used to find the
suitable land for solar PV development based on several decision-making scenarios. Ground
truthing is used to identify the scenario which best explains Arizona’s PV power plant
developments till date. The areas constrained for PV development are identified based on land
cover and land ownership; wildlife, wilderness and recreational areas; places of cultural and
historical importance; roads, highways and railways; rivers and wetlands; and areas affected by
natural and weather hazards. Forest and National, State & Local Parks makes most of the
AC
C
EP
TE
D
M
AN
US
C
RI
PT
410
411
412
11
ACCEPTED MANUSCRIPT
constrained area, i.e. about 25% of Arizona’s land. PV development suitability scores are
calculated for the land across Arizona based on topography, location, solar resource and public
opinion factors. Based on the suitability scores, the land is classified in several suitability levels
namely Excellent, Very Good, Good, Average, Below Average or Poor for PV development.
Less than 2% Arizona’s land is considered Excellent for PV development. Public opinion
improved the overall suitability scores of the land for PV development in Arizona. Most of the
Excellent and Very Good land is owned privately or is owned by state trust. The ownership of
the suitable land for PV development varies from one county to another. Arizona's most
populated counties, namely the Maricopa, Pima, and Pinal, all currently have substantial amount
of Very Good land for PV development. However, per capita land availability for PV
development in the most populated counties is significantly lower when compared to counties
having lower population. In the populated counties, the amount of Excellent and Very Good land
available for utility scale solar PV development is expected to reduce significantly as urban areas
expand in future. Thus, in the populated counties, Excellent and Very Good lands for PV
development would only be available in BLM and Indian reservation in future. Solar PV
development in the BLM and Indian reservation land is limited till now and has been mostly
developed on private lands in Arizona. With the development of Kayenta Solar Project in Indian
Reservation and identification of Solar energy zones (SEZ) in BLM Lands, it is likely that Indian
Reservation and BLM lands would be the places to develop large scale PV projects in future.
With the current available land, the Excellent and Very Good lands are capable of meeting
Arizona's energy demand in the future and also make Arizona a regional energy hub that can
export clean energy from solar PV to neighboring states like California. As urban Arizona grows
with time, the state might have to depend on less suitable lands, multi-purpose land use options
and distributed deployments to meet the future energy need with solar PV.
474
475
476
477
This study provides an initial assessment of the suitable land that is available and what can be
expected in future. Conversations with local stakeholders and alignment of PV development with
local planning efforts would aid to identify the least conflicted zones for utility scale PV
electricity generation in Arizona.
478
Acknowledgement
479
480
The authors would like to thank Dr. Meagan Ehlenz, Dr. David Pijawka and Dr. Randall
Cerveny from Arizona State University for their valuable inputs during the build-up of this work.
481
References
482
483
Agua Caliente Solar Project. 2016. />
484
485
486
Aly, A., Jensen, S.S., & Pedersen, A.B. 2017. Solar power potential of Tanzania: Identifying
CSP and PV hot spots through a GIS multicriteria decision making analysis. Renewable Energy,
113, 159-175.
AC
C
EP
TE
D
M
AN
US
C
RI
PT
450
451
452
453
454
455
456
457
458
459
460
461
462
463
464
465
466
467
468
469
470
471
472
473
12
ACCEPTED MANUSCRIPT
Arizona Energy Factsheet. 2017. />
489
490
491
Asakereh, A., Omid, M., Alimardani, R., & Sarmadian, F. 2014. Developing a GIS-based Fuzzy
AHP Model for Selecting Solar Energy Sites in Shodirwan Region in Iran. Int J Adv Sci
Technol, 68, 37-48.
492
ASU GIS Data Repository. 2016. />
493
494
AZ Central. 2013. US 'falling out of love' with coal says ASU professor.
/>
495
496
497
Bakos, G.C., & Soursos, M. 2002. Technical feasibility and economic viability of a gridconnected PV installation for low cost electricity production. Energy and Buildings, 34(7), 753758.
498
499
BLM Solar Energy Factsheet. 2018. />
500
BLM Solar Energy Program. 2014. />
501
BLM Solar Energy Zones. 2018. />
502
BLM Western Solar Plan (GIS Shapefiles). 2015. />
503
504
Brettschneider, B. 2015. Brian B's Climate Blog - />
505
506
507
Boroushaki, S., & Malczewski, J. 2008. Implementing an extension of the analytical hierarchy
process using ordered weighted averaging operators with fuzzy quantifiers in ArcGIS.
Computers & Geosciences, 34(4), 399-410.
508
509
Bureau of Land Management. 2006. Resource Management Plan Amendment & Environmental
Impact Statement. Volume II. 131 pages.
510
511
California Energy Commission. 2016. Total System Electric Generation.
/>
512
513
Carlisle, J., Joe, J., Kane, S., Koehler, D., & Solan, D. 2013. PVMapper: Report on the Second
Public Opinion Survey (No. INL/EXT-13-30706). Idaho National Laboratory (INL).
514
515
516
517
Carrion, J. A., Estrella, A.E., Dols, F.A., Toro, M.Z., Rodríguez, M., & Ridao, A.R. 2008.
Environmental decision-support systems for evaluating the carrying capacity of land areas:
Optimal site selection for grid-connected photovoltaic power plants. Renewable and Sustainable
Energy Reviews, 12(9), 2358-2380.
518
Castelle, A.J. 1992. Wetland buffers: use and effectiveness.
519
520
Charabi, Y., & Gastli, A. 2011. PV site suitability analysis using GIS-based spatial fuzzy multicriteria evaluation. Renewable Energy, 36(9), 2554-2561.
521
522
Donnelly-Shores, P. 2013. What does ‘Utility-Scale Solar’ really mean?
/>
523
EIA Powerplants. 2018. />
AC
C
EP
TE
D
M
AN
US
C
RI
PT
487
488
13
ACCEPTED MANUSCRIPT
Energy, PDC. 2013. Wildlife and Vegetative Impact Analysis. OA Project No. 013-0036.
/>
527
EPA: Smart Growth. 2017. />
528
529
ESRI 2017. ArcGIS Desktop: Release 10.5. Redlands, CA: Environmental Systems Research
Institute.
530
531
Federal Ministry for Economic Affairs and Energy. 2016. Bundesministerium für Wirtschaft und
Energie – Zeitreihen zur Entwicklung der erneuerbaren Energien in Deutschland. Germany.
532
533
534
Fellows, L.D. 2000. Earthquake Hazard in Arizona.
/>
535
536
FEMA. 2010. Arizona Division of Emergency Management and Military Affairs.
/>
537
538
539
Fu, R., Feldman, D., Margolis, R., Woodhouse, M., & Ardani, K. 2017. U.S. solar photovoltaic
system cost benchmark: Q1 2017. Golden, Colorado, USA: National Renewable Energy
Laboratory (NREL).
540
541
Garni, H.Z. Al, & Awasthi, A. 2017. Solar PV power plant site selection using a GIS-AHP based
approach with application in Saudi Arabia. Applied Energy, 206, 1225-1240.
542
Grana, P. 2016. How much less efficient are north-facing solar modules? Solar Power World.
543
544
545
Grossmann, W.D., Grossmann, I., & Steininger, K.W. 2013. Distributed solar electricity
generation across large geographic areas, Part I: A method to optimize site selection, generation
and storage. Renewable and Sustainable Energy Reviews, 25, 831-843.
546
547
548
Hernandez, R.R., Hoffacker, M.K., Murphy-Mariscal, M.L., Wu, G.C., & Allen, M.F. 2015a.
Solar energy development impacts on land cover change and protected areas. Proceedings of the
National Academy of Sciences, 112(44), 13579-13584.
549
550
Hernandez, R.R., Hoffacker, M.K., & Field, C.B. 2015b. Efficient use of land to meet
sustainable energy needs. Nature Climate Change, 5(4), 353-358.
551
552
553
Hurlbut, D., Chernyakhovskiy, I., & Cochran, J. 2016. Renewable Energy Zones: Delivering
Clean Power to Meet Demand, Greening the Grid (No. NREL/FS-6A20-65988). NREL
(National Renewable Energy Laboratory), Golden, CO (United States).
554
555
Janke, J.R. 2010. Multicriteria GIS modeling of wind and solar farms in Colorado. Renewable
Energy, 35(10), 2228-2234.
556
557
Kareemuddin, M., & Rusthum, S. 2016. Solar PV Optimum Site Selection using Remote Sensing
Data, GIS and Image Processing Techniques. IJITR, 4(2), 2812-2823.
558
559
560
Kiatreungwattana, K., Mosey, G., Jones-Johnson, S., Dufficy, C., Bourg, J., Conroy, A., Keenan,
M., Michaud, W. and Brown, K. 2013. Best Practices for Siting Solar Photovoltaics on
Municipal Solid Waste Landfills.
AC
C
EP
TE
D
M
AN
US
C
RI
PT
524
525
526
14
ACCEPTED MANUSCRIPT
Land-cover Modeling Data from USGS-EROS. 2016. Center />
563
564
Lader, G., Raman, A., Davis, J.T., & Waters, K. 2016. Blowing dust and dust storms: one of
Arizona's most underrated weather hazards. NOAA Technical report, NWS-WR-290.
565
566
567
Lott, M.C. 2010. Quantifying the economic and environmental tradeoffs of electricity mixes in
Texas, including energy efficiency potential using the Rosenfeld effect as a basis for evaluation.
Masters dissertation, The University of Texas at Austin.
568
569
Majumdar, D., & Pasqualetti, M.J. 2018. Dual use of agricultural land: Introducing ‘agrivoltaics’
in Phoenix Metropolitan Statistical Area, USA. Landscape and Urban Planning, 170, 150-168.
570
571
572
Merrouni, A.A., Amrani, A.I., & Mezrhab, A. 2017. Electricity production from large scale PV
plants: Benchmarking the potential of Morocco against California, US. Energy Procedia, 119,
346-355.
573
574
Mesquite Solar 1. 2016. />
575
576
Millard, J.A. 2017. Here’s how Arizona can become a regional energy hub.
/>
577
National Land Cover Database (NLCD).
578
NED. 2015. />
579
580
581
Noorollahi, E., Fadai, D., Akbarpour Shirazi, M., & Ghodsipour, S. H. 2016. Land Suitability
Analysis for Solar Farms Exploitation Using GIS and Fuzzy Analytic Hierarchy Process (FAHP)
- A Case Study of Iran. Energies, 9(8), 643.
582
583
NREL/EPA. 2017. Screening Sites for Solar PV Potential: RE-Powering America's Land
Initiative. />
584
585
Ouammi, A., Zejli, D., Dagdougui, H., & Benchrifa, R. 2012. Artificial neural network analysis
of Moroccan solar potential. Renewable and Sustainable Energy Reviews, 16(7), 4876-4889.
586
587
Palmer, C & Laurent, C. 2014. Solar and Glare. Meister Consultants Group, Inc.
/>
588
589
590
Pasqualetti, M.J., Jones, T.E., Necefer, L., Scott, C.A., & Colombi, B.J. 2016. A paradox of
plenty: Renewable energy on Navajo Nation Lands. Society & Natural Resources, 29(8), 885899.
591
592
593
Pearce, D., Strittholt, J., Watt, T., & Elkind, E. 2016. A Path Forward: Identifying Least-Conflict
Solar PV Development in California’s San Joaquin Valley.
/>
594
595
596
Platts: Electric Transmission Lines. 2015.
/>ion_Lines.pdf
AC
C
EP
TE
D
M
AN
US
C
RI
PT
561
562
15
ACCEPTED MANUSCRIPT
Population. 2016.
/>
599
Population Projections. 2016. />
600
601
Price, S. 2017. What’s the best renewable energy for you?
/>
602
Protecting BLM Lands. 2017. />
603
604
605
Pyper, J. 2017. Can California Achieve 100% Renewable Electricity by 2040? Jerry Brown
Thinks So. />
606
607
Rico, P. 2008. Assessing the Potential for Renewable Energy Development on DOE Legacy
Management Lands.
608
609
Rogers, J., & Wisland, L. 2014. Solar power on the rise: the technologies and policies behind a
booming energy sector. Union of Concerned Scientists (Report), 16 pages.
610
611
612
Sabo, M. L., Mariun, N., Hizam, H., Radzi, M.A.M., & Zakaria, A. 2016. Spatial energy
predictions from large-scale photovoltaic power plants located in optimal sites and connected to
a smart grid in Peninsular Malaysia. Renewable and Sustainable Energy Reviews, 66, 79-94.
613
614
615
Sánchez-Lozano, J.M., Antunes, C.H., García-Cascales, M.S., & Dias, L.C. 2014. GIS-based
photovoltaic solar farms site selection using ELECTRE-TRI: Evaluating the case for Torre
Pacheco, Murcia, Southeast of Spain. Renewable Energy, 66, 478-494.
616
617
618
619
Sánchez-Lozano, J.M., Teruel-Solano, J., Soto-Elvira, P.L., & García-Cascales, M.S. 2013.
Geographical Information Systems (GIS) and Multi-Criteria Decision Making (MCDM) methods
for the evaluation of solar farms locations: Case study in south-eastern Spain. Renewable and
Sustainable Energy Reviews, 24, 544-556.
620
Seismic-Hazard Maps for the Conterminous United States. 2014. />
621
622
Senate Bill 350 Study. 2016. The Impacts of a Regional ISO -Operated Power Market on
California. />
623
624
Stone, W. 2017. Coal Industry makes pitch to keep Navajo Generating Station open.
/>
625
626
627
Suh, J., & Brownson, J. R. 2016. Solar Farm Suitability Using Geographic Information System
Fuzzy Sets and Analytic Hierarchy Processes: Case Study of Ulleung Island, Korea. Energies,
9(8), 648.
628
629
630
Sunnucks, M. 2018. Navajos, SRP to double solar energy plant, ink big renewable deal. Energy.
/>
631
632
633
Tahri, M., Hakdaoui, M., & Maanan, M. 2015. The evaluation of solar farm locations applying
Geographic Information System and Multi-Criteria Decision-Making methods: Case study in
southern Morocco. Renewable and Sustainable Energy Reviews, 51, 1354-1362.
634
635
The National Register Geospatial Dataset. 2017. National Register of Historic Places />
AC
C
EP
TE
D
M
AN
US
C
RI
PT
597
598
16
ACCEPTED MANUSCRIPT
Trapani, K., & Millar, D.L. 2013. Proposing offshore photovoltaic (PV) technology to the energy
mix of the Maltese islands. Energy Conversion and Management, 67, 18-26.
638
639
U.S. Electric Power Data for 2016. U.S. Energy Information Administration.
/>
640
641
US Energy Efficiency. 2013. />
642
643
USDA. 2013. West wide wildfire risk assessment. USDA Forest Service, Oregon Department of
Forestry and the Sanborn Map Company.
644
645
Uyan, M. 2013. GIS-based solar farms site selection using analytic hierarchy process (AHP) in
Karapinar region, Konya/Turkey. Renewable and Sustainable Energy Reviews, 28, 11-17.
646
647
648
Watson, J.J., & Hudson, M.D. 2015. Regional Scale wind farm and solar farm suitability
assessment using GIS-assisted multi-criteria evaluation. Landscape and urban planning, 138, 2031.
649
650
WECC (Western Electricity Coordinating Council). 2016. State of the Interconnection.
/>
651
652
653
654
Wirth, H., & Schneider, K. 2018. Recent facts about photovoltaics in Germany. Report from
Fraunhofer Institute for Solar Energy Systems, Germany.
/>
655
656
657
658
Vafaeipour, M., Zolfani, S.H., Varzandeh, M.H.M., Derakhti, A., & Eshkalag, M.K. 2014.
Assessment of regions priority for implementation of solar projects in Iran: New application of a
hybrid multi-criteria decision making approach. Energy Conversion and Management, 86, 653663.
659
660
Vajjhala, S.P. 2006. ‘Ground Truthing’ Policy: Using Participatory Map-Making to Connect
Citizens and Decision Makers. Resources-Washington DC, 162, 14.
661
662
663
Yushchenko, A., De Bono, A., Chatenoux, B., Patel, M.K., & Ray, N. 2017. GIS-based
assessment of photovoltaic (PV) and concentrated solar power (CSP) generation potential in
West Africa. Renewable and Sustainable Energy Reviews.
665
M
AN
US
C
D
TE
EP
AC
C
664
RI
PT
636
637
17
ACCEPTED MANUSCRIPT
Table 1. Studies using Geographic Information Science (GIS) and Multi-Criteria Analysis (MCA) to find land suitable for PV
development
Uyan (2013)
Asakereh et al.
(2014)
Hernandez et al.
(2015b)
Tahri et al. (2015)
Watson and Hudson
Suitable Land Area for PV
development
RI
PT
SC
M
AN
U
Sánchez-Lozano et
al. (2013), SánchezLozano et al. (2014)
Oman
Suitability Levels termed as highly
suitable, moderately suitable,
marginally suitable and unsuitable
Southeast Spain (Cartagena area, Initially classified into suitable and
Murcia area)
unsuitable areas. Suitable areas
further classified as poor, good,
very good and excellent
Divided into four classification
Turkey (in Karapinar region of
categories – low suitable,
Konya Province in the Central
moderate, suitable and best suitable
Anatolia)
Iran (Shodirwan region)
Suitable land was classified into 3
classes – moderate, good and
highly suitable
California
Divided into compatible,
potentially compatible and
incompatible areas
Southern Morocco
Divided into 5 categories –
unsuitable, marginally suitable,
suitable, moderately suitable and
highly suitable
South-central England
Divided into 4 categories - not
D
Charabi and Gastli
(2011)
TE
Janke (2010)
Land Suitability levels for PV
development
Spain (plateau of Granada, in the Classified into seven classes
district of Huescar)
ranging from worst zone to better
zone
Colorado
Classified into six classes based on
model scores
EP
Carrion et al. (2008)
Study Area
AC
C
Study
191 km2 of the state had model
scores that were in the 90 - 100%
range
0.5% of the land area is highly
suitable
3.2% as excellent and 9.59% as
very good land to implement solar
PV
13.92% of the land area is best
suitable for solar farms while
15.98% is suitable land
13.98% and 3.79% of the land area
demonstrate high and good
suitability levels respectively
5.38% is compatible for PV
development
59% of the land is highly suitable
Most suitable accounted for 9.3%
ACCEPTED MANUSCRIPT
(2015)
suitable, least suitable, moderately
suitable and most suitable category
Iran
Suh & Brownson
(2016)
Ulleung Island, Korea
Kareemuddin &
Rusthum (2016)
Garni & Awasthi
(2017)
India (Ranga Reddy District of
Telengana)
Saudi Arabia
Merrouni et al.
(2017)
Eastern Morocco
Aly et al. (2017)
Tanzania
Yushchenko et al.
(2017)
Rural areas of West Africa
Five levels of suitability: excellent,
good, fair, low and poor level
Initially classified into suitable and
unsuitable areas. The suitable area
is further classified as moderate,
good, very good and excellent
based on incoming solar radiation
Seven classes of suitability were
used – most extremely suitable;
extremely suitable; very strongly
suitable; strongly suitable;
moderately suitable; marginally
suitable and constraint areas.
Seven different land suitability
levels were used
Five categories of suitability were
used – least suitable, marginally
suitable, moderately suitable,
highly suitable and most suitable
Four categories were used –
marginally suitable, suitable,
moderately suitable and highly
suitable
Four suitability categories were
used – most suitable, suitable,
moderately suitable, and least
suitable
Four suitability categories were
used – best suitable, suitable,
moderately suitable, and less
RI
PT
Noorollahi et al.
(2016)
Sabo et al. (2016)
of the non-constraint area while
moderately suitable accounted for
72.3% of the non-constraint area
14.7% and 17.2% of the land were
classified as excellent and good
7.64% of the area under study is
suitable
AC
C
EP
TE
D
M
AN
U
SC
Peninsular Malaysia
Extremely suitable area accounted
for 1.6% of the study area
About 1% of the land is most
suitable while 8% is highly
suitable.
The highly suitable sites make up
19% of the study area. Moderately
suitable sites make up 23% of the
land area.
2.2% of the study area was most
suitable while 7.28% of the area
was suitable
ACCEPTED MANUSCRIPT
AC
C
EP
TE
D
M
AN
U
SC
RI
PT
suitable
ACCEPTED MANUSCRIPT
Table 2. Data source of constraint areas for solar PV development
AC
C
TE
Dust storm
Flood
EP
M
AN
US
C
Roads, highways and railways
Major rivers
Wetlands
Wildfire
Earthquake
D
Areas for wildlife
BLM designated wilderness and
conservation areas
BLM designated areas of critical habitat and
environmental concern
BLM designated areas for recreational
activities
BLM designated visual resource
management areas
Places of cultural and historical importance
Data Source
2011 National Land Cover Dataset (NLCD)
2011 National Land Cover Dataset (NLCD)
ASU GIS Data Repository (2016)
ASU GIS Data Repository (2016)
ASU GIS Data Repository (2016) &
2011 National Land Cover Dataset (NLCD)
ASU GIS Data Repository (2016)
BLM Western Solar Plan (2015)
RI
PT
Constraint
Developed areas
Areas for crop cultivation and hay/pasture
Military land
National, state and local parks
Forest areas
BLM Western Solar Plan (2015)
BLM Western Solar Plan (2015)
BLM Western Solar Plan (2015)
The National Register Geospatial Dataset
(2017), ASU GIS Data Repository (2016),
BLM Western Solar Plan (2015)
ASU GIS Data Repository (2016)
ASU GIS Data Repository (2016)
2011 National Land Cover Dataset (NLCD)
USDA (2013)
Seismic-Hazard Maps for the Conterminous
United States (2014), Fellows (2000)
Lader et al. (2016)
FEMA (2010)
ACCEPTED MANUSCRIPT
Table 3. Areas of constraints for solar PV development. The areas are shown in Figure 3.
AC
C
EP
TE
D
M
AN
US
C
Developed area
Areas for crop cultivation and hay/pasture
Military land
National, state and local parks
Forest areas
Areas for wildlife
BLM designated wilderness and conservation areas
BLM designated areas of critical habitat and environmental concern
BLM designated areas for recreational activities
BLM designated visual resource management areas
Places of cultural and historical importance
Roads, highways and railways
Major rivers and 0.5-mile area beside it
Wetlands and 200ft area beside it
Wildfire (high risk areas)
Earthquake (high risk areas)
Dust storm (high frequency areas)
Flood (high hazard areas)
Area in acres
(% of total area)
1721647 (2.4 %)
1267060 (1.7 %)
2756666 (3.8 %)
2740703 (3.7 %)
16575445 (22.7 %)
1710379 (2.3 %)
2194315 (3 %)
2906159 (4 %)
3101535 (4.2 %)
4840327 (6.6 %)
2476494 (3.4 %)
5729697 (7.9 %)
4609647 (6.3 %)
958092 (1.3 %)
3956811 (5.4 %)
210390 (0.3 %)
287343 (0.4 %)
2578632 (3.5 %)
RI
PT
Constraints
ACCEPTED MANUSCRIPT
Table 4. The suitability scorecard for solar PV development. The score would depend on the scenario analyzed. The weights can differ
based on the scenario.
Factor
Criterion
Topography
Slope and Aspect of land
Less than 3%
In between 3 - 5% and in between 5 - 8.75% (south facing)
In between 5 - 8.75% (north facing)
Above 8.75% (not suitable)
Less than 1 mile
In between 1 - 3 miles
In between 3 - 6 miles
Beyond 6 miles (not suitable)
In between 0.05 - 1 mile
In between 1 - 3 miles
In between 3 - 5 miles
Beyond 5 miles (not suitable)
Greater than 2055 kWh/m2 per year
In between 1750 - 2055 kWh/m2 per year
Less than 1750 kWh/m2 per year
Less than 1 mile
In between 1 - 5 miles
Beyond 5 miles
In between 200ft - 0.25 mile
In between 0.25 - 1 mile
Beyond 1 mile
Less than 0.25 mile
In between 0.25 - 1 mile
Beyond 1 mile
Less than 0.25 mile
In between 0.25 - 1 mile
Beyond 1 mile
Less than 0.25 mile
In between 0.25 - 1 mile
Beyond 1 mile
Distance from wildlife
Distance from wetlands
Distance from developed areas
Distance from places of cultural
and historical importance
Distance from areas for
recreational activities
TE
Public
Opinion
EP
Solar radiation (GHI)
AC
C
Resource
D
Distance from roads, highways and
railways
SC
Distance from transmission lines
M
AN
U
Location
Points
RI
PT
Criterion
3
2
1
0
3
2
1
0
3
2
1
0
3
2
1
1
2
3
1
2
3
1
2
3
1
2
3
1
2
3
Weight
Wtopo-SA
Wloc-TL
Wloc-R
Wres-GHI
WPO-Wild
WPO-WL
WPO-Dev
WPO-CH
WPO-Rec
Total:
Score
(Points x Weight)