A theory of behaviour on progressive ratio schedules, with applications in behavioural pharmacology
Bạn đang xem bản rút gọn của tài liệu. Xem và tải ngay bản đầy đủ của tài liệu tại đây (698.58 KB, 18 trang )
A theory of behaviour on progressive ratio
schedules, with applications in behavioural
pharmacology
C. M. Bradshaw & P. R. Killeen
Psychopharmacology
ISSN 0033-3158
Psychopharmacology
DOI 10.1007/s00213-012-2771-4
1 23
Your article is protected by copyright and
all rights are held exclusively by SpringerVerlag. This e-offprint is for personal use only
and shall not be self-archived in electronic
repositories. If you wish to self-archive your
work, please use the accepted author’s
version for posting to your own website or
your institution’s repository. You may further
deposit the accepted author’s version on a
funder’s repository at a funder’s request,
provided it is not made publicly available until
12 months after publication.
1 23
Author's personal copy
Psychopharmacology
DOI 10.1007/s00213-012-2771-4
REVIEW
A theory of behaviour on progressive ratio schedules,
with applications in behavioural pharmacology
C. M. Bradshaw & P. R. Killeen
Received: 16 March 2012 / Accepted: 3 June 2012
# Springer-Verlag 2012
Abstract
Rationale Mathematical principles of reinforcement (MPR)
provide the theoretical basis for a family of models of
schedule-controlled behaviour. A model of fixed-ratio
schedule performance that was applied to behaviour on
progressive ratio (PR) schedules showed systematic departures from the data.
Objective This study aims to derive a new model from MPR
that will account for overall and running response rates in
the component ratios of PR schedules, and their decline
toward 0, the breakpoint.
Method The role of pausing is represented in a real-time
model containing four parameters: T0 and k are the intercept
and slope of the linear relation between post-reinforcement
pause duration and the prior inter-reinforcer interval; a
(specific activation) measures the incentive value of the
reinforcer; δ (response time) sets biomechanical limits on
response rate. Running rate is predicted to decrease with
negative acceleration as ratio size increments, overall rate to
increase and then decrease. Differences due to type of progression are explained as hysteresis in the control by
The order of authorship is alphabetical. Correspondence may be
addressed to either author.
Electronic supplementary material The online version of this article
(doi:10.1007/s00213-012-2771-4) contains supplementary material,
which is available to authorized users.
C. M. Bradshaw (*)
Psychopharmacology Section, Division of Psychiatry University
of Nottingham B109 Medical School, University of Nottingham,
Nottingham NG7 2UH, UK
e-mail:
P. R. Killeen (*)
Department of Psychology, Arizona State University,
Tempe, AZ 85287-1104, USA
e-mail:
reinforcement rates. Re-analysis of extant data focuses on
the effects of acute treatment with antipsychotic drugs,
lesions of the nucleus accumbens core, and destruction of
orexinergic neurones of the lateral hypothalamus.
Results The new model resolves some anomalies evident in
earlier analyses, and provides new insights to the results of
these interventions.
Conclusions Because they can render biologically relevant
parameters, mathematical models can provide greater power
in interpreting the effects of interventions on the processes
underlying schedule-controlled behaviour than is possible
for first-order data such as the breakpoint.
Keywords Progressive ratio schedule . Mathematical
principles of reinforcement . Mathematical model . Linear
waiting . Hysteresis . Reinforcer magnitude .
Antipsychotics . Nucleus accumbens core . Lesion .
Orexinergic neurones
Introduction
Ratio schedules of reinforcement specify the number of
responses that a subject must emit in order to obtain a reinforcer. In fixed ratio (FR) schedules, this number is an unchanging feature of the schedule, whereas in variable ratio
schedules, it changes unpredictably from one reinforcer to the
next (Ferster and Skinner 1957). In progressive ratio (PR)
schedules, the required number of responses is systematically
increased, typically from one reinforcer to the next (Hodos
1961), but sometimes between sessions (Czachowski and
Samson 1999) or according to some other schedule (e.g. Li
et al. 2003; Richardson and Roberts 1996; Stafford et al.
1998). Responding on PR schedules is generally found to be
well maintained under lower ratios; however, the rate of
responding declines with progressive increases in the ratio
Author's personal copy
Psychopharmacology
requirement, until, eventually, responding ceases altogether.
The ratio at which the subject stops responding is known as
the breakpoint or breaking point (Hodos 1961; Hodos and
Kalman 1963).
PR schedules have found favour among behavioural
neuroscientists interested in the biological basis of motivation and reward processes because of the prima facie relationship between the breakpoint and (a) the subject’s
motivational state (Barr and Philips 1999; Bowman and
Brown 1998; Ferguson and Paule 1997), and (b) the incentive value (Cheeta et al. 1995; Hodos 1961), and magnitude
(Covarrubias and Aparicio 2008; Ferguson and Paule 1997;
Rickard et al. 2009; Skjoldager et al. 1993) of the reinforcer. It
is becoming increasingly apparent, however, that the uncritical use of the breakpoint as an index of motivation or reinforcer value can no longer be justified. The specificity of the
breakpoint as a motivational index is called into question by
its sensitivity to ostensibly non-motivational manipulations
such as changes in the response requirement (Aberman
et al. 1998; Skjoldager et al. 1993) and the ratio step size
(Covarrubias and Aparicio 2008). It has also been noted that
the breakpoint is an intrinsically unreliable measure, being
derived from a single time point during an experimental
session, data from the rest of the session being ignored
(Arnold and Roberts 1997; Killeen et al. 2009). Moreover,
the definition of the breakpoint is arbitrary, there being no
general consensus as to the period of time that must elapse
without a response occurring before the subject may be said to
have truly stopped responding (Rickard et al. 2009).
The ambiguities inherent in the breakpoint may be circumvented by quantitative analyses that take into account
the response rate in each component ratio of the schedule.
Models derived from the mathematical principles of reinforcement (MPR; Killeen 1994) provide a theoretical basis
for such analyses.
Mathematical principles of reinforcement
MPR is a theoretical account of the way in which reinforcers
exert control over operant behaviour. The theory is founded
on three fundamental principles: (1) Reinforcers activate
behaviour; (2) The rate at which organisms can emit operant
responses is limited by biological constraints; and (3) The
contingencies specified by reinforcement schedules determine the ‘coupling’ of reinforcers to operant responses and
to discriminative stimuli. The characteristic patterns of freeoperant responding maintained by classical reinforcement
schedules (e.g. Ferster and Skinner 1957) derive from the
operation of these three principles.
Principles are akin to strategies; models to tactics. Models
are expedients that may be revised as better executions
emerge. The above principles of MPR provide the theoretical
substrate for a family of models of performance maintained
under ratio and interval schedules of reinforcement. The models and their parameters translate the data in terms of those
principles.
The first principle of reinforcement is that incentives
empower behaviour (Killeen 1998). Its first implementation
in a model was the simplest possible: A0ar, where A is
arousal, the behavioural manifestation of incitement; r is
rate of reinforcement; and a is a motivational parameter
called specific activation. Although simple, it is not ad
hoc, as it was derived from prior research on the cumulation
of arousal (Killeen 1979; Killeen et al. 1978). The specific
activation parameter expresses the duration of activation
induced by the delivery of a single reinforcer. It is the primary
motivational parameter, being affected by deprivation, incentive motivation, and pharmacological intervention.
Actual manifestation of that excitement is curtailed under
natural ceilings on response rate. That is the second principle.
It is instantiated in a model holding that response rate is
proportional to the time left available for responding. The
constraints on responding are summarised by the response
time parameter delta, δ, which defines the minimum time that
must elapse between the initiation of two successive responses.
Delta depends on the nature of the manipulandum, and the
dexterity of the organism on it. This realisation yields a version
of Herrnstein’s ‘hyperbolic’ matching law (Herrnstein 1970,
1974; Herrnstein et al. 1997), manifest in Eq. 1 (see below).
The association of responses to reinforcers is summarised
by a coupling coefficient, C, which is specific for any
particular schedule. C, which ranges from 0 to 1, is the
degree of association between responses and reinforcement;
it is derived from the weight beta, β, given to the most recent
response in the reinforcement process (0≤β≤1). Beta is
called the currency parameter, because if it takes a value
of 1, all of the weight of reinforcement is focused on the
particular response that immediately preceded reinforcement. For smaller values, the impact of reinforcement is
spread out over responses before the last one in what is
traditionally called the delay of reinforcement gradient.
The currency parameter is therefore a measure of the steepness of the gradient. It is identical to the hypothetical decay
of ‘eligibility traces’ as used in reinforcement learning models (e.g. Sutton and Barto 1990). The coupling coefficient
tells how much of the credit for a reinforcer is assigned to a
target response class. Since responses are spread out in time
relative to the reinforcer, the coefficient is proportional to
the area under the delay of reinforcement gradient. In ratio
schedules, the reinforcement contingencies make the
responses occurring proximate to reinforcement predominately target responses, ones that are counted by the experimenter,
and the calculation of coupling is straightforward, given in the
next section. On other reinforcement schedules, other unmeasured responses capture some of the reinforcement strength,
Author's personal copy
Psychopharmacology
and different formulas are necessary to compute the coupling,
as shown in Killeen (1994).
Combining the three principles gives the basic predictive
equation (from Killeen 1998, Eq. 6b):
Rẳ
C:ar
d 1 ỵ arị
1ị
with δ>0 (for typical responses, between 0.2 and 0.4 s). If
we define T as the average inter-reinforcer interval, T01/r,
then for FR schedules:
Rẳ
CFRN
d 1 ỵ T =aị
2ị
Section 3 briefly describes MPRs account of performance
on FR schedules, and Section 4 the application of MPR to
performance on PR schedules.
The FR model (Bizo and Killeen 1997)
Bizo and Killeen (1997) developed Eq. 2 for FR schedules,
where rate of reinforcement itself depends on rate of
responding, R, and ratio size, N: T0N/R. Fortunately, in this
case, the positive feedback loop resolved to a simple equation:
Rẳ
CFRN N
:
a
d
3ị
As the ratio requirement N increases, the curve defined
by Eq. 3 rises to a peak before falling linearly to zero (Fig. 1,
upper left panel). It rises because, on ratio schedules, more
and more target responses are strengthened by the reinforcer
as N increases. But early responses, remote from the reinforcer, are strengthened less than those most proximate to it.
The falloff of strength with distance is assumed to be
exponential, or, in the case of discrete responses, geometric, with rate of falloff in that case determined by
beta (β), yielding the coupling coefficient for FR schedules as
CFRN 01−(1−β)N. When β01, coupling is tightly focused on
the last response, and Eq. 1 resolves to a simple inverse linear
relation between R and N.
The value of a governs the slope of the descending limb
of the function (slope0−1/a); the value of δ determines the
intersection of the (extrapolated) descending limb with the
ordinate (intercept01/δ). The intercept with the x-axis, historically called the extinction ratio, and subsequently the
breakpoint, is given by a/δ. As N increases, coupling
increases; at the same time, however, reinforcement rate is
decreasing with N, and that takes its toll at larger values of
N, bending the function down toward 0 at the extinction
ratio.
Equation 3 has proved to be a robust descriptor of performance on FR schedules (Bizo and Killeen 1997; Killeen and
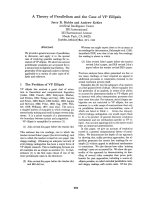
Fig. 1 Theoretical response rate functions; ordinates, response rate, Ri
abscissae, response/reinforcer ratio, N. The upper right graph shows
the progressive ratio (PR) model (Eq. 5, running response rate, RRUN;
Eq. 7, overall response rate, ROVERALL). For comparison, the upper left
graph shows the fixed ratio (FR) model (Eq. 3). The FR model
specifies a linear decline of response rate from its peak towards zero;
δ is the (extrapolated) ordinate intercept, −1/a defines the slope, and the
breakpoint is predicted by a/δ. The locus of the peak is defined by β;
when β01, the function resolves to a straight line extending from 1/δ to
a/δ. Note that in contrast to the FR model, the PR model defines
different curves for RRUN and ROVERALL, and that response rate
declines in a curvilinear fashion towards zero. The middle and lower
graphs show the effects of changes in the four parameters of the PR
model on the curves defined by Eqs. 5 and 7; continuous lines ‘baseline’ functions and broken lines the effect of the changed value of each
parameter. An increase in the minimum post-reinforcement pause, T0,
reduces RRUN, the effect being mainly confined to lower values of N.
An increase in the slope of the linear waiting function, k, results in an
increase of the proportion of the inter-reinforcer interval devoted to
post-reinforcement pausing; the reduction of ROVERALL occurs at all
values of N. A reduction of specific activation, a, is reflected in
steepened decline of both response rate functions. An increase in
response time, δ, produces a parallel downward displacement of both
curves (see text for further explanation)
Sitomer 2003; Reilly 2003). It also provides a passable description of performance on PR schedules (Bezzina et al.
2008; Covarrubias and Aparicio 2008; den Boon et al. 2012;
Ho et al. 2003; Kheramin et al. 2005; Olarte Sánchez et al.
2012a, b; Zhang et al. 2005a,b). The parameters a and δ have
Author's personal copy
Psychopharmacology
been shown to be differentially sensitive to various brain
lesions and acute treatment with different classes of psychoactive drug, offering encouragement to those who would use
this approach to analyse PR schedule performance as a means
of disentangling the effects of neuropharmacological interventions on motivational and motor processes (see Olarte Sánchez
et al. 2012a, b; Zhang et al. 2005a). In some cases, it has been
found that analysis based on Eq. 3 can reveal complex effects
of interventions that are hidden in the breakpoint. For example, atypical antipsychotics (e.g. clozapine, olanzapine) have
been found to increase both a and δ; however, because these
effects exert opposing influences on the breakpoint, that measure is often unaffected by these drugs (den Boon et al. 2012;
Olarte Sánchez et al. 2012a).
On the other hand, there are significant difficulties with
the application of Eq. 3 to PR schedule performance. A
growing body of evidence indicates that empirical response
rate curves deviate systematically from Eq. 3 (Killeen et al.
2009; Rickard et al. 2009). In the next section, the limitations of Eq. 3 as a descriptor of PR schedule performance
are discussed, and solutions offered.
The PR schedule
PR schedules allow the effect of an intervention on behaviour to be assessed within a single session. This is preferable
to testing the effect of the intervention on a series of separate
FR schedules presented in different phases of an experiment, not only because of the saving of experimental time
and effort, but also because the shorter protocol minimises
the contaminating influence of instability of the effects of
interventions over time.
Although the FR model provides a fair description of
performance on PR schedules, it fails to capture some characteristic features of performance on these schedules. For
example, Eq. 3 specifies a linear decline in response rate as a
function of increasing ratio requirement, whereas a number
of studies have found marked concavity of the declining
limb of the response rate curve (e.g. Bezzina et al. 2008;
Killeen et al. 2009; Olarte Sánchez et al. 2012a, b; Rickard
et al. 2009; Zhang et al. 2005a,b). Rickard et al. (2009)
found that while overall response rate on PR schedules
was well described by the bitonic function of Eq. 3, running
response rate declined convexly, not linearly.
As we now understand, the problem is that in the original
statement of MPR (Killeen 1994), Eq. 1 was applied to overall
response rate (ROVERALL): i.e. response rate calculated by
dividing N by the inter-reinforcement interval, T. This works
in steady-state scenarios, such as FR, but is the nub of the
problem in dynamically changing ones, such as PR, especially
when response rates are nonhomogeneous—that is, when they
consist of low rates (during the post-reinforcement pause, of
duration TP) mixed with high rates (the running rate, RRUN
throughout the rest of the ratio).
The impact of the post-reinforcement pause on overall
response rates may be incorporated into the PR model by
invoking the linear waiting principle (Wynne et al. 1996),
which expresses the robust empirical finding that the postreinforcement pause on trial i, TP,i, is a linear function of the
total inter-reinforcement interval on the prior trial, TTOT,i1:
TP;i ẳ T0 ỵ kTTOT;i1 ;
4ị
where T0 is an initial pause due to post-prandial activity or
lassitude, and k is the slope of the linear waiting function
(Schneider 1969). With Eq. 4 in place, we can construct a
model of PR performance.
Running rate is given by Eq. 2. Because on PR
schedules, animals are exposed to long ratio components,
we assume that coupling is quickly driven toward its maximum, and economise on free parameters by setting CPR equal
to 1.0. Then:
1
RRUN;i ẳ
d 1 ỵ TTOT;i1 =a
ð5Þ
Equation 5 comes from Eq. 2 by setting the coupling
coefficient to 1.0, and assuming that run rates depend on the
time between reinforcers in the prior component (see
Appendix 1A). The time between reinforcers is the sum of
the pause time and time to complete the ratio once responding
has commenced (the run time, TRUN):
TTOT;i ẳ TP;i ỵ TRUN
6aị
Pause time is given by linear waiting (Eq. 4), and run
time by the number of responses required, Ni, divided by the
run rate, RRUN,i. Thus,
Run time
Pause time
TTOT;i
zfflfflfflfflfflfflfflfflfflffl}|fflfflfflfflfflfflfflfflfflffl{
¼ T0 ỵ kTTOT;i1 ỵ
z}|{
Ni
RRUN;i
6bị
Substituting the definition of RRUN from Eq. 5 into Eq. 6b
gives:
TTOT;i ẳ T0 ỵ kTTOT;i1 ỵ Ni d 1 ỵ TTOT;i1 =a
6cị
Finally, to predict overall response rate, divide the
response requirement by the predicted duration of the
component:
ROVERALL;i ¼ Ni =TTOT;i
ð7Þ
Equations 5 and 7 are the key predictions. The curves
defined by these equations are illustrated in the upper right
panel of Fig. 1; the effects of changes in each of the four
parameters are shown in the middle and lower panels. A
flowchart for computing these values is in the Appendix.
Author's personal copy
Psychopharmacology
Note that all of the computations involve predicted quantities, and are not drawn from the data. Note also how this
computed version of MPR for PR schedules draws a different prediction than Eq. 2 for FR schedules (cf. Fig. 1, upper
left panel). Now, rather than a linear descent to the x-intercept, it draws a curvilinear decrease toward asymptote. The
curvilinearity arises from the key difference between these
models: Respect for the dependence of behaviour on the
recently experienced conditions (the prior ratio—and its
dependence on the prior ratio …) which are different from
the current conditions. By using this real-time computed
model, MPR can automatically adapt to any sequence of
component lengths in the progression, Ni. If all values of N
are the same—that is, if it is an FR schedule, these computations reduce to those of FR schedules. If they deviate only
a little, as in an arithmetic progression with a small step size,
the FR model works fine. But for the commonly used
exponential progressions, the behaviour on large ratios are
sustained by the recent history of smaller ratios and thus
biassed upward, sustained above the level that could be
maintained at that ratio were it to be presented in a regular
FR schedule. For practical use, the real-time computation,
described by the flowchart in the Appendix and embodied in
the archived spreadsheet, is equally effective, whether dealing with FR or PR schedules.
Equations 5 and 7 constitute a coherent model of performance on PR schedules founded on MPR. The following
section presents a re-analysis of some recent observations on
PR schedule performance based on this model.
Applications
Reinforcer magnitude (Rickard et al. 2009)
Rickard et al. (2009) examined the effect of manipulating
reinforcer magnitude on PR schedule performance. Fifteen
rats were trained under a PR schedule based on the exponential progression described by Roberts and Richardson
(1992). Seven volumes of a 0.6 M sucrose solution (6, 12,
25, 50, 100, 200, and 300 μl) were used as the reinforcer in
different phases of the experiment, each phase lasting for at
least 30 sessions. In the present re-analysis, Eqs. 5 and 7
were fitted to the overall and running response rate data
obtained from each rat, averaged over the last 10 sessions of
each phase.
Figure 2 shows the group mean data; open symbols indicate the running response rates, RRUN, and filled symbols the
overall response rates, ROVERALL. RRUN declines monotonically towards zero, whereas ROVERALL rises to a peak before
descending towards zero. The descent of both RRUN and
ROVERALL towards zero displays marked curvature, consistent
with the PR model. The effect of the magnitude of
reinforcement is clearly evident in the rate of decay towards
zero, larger volumes being associated with more gradual
decline, implicating changes in a with changes in incentive
motivation, as expected. Interestingly, although the height of
the peak of the ROVERALL curve appears to be inversely related
to reinforcer volume, the intercept of the RRUN curve with the
ordinate seems to be unrelated to reinforcer volume. The
goodness of fit of the model was r2 00.991 (Eq. 5, r2 00.991;
Eq. 7, r2 00.976). Note that the same parameter values are
used for those matched predictions.
Figure 3 shows the values of the parameters (mean±SEM)
derived from the fits of the model to the data from the individual rats. There was a significant effect of reinforcer volume on
the specific activation parameter, a [F(6,84)029.4, p<0.001],
which increased as the square root of reinforcer volume. There
was no significant effect of reinforcer volume on the value of δ
[F(6,84)01.1, NS], which remained invariant at a mean of
0.26 s. There was a significant effect on the value of T0 [F
(6,84)017.7, p<0.001], reflecting a monotonic increase of this
parameter with reinforcer volume. The greater the magnitude
of the reinforcer, the longer it took the animal to desist from
post-prandial behaviour and re-engage with the schedule.
There was a significant effect on k [F(6,84)017.2, p<0.001];
except for the smallest magnitude, the proportion of the interval spent pausing increased with reinforcer magnitude.
The relation between a and reinforcer volume is similar
to that found by Rickard et al. (2009) who analysed these
data using the FR model. This result is consistent with the
interpretation of this parameter as an expression of the
incentive value of the reinforcer. The lack of effect of
reinforcer size on δ is consistent with the supposition that
this parameter may be regarded as an index of ‘motor
ability’ (Killeen 1994). Since no manipulations of the lever
or insults to the rats’ motor system were made, this parameter was not expected to vary systematically across phases
of the experiment. An advantage of the present model over
the FR model is that the application of Eq. 5 to running,
rather than overall, response rate enables δ to provide an
index of response capacity that is uncontaminated by postreinforcement pausing (cf. Rickard et al. 2009). The finding
that T0, the intercept in linear waiting, was directly related to
reinforcer volume is predictable, as post-prandial behaviour
associated with larger reinforcers may be expected to contribute to the minimum pause duration. The relative lengthening of the post-reinforcement pause, as reflected in k, the
slope in linear waiting, also increased with the volume of the
reinforcer. Post-prandial behaviour may thus not be the only
aspect of obligatory waiting that is affected by reinforcer
size. Other researchers have reported increases in pausing
on FR (Perone and Courtney 1992) and PR (Baron et al.
1992) schedules as a function of reinforcer magnitude,
increases that were longer than is likely to be accounted for
by post-prandial behaviours.
Author's personal copy
Psychopharmacology
Fig. 2 Effect of the volume of a sucrose reinforcer (0.6 M, 6–300 μl) on
responding on a PR schedule; ordinate, response rate; abscissa, response/
reinforcer ratio. Points are group mean data for 15 rats; unfilled symbols
running response rate, filled symbols overall response rate. Data are from
Rickard et al. (2009), re-analysed using the PR model; the curves are
best-fit functions defined by Eqs. 5 and 7
Effects of antipsychotic drugs (Olarte Sánchez et al. 2012a)
schedule (Roberts and Richardson 1992) was used, with 45mg food pellets as the reinforcer. Two doses of each drug and
an appropriate vehicle control were compared. Each active
treatment was administered on five occasions. In the present
re-analysis, Eqs. 5 and 7 were fitted to the overall and running
response rate data obtained from each rat, averaged over the
five sessions of each treatment condition.
Data recently collected by Olarte Sánchez et al. (2012a) were
used to assess the applicability of the PR model to the acute
effects of psychoactive drugs. These authors examined the
effects of the ‘conventional’ antipsychotic haloperidol, the
‘atypical’ antipsychotic clozapine, and a 5-hydroxytryptamine
(5-HT) receptor antagonist cyproheptadine that has been proposed as an adjunct to conventional antipsychotic treatment
(Goudie et al. 2007). The exponentially incrementing PR
Fig. 3 Effect of reinforcer
volume on the four parameters of
the PR model. The parameters
are derived from the data of
Rickard et al. (2009), re-analysed
using the PR model (see Fig. 2).
Equations 5 and 7 were fitted to
the running and overall response
data from individual subjects.
The points show mean (±SEM)
parameter values from 15 rats
Haloperidol Haloperidol (vehicle, 0.05, 0.1 mg kg−1) was
tested on 11 rats. Figure 4 shows the group mean data for the
Author's personal copy
Psychopharmacology
three conditions. The goodness of fit of the model was r2 0
0.987 (Eq. 5, r2 00.987; Eq. 7, r2 00.981). Figure 5 shows
the parameters (mean±SEM) derived from the data from
individual rats. Haloperidol had no significant effect on the
linear waiting parameters T0 [F<1] and k [F(2,20)01.5,
NS], or the response time parameter δ [F<1]. However,
there was a dose-dependent reduction of a [F(2,20)011.0,
p<0.001].
The outcome of this analysis using the PR model is qualitatively similar to previous examinations of haloperidol’s
effect on PR schedule performance based on the FR model
(den Boon et al. 2012; Mobini et al. 2000; Olarte Sánchez et
al. 2012a; Zhang et al. 2005a), in that a was significantly
reduced in both cases. The reduction of a is consistent with
the notion that conventional antipsychotics reduce the value of
positive reinforcers, an effect that has been attributed to the
blockade of limbic D2 dopamine receptors (Wise 1982, 2006).
However, unlike the previous analysis using the FR model,
the present analysis did not reveal a significant effect on δ,
indicating that the PR model did not detect a motor debilitating effect of haloperidol at these doses.
Clozapine Clozapine (vehicle, 3.75, 7.5 mg kg−1) was tested
on 15 rats. Figure 6 shows the group mean data for the three
treatment conditions. The goodness of fit of the model was
r2 00.977 (Eq. 5, r2 00.978; Eq. 7, r2 00.930). Figure 7 shows
the parameters (mean±SEM) derived from the data from
individual rats. Clozapine had no significant effect on the
linear waiting parameters T0 [F<1] and k [F<1]. However,
there were dose-dependent increases in a [F(2,28)07.4, p<
0.01] and δ [F(2,28)04.5, p<0.02].
The outcome of this analysis is consistent with previous
reports of clozapine’s effect on PR schedule performance
analysed using the FR model (den Boon et al. 2012; Mobini
et al. 2000; Zhang et al. 2005a,b). The effect of clozapine on a
has been attributed to enhancement of the incentive value of
food reinforcers (Zhang et al. 2005a). The pharmacological
basis of this effect remains uncertain, due to clozapine’s
complex pharmacological profile. One possibility is that it
reflects the blockade of 5-HT2A receptors, an action that has
been suggested as the basis of clozapine’s propensity to induce
Fig. 4 Effect of haloperidol
(vehicle, 0.05 and 0.1 mg kg−1)
on performance on a PR
schedule. Points show group
mean data from 11 rats.
Conventions are as in Fig. 2.
Data are from Olarte Sánchez
et al. (2012a), re-analysed
using the PR model
Fig. 5 Effect of haloperidol on the parameters of the PR model. Columns
show group mean+SEM values of the parameters obtained from 11 rats
under treatment with vehicle (white columns), haloperidol 0.05 mg kg−1
(grey columns) and haloperidol 0.1 mg kg−1 (black columns). Significant
difference from vehicle control: *p<0.05. Data are from Olarte Sánchez
et al. (2012a), re-analysed using the PR model
hyperphagia and weight gain in animals and man (Goudie et
al. 2007; Hartfield et al. 2003) and the reputed ability of
clozapine to attenuate anhedonia and other ‘negative symptoms’ of schizophrenia (Corrigan et al. 2003; Meltzer et al.
2003; Müller-Spahn 2002). An increase in a has also been
seen with other atypical antipsychotics, including olanzapine,
ziprasidone and quetiapine (Zhang et al. 2005a), but not
aripriprazole (den Boon et al. 2012); amisulpiride has been
found to exert a time-dependent biphasic effect, an initial
increase in a, probably associated with lower concentrations
of the drug, giving way to a more prolonged reduction of this
parameter (den Boon et al. 2012). Clozapine’s profile of effect
on the motor aspects of performance comprised a significant
increase of δ while T0 and k were unaffected. The effect on δ is
manifest in the decreasing intercepts of the running rate function as a function of dosage. The pharmacological basis of
Author's personal copy
Psychopharmacology
Fig. 6 Effect of clozapine
(vehicle, 3.75 and 7.5 mg kg−1)
on performance on a PR
schedule. Points show group
mean data from 15 rats.
Conventions are as in Fig. 2.
Data are from Olarte Sánchez
et al. (2012a), re-analysed
using the PR model
clozapine’s effect on δ is uncertain. Clozapine has a relatively
low affinity for D2 dopamine receptors and shows little
propensity for inducing extrapyramidal motor side-effects
(Cunningham Owens 1999). A more likely culprit is sedation,
a known side-effect of clozapine, which is probably brought
about by blockade of H1 histamine receptors (Graham et al.
2001).
Cyproheptadine Cyproheptadine (vehicle, 1, 5 mg kg−1) was
tested on 12 rats. Figure 8 shows the group mean data for the
three treatment conditions. The goodness of fit of the model
was r2 00.971 (Eq. 5, r2 00.961; Eq. 7, r2 00.981). Figure 9
shows the parameters (mean±SEM) derived from the data
from individual rats. Cyproheptadine significantly increased
the minimum pause time, T0 [F(2,22)08.4, p<0.01] and reduced the slope of the linear waiting function, k [F(2,22)04.9,
p<0.02]. It also induced significant increases in both a [F
(2,22)011.7, p<0.001] and δ [F(2,22)031.5, p<0.001].
Fig. 7 Effect of clozapine (vehicle, 3.75 and 7.5 mg kg−1) on the
parameters of the PR model. Conventions are as in Fig. 5. Data are from
Olarte Sánchez et al. (2012a), re-analysed using the PR model
Cyproheptadine’s effect on a and δ resembled that of
clozapine, in agreement with the previous analysis of these
results based on the FR model (Olarte Sánchez et al. 2012a).
The increase in a induced by both drugs suggests an increase
in the incentive value of the food reinforcer, consistent with
the proposal by Goudie et al. (2007) that cyproheptadine, like
clozapine, may have a prohedonic effect. However, the incorporation of the linear waiting principle, expressed by the
parameters T0 and k, allows the present PR model to reveal a
subtle difference between the effects of the two drugs on the
motor aspects of operant performance: whereas both drugs
increased the minimum response time, δ, cyproheptadine also
induced a decrease in post-reinforcement pausing that was not
apparent in clozapine’s effect profile.
Nucleus accumbens lesion (Bezzina et al. 2008)
The nucleus accumbens, a key component of the limbic
system, has long been implicated in the regulation of voluntary behaviour, although its relative importance in the motor
and/or motivational processes that govern such behaviour
remains controversial (Baldo and Kelley 2007; Carlezon and
Thomas 2009; Salamone et al. 2007; Wise 2006). Bezzina et
al. (2008) compared the PR schedule performance of rats that
had received lesions of the nucleus accumbens core (AcbC;
n015) with that of sham-lesioned control rats (n014). Lesions
of the AcbC were induced by bilateral microinjections of the
excitotoxin quinolinic acid (0.1 M, 0.5μl). After recovery from
surgery, the rats were trained under the exponentially incrementing PR schedule (Roberts and Richardson 1992) using
45-mg food pellets as the reinforcer. In the present re-analysis,
Eqs. 5 and 7 were fitted to the overall and running response
rate data obtained from each rat, averaged over the last 10 out
of 90 training sessions.
Figure 10 shows the group mean data. For the shamlesioned group, the goodness of fit of the model was r2 0
0.941 (Eq. 5, r2 00.927; Eq. 7, r2 00.921); for the AcbClesioned group, it was r2 00.953 (Eq. 5, r2 00.942; Eq. 7,
r2 00.948). Figure 11 shows the parameters (mean±SEM)
derived from the data from individual rats. The value of T0
Author's personal copy
Psychopharmacology
Fig. 8 Effect of cyproheptadine
(vehicle, 1 and 5 mg kg−1) on
performance on a PR schedule.
Points show group mean data
from 12 rats. Conventions are as
in Fig. 2. Data are from Olarte
Sánchez et al. (2012a),
re-analysed using the
PR model
obtained for the AcbC-lesioned group was significantly
greater than that of the sham-lesioned group [t(27)02.7, p
<0.01]. None of the other parameters differed significantly
between the two groups [k, t(27)00.3; a, t(27)01.9; δ, t
(27)00.6].
Bezzina et al. (2008) analysed these data using the FR
model, and found that δ was significantly higher in the
AcbC-lesioned group than in the sham-lesioned group. In
contrast, the present analysis using the PR model indicates
that the lower peak response rate in the AcbC-lesioned group
is attributable to an increase in the fixed post-reinforcement
pause (T0) rather than an increase in δ. One interpretation of
this finding is that destruction of the AcbC may prolong postprandial behaviour. Alternatively, the lesion may impair the
initiation of extended trains of responses, although the lack of
a significant effect on δ in the present analysis suggests that
the lesion did not prevent the rapid generation of responses,
once a train had been initiated.
The two groups did not differ significantly with respect to
the specific activation parameter, a, either in the present
analysis or in the original analysis by Bezzina et al. (2008)
using the FR model. This suggests that the lesion did not alter
the incentive value of the food reinforcer, a conclusion that is
in accord with recent interpretations of the effect of AcbC
lesions on inter-temporal choice behaviour (Bezzina et al.
2007; Valencia-Torres et al. 2012). However, visual inspection
of the parameter values shown in Fig. 11 suggests that, although the difference was not statistically significant, the
value of a was considerably lower in the AcbC-lesioned rats
than in the sham-lesioned rats. It is possible that the use of
larger groups might have revealed a significant effect on this
parameter, a possibility that may warrant further investigation
in future experiments.
Lateral hypothalamus orexin depletion
(Olarte Sánchez et al. 2012b)
Orexin A and orexin B are neuropeptides that are expressed by
groups of neurones whose somata lie in the lateral hypothalamic area (LHA) and surrounding regions (Date et al. 1999;
De Lecea et al. 1998; Peyron et al. 1998; Sakurai et al. 1998).
Orexinergic neurones project extensively throughout the
Fig. 9 Effect of cyproheptadine (vehicle, 1 and 5 mg kg−1) on the
parameters of the PR model. Conventions are as in Fig. 5. Data are from
Olarte Sánchez et al. (2012a) re-analysed using the PR model
Fig. 10 Performance of sham-lesioned rats (left-hand graph, n015) and
rats with lesions of the nucleus accumbens core (AcbC; right-hand graph,
n014) on a PR schedule. Points show group mean data. Conventions are
as in Fig. 2. Data are from Bezzina et al. (2008), re-analysed using the
PR model
Author's personal copy
Psychopharmacology
Fig. 11 Comparison of the parameters of the PR model between shamlesioned rats and rats with lesions of the nucleus accumbens core
(AcbC). Conventions are as in Fig. 5. Significant difference from the
sham-lesioned group: *p<0.05. Data are from Bezzina et al. (2008),
re-analysed using the PR model
brain, and the two known types of orexin receptor (OX1 and
OX2) are expressed in many brain regions (Trivedi et al.
1998). It has been suggested that a sub-population of orexinergic neurones whose somata lie in the LHA play an important role in regulating the reinforcing value of both food and
drugs (Aston-Jones et al. 2009; Harris and Aston-Jones 2006).
Olarte Sánchez et al. (2012b) examined the effect of destruction these neurones on incentive and motor aspects of operant
behaviour using the PR schedule. Rats were trained under the
exponentially incrementing PR schedule for 110 sessions
before receiving either bilateral injections of the selective
neurotoxin orexin-B-saporin (OxSap, n014) into the LHA
or sham lesions (n015). Training continued for a further 40
sessions after surgery. In the present re-analysis, Eqs. 5 and 7
were fitted to the running and overall response rate data
obtained from each rat, averaged over the last 10 pre-surgical
and the last 10 post-surgical sessions.
Figure 12 shows the group mean data. For the shamlesioned group, the goodness of fit of the model was r2 0
0.983 (Eq. 5, r2 00.978; Eq. 7, r2 00.990); for the OxSaplesioned group, it was r2 00.978 (Eq. 5, r2 00.973; Eq. 7,
r2 00.984). Figure 13 shows the change in the values of the
parameters from the pre-surgical to the post-surgical phase
(mean±SEM) derived from the data from individual rats. T0
did not change significantly in either group; however, the
difference between the two groups, comprising a small reduction in the OxSap-lesioned group and a small increase in the
sham-lesioned group, did achieve statistical significance [t
(27)02.4, p<0.05]. The two groups did not differ with respect
to the post-surgical changes in k [t(27)01.3, NS] or a [t(27)0
0.3, NS]. However the OxSap lesion had a significant effect
on δ; which increased substantially in the lesioned group, and
the pre/post-surgical change scores differed significantly between the two groups [t(27)03.5, p<0.01].
The results of this re-analysis are in general agreement with
analysis of Olarte Sánchez et al. (2012b) based on the FR
model. The lack of a significant change in a suggests that the
lesion had no substantive effect on the incentive value of the
food reinforcer. However, the significant increase in δ in the
lesioned group indicates that destruction of orexinergic neurones of the LHA caused an impairment of motor performance,
consistent with a growing body of evidence that motor effects
may play a more important role in the effects of manipulating
orexinergic function on reinforced behaviour than has previously been recognised (Berridge et al. 2010; Siegel 2004,
2005). Unlike the FR model, the PR model allows suppression
of overall response rates brought about by increases in response time (δ) to be distinguished from suppression brought
about by extended post-reinforcement pausing. It seems from
the present analysis that the effect of the OxSap lesion reflects
a reduction of the capacity to emit rapid sequences of
responses, rather than potentiation of post-prandial pausing,
Fig. 12 Comparison of performance on the PR schedule before and
after surgery in rats that received sham lesions (upper graphs: n014) or
lesions of the lateral hypothalamic area (LHA) induced by intra-LHA
injections of the neurotoxin orexin-B-saporin (OxSap; lower graphs,
n015). Conventions are as in Fig. 2. Data are from Olarte Sánchez et
al. (2012b), re-analysed using the PR model
Author's personal copy
Psychopharmacology
Fig. 13 Comparison of post-surgical changes in the parameters of the
PR model between sham-lesioned rats and rats with lesions of the
lateral hypothalamic area induced by OxSap. Conventions are as in
Fig. 5. Significant difference between groups: *p<0.05; significant
change from pre-surgical baseline: #p<0.05. Data are from Olarte
Sánchez et al. (2012b) re-analysed using the PR model
since T0 was not increased by the lesion; indeed it was, if
anything, slightly reduced.
Discussion
The consilience of data and model seen in the even-numbered
figures are gratifying to us as theoreticians, yet may understandably strike a few readers as mere curve-fitting. But they
are more than that, as each of the parameters is tightly constrained by that close fit, and each delivers theoretically important information about the state of the animal. Behaviour
on PR schedules, or any other schedule, is of no intrinsic
interest. What that behaviour says about the appetite and
ability of an animal is of major importance. Equations 5 and
7 translate that behaviour into statements concerning the states
of the organisms that are of central concern to psychopharmacologists: measures of incentive motivation (a), motor ability
(δ), surfeit (T0), and relative readiness to initiate a bout of
responding (k).
breakpoint measure implies. Indeed, display of the data in
those figures was curtailed at the ratio where half the animals
had met the investigators’ criterion for breakpoint. Is there not
a paradox here? The time to complete a ratio, given by Eq. 6c,
strongly affects the time to complete the next ratio, creating a
positive feedback loop that exponentially lengthens the time
between reinforcers, as graphically depicted in Fig. 7 of
Stafford and Branch (1998) and Figs. 2, 3 and 4 of Killeen
et al. (2009). This positive feedback of pausing makes the
system brittle, unlike interval schedules where a single response after a long delay is likely to be immediately reinforced. On ratio schedules, momentary flagging of motivation
brings the reinforcer no closer. At large ratios, TTOT will
eventually exceed the time designated by the experimenter
as ‘breaking point’. This is demonstrated in Fig. 14, where
TTOT is plotted as a function of ratio value using parameters
representative of those in Fig. 3, with values of motivation
covering the range found there. Note the steepness of these
functions near various criteria for breakpoints. The vertical
dependents from these ordinates on the a050 curve indicate
the breakpoints that are dictated by those criteria. The present
model is thus consistent, not only with the presence of breakpoints, but with the exponential increases in inter-reinforcer
interval as they are approached, and the dependence of those
breakpoints on the stopping criterion (Markou et al. 1993).
Because of the steepness of these functions, the use of the
breaking point to encapsulate the effects of experimental
manipulations will result in an intrinsically high-variance
dependent variable. Momentary vicissitudes in any of the
behaviourally relevant parameters could easily push the animal up the slope to breaking. As noted by Arnold and Roberts
(1997), “Possibly the most problematic [limitation of PR
schedules] is that only a single data point is provided from
an entire session.” Conversely, the parameters of the present
Relation to traditional breakpoint
The gradual approach to the x-axis seen in all of the response
rate graphs suggests that the rats may in theory never completely stop responding; and that is also what the equations
say. But they do seem to stop; and that is what the popular
Fig. 14 The lengthening of TTOT as a function of ratio size, for
different values of specific activation, a. The other parameters were
T0 01 s, k00.5, and δ00.3 s. The lines dependent from the a050 s
function indicate the breaking points dictated by stopping criteria of
10, 20, or 30 min without a reinforcer
Author's personal copy
Psychopharmacology
model draw information from all of the data; whereas they
together determine the breakpoints, they communicate to the
investigator much more stable and powerful inferences from
the data than that single datum, the last completed ratio, which
is affected by many factors, such as the progression used, the
operandum and motor ability of the animal, and hysteresis
effects. The use of this model is not of course a panacea;
animals will satiate with increasing numbers of reinforcers,
and they may also sensitise to the reinforcers after their receipt
(e.g. Gancarz et al. 2012). A powerful new extension of MPR
is on the horizon, designed specifically to elucidate such
within-session effects (Bittar et al. 2012). Savvy experimental
design will always, however, be a sine qua non for interpretable data.
Effect of progression type
Because both pause length and response rate depend on the
duration of the prior component, and that of the one before,
there is hysteresis in response rates—they lag behind the
operative conditions. When step sizes are small and regular,
the past washes out relatively quickly. But when they are
larger and progressive, as in exponential or power function
progressions, the shorter component times continue to have
a substantial impact on current and future performance, as
displayed in Fig. 15. Performance under the arithmetic
progression could be well-described with the FR model;
but that is not true for the expansive exponential progression. In the case of minimal hysteresis, such as
engendered by a step size01, the breakpoint approximates
that found when these values are explored as a series of FR
schedules. That de jure breakpoint is NBP 0(1−k)a/δ (see the
Appendix for its derivation). For the parameters in Fig. 15,
NBP 083.
The de facto breakpoint, derived from the experimenterdefined giving-up time without reinforcement TBP, is drawn
Fig. 15 The effect of type of progression on PR responding. The
continuous curve is for an arithmetic progression with step size 3. The
dashed curve is for the exponential progression Ni 0[5ei/5 −5]. The parameters are T0 01 s, k00.5, δ00.3 s and a050 s for both curves
by a straight line arising from the origin of Fig. 15, with a
slope of 1/TBP. The response rate curves will intersect that
line at the ratio at which TTOT >TBP. In the two progressions
shown in Fig. 15, for TBP 020 min, this is around N0118
and 230.
Relation to prior PR model
Killeen et al. (2009) offered a similar model of PR performance, with pausing predicated on one-back waiting. The
run rate was based on the FR model, rather than the more
fundamental Eq. 1, in the hope of preserving a closed form,
rather than computed real-time model, such as the one
offered here. But this necessitated an additional parameter
for contextual conditioning, which the present model
avoids. It may be the case that in some contexts, or for some
species, that parameter will still be required; but its inclusion
makes estimates of the parameter a much less reliable. The
present real-time model is more parsimonious, more accurate in its description of running rates, and more robust in
treating the data of interest to pharmacology.
The parameter a was derived from the first-order
kinetics of the arousal caused by the delivery of a
single incentive, as the area under the curve of that
exponentially decaying trace of arousal (Killeen et al.
1978; Killeen 1998). It was subsequently noted that a
covaried with δ; this was consistent with an alternate
kinetics in which arousal was cleared as a function of
each response emitted, rather than by the duration of
those responses (Killeen and Sitomer 2003). For ratio
schedules, this has the effect of changing Eq. 3 by
multiplying a in the rightmost denominator by δ. An
advantage of the revised equation is that it obviated the
correlation between a and δ noted in previous studies
(Reilly 2003). A theoretical disadvantage is the replacement of the ubiquitous temporal scale of measurement
of a by a measure (number of responses) which is
specific to particular response topographies. The identification of the extinction ratio with a is difficult to
reconcile with the finding that non-motivational factors
may affect this measure in fixed ratio (Bizo and Killeen
1997) and progressive ratio (Skjoldager et al. 1993;
Covarrubias and Aparicio 2008) schedules. For these
reasons, the original version of Eq. 1 has been adopted
throughout this paper; it is recognised, however, that the
evidence for the relative merits of the two versions remain
inconclusive.
Explanatory utility of the model
The appeal of the PR schedule for psychopharmacologists lies mainly in its potential for measuring the
Author's personal copy
Psychopharmacology
effects of drugs on motivational processes (see Ping-Teng et
al. 1996). Pharmacologically induced changes of the traditional performance index, the breakpoint, have generally been
interpreted in terms of alterations of the subject’s motivation
or the incentive value of the reinforcer. However, the discovery that the breakpoint is sensitive not only to interventions
that affect the organism’s motivational status but also to those
that affect its motor capacity (Arnold and Roberts 1997;
Schmelzeis and Mittleman 1996; Skjoldager et al. 1993) calls
the explanatory utility of the breakpoint into question, and
suggests the need for a model in which motivational and
motor processes are represented by distinct parameters. The
FR model derived from MPR (Killeen 1994) satisfies this
requirement. Since its parameters have specific meanings
within a general theory of operant behaviour (MPR), qualitatively different effects of interventions on performance may be
ascribed to particular processes that, according to MPR, regulate operant behaviour on all types of reinforcement schedule. For example, a change in slope of the descending limb of
the response rate curve defined by Eq. 3 points to a motivational effect (i.e. a change in the value of a), and a change in the
(extrapolated) ordinate intercept to a motoric effect (i.e. a
change in the value of δ) (see Fig. 1, upper left-hand graph).
The application of Eq. 3 to PR schedule performance has
provided a basis for identifying effects of lesions and acute
drug treatment on motivational and motor processes (see
Section 3). However, recent evidence highlighted significant
shortcomings of the FR model as a descriptor of PR schedule performance (see Section 4). In particular, the curvilinear decline of empirical response rate curves is embarrassing
for a model which explicitly predicts a linear descent of
response rate towards zero. The PR model proposed here
deals with this difficulty by invoking the linear waiting
principle (Wynne et al. 1996) to account for sequential
effects of the escalating ratio requirement, a key property of
PR schedules.
In its present form, the PR model incorporates four parameters, one more than the FR model. However, unlike the FR
model, the PR model offers an account of both running and
overall response rates. Since the data encompassed by the two
models are not identical, quantitative comparison (for example, using an information criterion approach) is not feasible.
However, visual inspection indicates that the fits of the PR
model to the data shown in Figs. 2, 4, 6, 8, 10 and 12,
systematically improves upon the original fits of the FR model
to the same data (see Bezzina et al. 2008; Olarte Sánchez et al.
2012a, b; Rickard et al. 2009).
More important than relative goodness of fit, however, is
the difference between the explanatory concepts invoked by
the two models. Although two parameters (a and δ) are
common to both models, the linear waiting parameters, T0
and k, are particular to the PR model. It is reasonable to ask
whether the two models invite different interpretations of
the effects of pharmacological interventions on PR schedule
performance. Table 1 summarises the effects of the interventions considered in this paper on the parameters of the
two models. There is a striking correspondence between the
effects of the interventions on the motivational parameter, a,
revealed by the two models. In contrast, the two models
appear to be somewhat discordant with respect to the motor
parameter, δ. This discrepancy arises because in the FR
model, δ absorbs any reduction of the peak of the overall
response rate function, whereas the PR model allows reductions of peak overall response rate to be accommodated by
parameters representing fixed (T0), and variable (k) latencies
to engage in the operant task, and the tempo of responding
once initiated (δ). This capacity to ‘deconstruct’ the peak
response rate enables the PR model to detect interesting
differences between the effects of interventions that are
invisible to the FR model. For example, according to the
FR model lesions of the AcbC and destruction of LHA
orexinergic neurones had indistinguishable effects on the
overall response rate function, in that both interventions
increased the value of δ. In contrast, the PR model indicated
that the effects of the two lesions were not the same: the
OxSap lesion increased the minimum response time, δ, whereas the AcbC lesion increased the minimum post-reinforcement
pause duration, T0.
Optimising the explanatory value of a model entails a
compromise between comprehensiveness and parsimony.
Clearly, the proliferation of unnecessary parameters is to be
deprecated; however, a model that contains very few free
parameters may be unequal to the task of providing a realistic
account of complex schedule-controlled behaviour. The
Table 1 Effects of pharmacological interventions on progressive ratio
(PR) schedule performance: comparison of effects on the parameters of
the fixed ratio (FR) and PR models
Intervention
Increase in reinforcer volume
Haloperidol
Clozapine
Cyproheptadine
AcbC lesion
LHA OxSap lesion
FR modela
PR modelb
β
a
δ
T0
k
a
δ
0
0
↑
0
0
0
↑
↓
↑
↑
0
0
↑
↓
↑
↑
↑
↑
↑
0
0
↑
↑
0
↑
0
0
↓
0
0
↑
↓
↑
↑
0
0
0
0
↑
↑
0
↑
a
Parameters of the FR model were reported by Rickard et al. (2009;
reinforcer volume), Olarte Sánchez et al. (2012a; haloperidol, clozapine,
cyproheptadine), Bezzina et al. (2008; lesion of nucleus accumbens core:
AcbC lesion), and Olarte Sánchez et al. (2012b; orexin-B-saporin induced
lesion of the lateral hypothalamic area: LHA OxSap lesion)
b
Parameters of the PR model are reported in Section 4 of this paper
Author's personal copy
Psychopharmacology
present model of PR schedule performance attempts to steer a
middle path between these opposing demands. Its parameters
have face validity, and are directly measurable or manipulable.
The utility of the model for behavioural pharmacology will be
judged according to how well it facilitates the interpretation of
the effects of neuropharmacological interventions in terms of
basic behavioural processes.
A3. Computer pseudocode*
Conflicts of interest None.
Appendix
A1. Coupling
Not all responding that is excited by incentives results in
proper, on-target responding (Killeen 1978; Skinner 1948;
Timberlake and Lucas 1985, 1989). The coupling coefficient tells us what proportion of stimulated behaviour
will be measured on the lever. Because the reinforcer
itself interrupts the stream of target response, it truncates
the reach of those delay of reinforcement gradients. On
PR schedules, however, animals have experience with
long sequences of the target response on the longest
ratios. It can be assumed that these drive coupling arbitrarily
high. In the current model, it is set 1, to conserve that
parameter: CPR ≈ 1.
A2. Reduction to FR model and prediction of de jure
breakpoint
Rewrite Eq. 6c for the case where successive values of N
and TTOT are equal:
TTOT ẳ T0 ỵ kTTOT ỵ N d 1 þ TTOT =aÞ
Simplify by setting T0 to 0, and solve:
TTOT ¼
Nd
Á
1 À k À N d=a
Compute overall response rate:
N
TTOT
N ð1 k N d=aị
Nd
1k N
ẳ
d
a
ẳ
Thus, the FR model.
Set to 0 to compute the de jure break point:
NBP ¼
ð1 À k Þa
d
*The standard values are initiated to provide some ‘burnin’, with the assumption of a nominal 2 s TTOT under an
FR1. SSs is an unweighted sum of SSRUN and SSOVERALL.
References
Aberman JE, Ward SJ, Salamone JD (1998) Effects of dopamine antagonists
and accumbens dopamine depletions on time-constrained progressiveratio performance. Pharmacol Biochem Behav 61:341–348
Author's personal copy
Psychopharmacology
Arnold JM, Roberts DCS (1997) A critique of fixed and progressive
ratio schedules used to examine the neural substrates of drug
reinforcement. Pharmacol Biochem Behav 57:441–447
Aston-Jones G, Smith RJ, Moorman DE, Richardson KA (2009) Role
of lateral hypothalamic orexin neurons in reward processing and
addiction. Neuropharmacology 56:112–121
Baldo B, Kelley AE (2007) Discrete neurochemical coding of distinguishable motivational processes: insights from nucleus accumbens
control of feeding. Psychopharmacology 91:439–459
Baron A, Mikorski J, Schlund M (1992) Reinforcement magnitude and
pausing on progressive-ratio schedules. J Exp Anal Behav
58:377–388
Barr AM, Phillips AG (1999) Withdrawal following repeated exposure
to d-amphetamine decreases responding for a sucrose solution as
measured by a progressive ratio schedule of reinforcement.
Psychopharmacology 141:99–106
Berridge CW, Espana RA, Vittoz NM (2010) Hypocretin/orexin in
arousal and stress. Brain Res 1314:91–102
Bezzina G, Cheung THC, Asgari K, Hampson CL, Body S, Bradshaw
CM, Szabadi E, Deakin JFW, Anderson IM (2007) Effects of
quinolinic acid-induced lesions of the nucleus accumbens core on
inter-temporal choice: a quantitative analysis. Psychopharmacology
195:71–84
Bezzina G, Body S, Cheung THC, Hampson CL, Deakin JFW,
Anderson IM, Szabadi E, Bradshaw CM (2008) Effect of quinolinic acid-induced lesions of the nucleus accumbens core on
performance on a progressive ratio schedule of reinforcement:
implications for inter-temporal choice. Psychopharmacology
197:339–350
Bittar EG, Del-Claro K, Bittar LG, da Silva MCP (2012) Towards a
mathematical model of within-session operant responding. J Exp
Psychol: Anim Behav Proc. doi:10.1037/a0029086
Bizo LA, Killeen PR (1997) Models of ratio schedule performance. J
Exp Psychol: Anim Behav Process 23:351–367
Bowman EM, Brown VJ (1998) Effects of excitotoxic lesions of the rat
ventral striatum on the perception of reward cost. Exp Brain Res
123:439–448
Carlezon WA, Thomas MJ (2009) Biological substrates of reward
and aversion: a nucleus accumbens activity hypothesis.
Neuropharmacology 56(1):122–132
Cheeta S, Brooks S, Willner P (1995) Effects of reinforcer sweetness
and the D2/D3 antagonist raclopride on progressive ratio operant
performance. Behav Pharmacol 6:127–132
Corrigan PW, Reinke RR, Landsberger SA, Charate A, Toombs GA
(2003) The effects of atypical antipsychotic medications on psychosocial outcomes. Schizophrenia Res 63:97–101
Covarrubias P, Aparicio CF (2008) Effects of reinforcer quality and
step size on rats' performance under progressive ratio schedules.
Behav Processes 78:246–252
Cunningham Owens DG (1999) A guide to the extrapyramidal sideeffects of antipsychotic drugs. Cambridge University Press,
Cambridge
Czachowski CL, Samson HH (1999) Breakpoint determination and
ethanol self-administration using an across-session progressive
ratio procedure in the rat. Alcoholism: Clin Exp Res 23:1580
Date Y, Ueta Y, Yamashita H, Yamaguchi H, Matsukura S, Kangawa
K, Sakurai T, Yanagisawa M, Nakazato M (1999) Orexins, orexigenic hypothalamic peptides, interact with autonomic, neuroendocrine and neuroregulatory systems. Proc Natl Acad Sci USA
96:748–753
de Lecea L, Kilduff TS, Peyron C, Gao X, Foye PE, Danielson PE,
Fukuhara C, Battenberg EL, Gautvik VT, Bartlett FS, Frankel
WN, van den Pol AN, Bloom FE, Gautvik KM, Sutcliffe JG
(1998) The hypocretins: hypothalamus-specific peptides with
neuroexcitatory activity. Proc Natl Acad Sci USA 95:322–
327
den Boon FS, Body S., Hampson CL, Bradshaw CM, Szabadi E,
de Bruin N (2012) Effects of amisulpride and aripiprazole on
progressive-ratio schedule performance: comparison with
clozapine and haloperidol. J Psychopharmac. doi:10.1177/
0269881111421974
Ferguson SA, Paule MG (1997) Progressive ratio performance varies
with body weight in rats. Behav Processes 40:177–182
Ferster CB, Skinner BF (1957) Schedules of reinforcement. B. F.
Skinner Foundation, Cambridge
Gancarz AM, Kausch MA, Lloyd DR, Richards JB (2012) Betweensession progressive ratio performance in rats responding for cocaine and water reinforcers. Psychopharmacology. doi:10.1007/
s00213-012-2637-9
Goudie AJ, Cooper GD, Cole JC, Sumnall HR (2007) Cyproheptadine
resembels clozapine in vivo folowing both acute and chronic
administration in rats. J Psychopharmac 21:179–190
Graham SJ, Langley RW, Bradshaw CM, Szabadi E (2001) Effects of
haloperidol and clozapine on prepulse inhibition of the acoustic
startle response and the N1/P2 auditory evoked potential in man. J
Psychopharmac 15:243–250
Harris GC, Aston-Jones G (2006) Arousal and reward: a dichotomy in
orexin function. Trends Neurosci 29:571–577
Hartfield A, Moore N, Clifton P (2003) Serotonergic and histaminergic
mechanisms involved in intralipid drinking? Pharmacol Biochem
Behav 76:251–258
Herrnstein RJ (1970) On the law of effect. J Exp Anal Behav 13:243–266
Herrnstein RJ (1974) Formal properties of the matching law. J Exp
Anal Behav 21:159–164
Herrnstein RJ, Rachlin H, Laibson DI (1997) The matching law.
Harvard University Press, Cambridge
Ho MY, Body S, Kheramin S, Bradshaw CM, Szabadi E (2003) Effects
of 8-OH-DPAT and WAY-100635 on performance on a timeconstrained progressive ratio schedule. Psychopharmacology
(Berl) 167:137–144
Hodos W (1961) Progressive ratio as a measure of reward strength.
Science 134:943–944
Hodos W, Kalman G (1963) Effects of increment size and reinforcer
volume on progressive ratio performance. J Exp Anal Behav 6:387
Kheramin S, Body S, Herrera FM, Bradshaw CM, Szabadi E, Deakin JF,
Anderson IM (2005) The effect of orbital prefrontal cortex lesions
on performance on a progressive ratio schedule: implications for
models of inter-temporal choice. Behav Brain Res 156:145–152
Killeen PR (1978) Superstition: a matter of bias, not detectability.
Science 199:88–90
Killeen PR (1979) Arousal: Its genesis, modulation, and extinction. In:
Zeiler MD, Harzem P (eds) Advances in analysis of behavior, vol
1, Reinforcement and the organization of behavior. Wiley,
Chichester, pp 31–78
Killeen PR (1994) Mathematical principles of reinforcement. Behav
Brain Sci 17:105–172
Killeen PR (1998) The first principle of reinforcement. In: Wynne
CDL, Staddon JER (eds) Models of action: mechanisms for
adaptive behavior. Erlbaum, Mahwah, pp 127–156
Killeen PR, Sitomer MT (2003) MPR. Behav Processes 62:49–64
Killeen PR, Hanson SJ, Osborne SR (1978) Arousal: its genesis and
manifestation as response rate. Psychol Rev 85:571–581
Killeen PR, Posadas-Sanchez D, Johansen EB, Thrailkill EA (2009)
Progressive ratio schedules of reinforcement. J Exp Psychol:
Anim Behav Proc 35:35–50
Li N, He S, Parrish C, Delich J, Grasing K (2003) Differences in
morphine and cocaine reinforcement under fixed and progressive
ratio schedules; effects of extinction, reacquisition and schedule
design. Behav Pharmac 14:619–630
Markou A, Weiss F, Gold LH, Caine SB, Schulteis G, Koob GF (1993)
Animal models of drug craving. Psychopharmacology (Berl)
112:163–182
Author's personal copy
Psychopharmacology
Meltzer H, Perry E, Jayathilake K (2003) Clozapine-induced weight
gain predicts improvement in psychopathology. Schizophrenia
Res 59:19–27
Mobini S, Chiang T-J, Ho M-Y, Bradshaw CM, Szabadi E (2000)
Comparison of the effects of clozapine, haloperidol, chlorpromazine and d-amphetamine on performance on a time-constrained
progressive ratio schedule and on locomotor behaviour in the rat.
Psychopharmacology 152:47–54
Müller-Spahn F (2002) Current use of atypical antipsychotics. Eur
Psychiat 17(suppl 4):377–384
Olarte Sánchez CM, Valencia Torres L, Body S, Cassaday HJ,
Bradshaw CM, Szabadi E, Goudie AJ (2012a) A clozapine-like
effect of cyproheptadine on progressive-ratio schedule performance. J Psychopharm 26:857–870
Olarte Sánchez CM, Valencia Torres L, Body S, Cassaday HJ,
Bradshaw CM, Szabadi E (2012b) Effectof orexin-B-saporin induced lesions of the lateral hypothalamus on a progressive-ratio
schedule. J Psychopharm 26:871–886
Perone M, Courtney K (1992) Fixed-ratio pausing: joint effects of past
reinforcer magnitude and stimuli correlated with upcoming magnitude. J Exp Anal Behav 57:33–46
Peyron C, Tighe DK, van den Pol AN, de Lecea L, Heller HC, Sutcliffe
JG, Kilduff TS (1998) Neurons containing hypocretin (orexin)
project to multiple neuronal systems. J Neurosci 18:9996–10015
Ping-Teng C, Lee ES, Konz SA, Richardson NR, Roberts DCS (1996)
Progressive ratio schedules in drug self-administration studies in rats:
a method to evaluate reinforcing efficacy. J Neurosci Meth 66:1–11
Reilly MP (2003) Extending mathematical principles of reinforcement
into the domain of behavioral pharmacology. Behav Processes
62:75–88
Richardson NR, Roberts DCS (1996) Progressive ratio schedules in
drug self-administration studies in rats—a method to evaluate
reinforcing efficacy. J Neurosci Methods 66:1–11
Rickard JF, Body S, Zhang Z, Bradshaw CM, Szabadi E (2009) Effect of
reinforcer magnitude on performance maintained by progressive-ratio
schedules. J Exp Anal Behav 91:75–87
Roberts DCS, Richardson NR (1992) Self-administration of psychostimulants using progressive ratio schedules of reinforcement. In:
Boulton A, Baker G, Wu PH (eds) Neuromethods vol 24: animal
models of drug addiction. Humana, New York, pp 233–269
Sakurai T, Amemiya A, Ishii M, Matsuzaki I, Chemelli RM, Tanaka H,
Williams SC, Richarson JA, Kozlowski GP, Wilson S, Arch JR,
Buckingham RE, Haynes AC, Carr SA, Annan RS, McNulty DE,
Liu WS, Terrett JA, Elshourbagy NA, Bergsma DJ, Yanagisawa
M (1998) Orexins and orexin receptors: a family of hypothalamic
neuropeptides and G protein-coupled receptors that regulate feeding
behavior. Cell 92:573–585, and page following p. 696
Salamone JD, Correa M, Farrar A, Mingote SM (2007) Effort-related
functions of nucleus accumbens dopamine and associated forebrain
circuits. Psychopharmacology 191:461–482
Schmelzeis MC, Mittleman G (1996) The hippocampus and reward:
effects of hippocampal lesions on progressive-ratio responding.
Behav Neurosci 110:1049–1066
Schneider BA (1969) A two-state analysis of fixed-interval responding
in the pigeon. J Exp Anal Behav 12:677–687
Siegel JM (2004) Hypocretin (orexin): role in normal behavior and
neuropathology. Ann Rev Psychol 55:125–148
Siegel JM (2005) Hypocretin/orexin and motor function. In: Nishino S,
Sakurai T (eds) The orexin/hypocretin system: physiology and
pathophysiology. Humana Press, New York
Skinner BF (1948) Superstition in the pigeon. J Exp Psychol 38:168–
172
Skjoldager P, Pierre PJ, Mittleman G (1993) Reinforcer magnitude and
progressive ratio responding in the rat: effects of increased effort,
prefeeding, and extinction. Learn Motiv 24:303–343
Stafford D, Branch MN (1998) Effects of step size and break-point
criterion on progressive-ratio performance. J Exp Anal Behav
70:123–138
Stafford D, LeSage MG, Glowa JR (1998) Progressive-ratio schedules
of drug delivery in the analysis of drug self-administration: a
review. Psychopharmacology (Berl) 139:169–184
Sutton RS, Barto AG (1990) Time-derivative models of Pavlovian
reinforcement. In: Gabriel M, Moore J (eds) Learning and computational neuroscience: foundations of adaptive networks. MIT
Press, Cambridge, pp 497–537
Timberlake W, Lucas GA (1985) The basis of superstitious behavior:
chance contingency, stimulus substitution, or appetitive behavior?
J Exp Anal Behav 44:279–299
Timberlake W, Lucas GA (1989) Behavior systems and learning: from
misbehavior to general principles. In: Klein SB, Mowrer RR (eds)
Contemporary learning theories: instrumental conditioning theory
and the impact of constraints on learning. Erlbaum, Hillsdale, pp
237–275
Trivedi P, Yu H, MacNeil DJ, Van der Ploeg LH, Guan XM (1998)
Distribution of orexin receptor mRNA in the rat brain. FEBS Lett
438:71–75
Valencia-Torres L, Olarte-Sánchez CM, da Costa AS, Body S, Bradshaw
CM, Szabadi E (2012) Nucleus accumbens and delay discounting in
rats: evidence from a new quantitative protocol for analysing intertemporal choice. Psychopharmacology 219:271–283
Wise RA (1982) Neuroleptics and operant behavior: the anhedonia
hypothesis. Brain Behav Sci 5:39–87
Wise RA (2006) Role of brain dopamine in food reward and reinforcement. Phil Trans Roy Soc Lond B: Biol Sci 361:1149–1158
Wynne CDL, Staddon JER, Delius JD (1996) Dynamics of waiting in
pigeons. J Exp Anal Behav 65:603–618
Zhang Z, Rickard JF, Asgari K, Body S, Bradshaw CM, Szabadi E
(2005a) Quantitative analysis of the effects of some "atypical" and
"conventional" antipsychotics on progressive ratio schedule performance. Psychopharmacology (Berl) 179:489–497
Zhang Z, Rickard JF, Body S, Asgari K, Bradshaw CM, Szabadi E
(2005b) Comparison of the effects of clozapine and 8-hydroxy-2(di-n-propylamino) tetralin (8-OH-DPAT) on progressive ratio
schedule performance: evidence against the involvement of 5-HT 1A
receptors in the behavioural effects of clozapine. Psychopharmacology
(Berl) 181:381–391