Behavioral variability, elimination of responses, and delay of reinforcement gradients in SHR and WKY rats
Bạn đang xem bản rút gọn của tài liệu. Xem và tải ngay bản đầy đủ của tài liệu tại đây (342.73 KB, 11 trang )
Behavioral and Brain Functions
BioMed Central
Open Access
Research
Behavioral variability, elimination of responses, and
delay-of-reinforcement gradients in SHR and WKY rats
Espen B Johansen*1,2, Peter R Killeen2,3 and Terje Sagvolden1,2
Address: 1Department of Physiology, Institute of Basic Medical Sciences, University of Oslo, Oslo, Norway, 2Centre for Advanced Study at the
Norwegian Academy of Science and Letters, Oslo, Norway and 3Department of Psychology, Arizona State University, AZ, USA
Email: Espen B Johansen* - ; Peter R Killeen - ; Terje Sagvolden -
* Corresponding author
Published: 20 November 2007
Behavioral and Brain Functions 2007, 3:60
doi:10.1186/1744-9081-3-60
Received: 25 July 2006
Accepted: 20 November 2007
This article is available from: />© 2007 Johansen et al; licensee BioMed Central Ltd.
This is an Open Access article distributed under the terms of the Creative Commons Attribution License ( />which permits unrestricted use, distribution, and reproduction in any medium, provided the original work is properly cited.
Abstract
Background: Attention-deficit/hyperactivity disorder (ADHD) is characterized by a pattern of inattention,
hyperactivity, and impulsivity that is cross-situational, persistent, and produces social and academic impairment.
Research has shown that reinforcement processes are altered in ADHD. The dynamic developmental theory has
suggested that a steepened delay-of-reinforcement gradient and deficient extinction of behavior produce
behavioral symptoms of ADHD and increased behavioral variability.
Method: The present study investigated behavioral variability and elimination of non-target responses during
acquisition in an animal model of ADHD, the spontaneously hypertensive rat (SHR), using Wistar Kyoto (WKY)
rats as controls. The study also aimed at providing a novel approach to measuring delay-of-reinforcement
gradients in the SHR and the WKY strains. The animals were tested in a modified operant chamber presenting
20 response alternatives. Nose pokes in a target hole produced water according to fixed interval (FI) schedules
of reinforcement, while nose pokes in the remaining 19 holes either had no consequences or produced a sound
or a short flickering of the houselight. The stimulus-producing holes were included to test whether light and sound
act as sensory reinforcers in SHR.
Data from the first six sessions testing FI 1 s were used for calculation of the initial distribution of responses.
Additionally, Euclidean distance (measured from the center of each hole to the center of the target hole) and
entropy (a measure of variability) were also calculated.
Delay-of-reinforcement gradients were calculated across sessions by dividing the fixed interval into epochs and
determining how much reinforcement of responses in one epoch contributed to responding in the next interval.
Results: Over the initial six sessions, behavior became clustered around the target hole. There was greater initial
variability in SHR behavior, and slower elimination of inefficient responses compared to the WKY. There was
little or no differential use of the stimulus-producing holes by either strain. For SHR, the reach of reinforcement
(the delay-of-reinforcement gradient) was restricted to the preceding one second, whereas for WKY it extended
about four times as far.
Conclusion: The present findings support previous studies showing increased behavioral variability in SHR
relative to WKY controls. A possibly related phenomenon may be the slowed elimination of non-operant nose
pokes in SHR observed in the present study. The findings provide support for a steepened delay-of-reinforcement
gradient in SHR as suggested in the dynamic developmental theory of ADHD. Altered reinforcement processes
characterized by a steeper and shorter delay-of-reinforcement gradient may define an ADHD endophenotype.
Page 1 of 11
(page number not for citation purposes)
Behavioral and Brain Functions 2007, 3:60
Background
Attention-deficit/hyperactivity disorder (ADHD) is a
behavioral disorder characterized by a developmentally
inappropriate pattern of inattention, hyperactivity, and
impulsivity that is cross-situational, persistent, and
produces social and academic impairment [1-3].
Motivational and environmental factors have an important influence on symptom development and expression
in ADHD. Reinforcement contingencies in particular
seem to affect behavior differently in ADHD than in
controls [4-12].
/>
while nose-pokes in the other holes either had no
consequences, or produced a short flickering of the houselight or a brief sound stimulus (Figure 1). A previous study
found a large effect of light-feedback on rate of lever pressing during extinction in SHR [23]. Hence, stimulus-producing holes were included in the present study to test
whether light and sound act as sensory reinforcers in SHR.
Properties of the delay-of-reinforcement gradients were
investigated by dividing the fixed interval into epochs and
calculating how much reinforcement of responses in an
epoch affected responding in the next interval.
Method
The dynamic developmental theory of ADHD [13,14]
suggests that dopamine hypofunction changes basic
learning mechanisms by producing a narrower time window for the association of preceding stimuli, behavior,
and its consequences. Further, it is suggested that this
results in altered reinforcement processes in ADHD that
are described by an abnormally steep and short delay-ofreinforcement gradient, and slower extinction of inefficient responses. Such deficits will result in a slower establishment of long integrated behavioral chains under
proper stimulus control; partly due to slower chaining of
behavioral elements and partly due to intrusion of inefficient and inadequate responses into the stream of behavior due to an inefficient extinction. The resulting behavior
may be described as overactive, impulsive, inattentive,
and variable [13-15].
The present study investigated predictions from the
dynamic developmental theory in an animal model of
ADHD. The spontaneously hypertensive rats (SHR) is a
genetic model bred from its normotensive progenitor
Wistar Kyoto rat (WKY), and has been validated as a
model of ADHD [16-18]. SHR show the main behavioral
characteristics of ADHD: Hyperactivity, impulsivity, inattention as well as increased behavioral variability [16-18].
Additionally, properties of the delay-of-reinforcement
gradients in SHR and Wistar Kyoto (WKY) controls have
previously been investigated; the behavioral changes in
SHR being consistent with a steepened delay-of-reinforcement gradient compared to normal controls [16,18-22].
Problem
The present study investigated behavioral variability and
elimination of non-target responses during acquisition in
SHR and WKY controls. Further, the study aimed at providing a novel approach to measuring delay-of-reinforcement gradients in order to bring converging evidence to
bear on the differences between the SHR and the WKY
strains. The animals were tested in a modified operant
chamber (hole-box) in which one wall contained 20 holes.
Nose-pokes in the target hole produced water reinforcers
according to fixed interval schedules of reinforcement
Subjects
The subjects were eight male NIH-strain Spontaneously
Hypertensive Rats (SHR) and eight NIH-strain WistarKyoto (WKY) control rats. They were obtained from a
commercial supplier (Møllegaard Breeding Centre, Denmark) at approximately 60 days of age, weighing 150–180
g. Subjects were housed four by four, 2 SHRs and 2 WKYs,
in opaque plastic cages 35 × 26 × 16 cm (height) where
they had free access to food (Beekay Feeds, Rat and Mouse
Autoclavable Diet, B&K Universal Limited). The
animal quarters were lit between 0800 and 2000 hours.
The room temperature was kept at 20 ± 2°C and humidity
at 55 ± 10%.
The study was approved by the National Animal Research
Authority (NARA) of Norway, and was conducted in
accordance with the laws and regulations controlling
experiments/procedures in live animals in Norway.
Apparatus
Three modified BRS/LVE Model RTC-022 Rodent Test
Cages (A, B, C) located within standard BRS/LVE (SEC002) outer housings, and one modified LeHigh Valley
Model 1417 Rodent Test Cage (D) within a standard
LeHigh Valley Model 1417 Small Environment outer
housing were used as experimental chambers. The rat's
working space was 26.5 × 25.0 × 26.5 (height) cm. There
was no lever, but one wall was a metal panel 25.9 × 26.5
cm containing 20 2.0 cm diameter holes, designed as
response locations for nose poking. The holes were
arranged in five parallel columns with four holes in each
column, and were designated numerically by the couplet
(r, c), with the holes in the upper row as seen from the animal's working space designated (1, 1), (1, 2),...,(1, 5)
(Figure 1).
The center-to-center distance between holes was 4.0 cm
for both rows and columns. The bottom row was located
2.0 cm above the floor, and the top row 12.5 cm below
the ceiling of the cage. Poking deeper than 8.5 mm into
the hole was detected by photocells in each hole. Activation of holes (2, 1), (4, 1), (1, 2), (4, 3), (1, 4), (2, 5), and
Page 2 of 11
(page number not for citation purposes)
Behavioral and Brain Functions 2007, 3:60
/>
Figure
The
layout
1 of the panel in the hole-box is illustrated by the various symbols
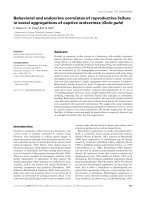
The layout of the panel in the hole-box is illustrated by the various symbols. The holes are designated numerically by the couplet (r, c), with the holes in the upper row as seen from the animal's working space designated (1, 1), (1, 2),...,(1, 5), row two
(2.1), (2, 2),...,(2, 5). Nose pokes in the target hole (2, 3) produced water in a water cup on the opposite wall according to fixed
interval schedules, while pokes in the other holes either had no consequences or produced a brief flickering of the houselight
or a sound stimulus. The center of each hole was 4 cm from its nearest neighbor.
(4, 5) flickered the 15 W houselight for as long as the animal was in the hole. This function is represented by the
lamps in the diagram of Figure 1. Activation of holes (1,
1), (3, 1), (4, 2), (1, 3), (4, 4), (1, 5), and (3, 5) generated
a brief 95 dBA, 3 kHz tone (cage A, B, C), or a 95 dBA, 4.9
kHz tone (cage D) from an amplifier (Sonalert) placed
inside the test chamber. This symmetric distribution of
"light-" and "sound-" holes permitted to check for preferences. Activation of the holes (2, 2), (3, 2), (3, 3), (2, 4),
and (3, 4) close to the target hole (2, 3) produced no stimuli. Activation of the target hole (2, 3) was immediately
followed by 0.01 ml tap water delivered with a loud click
by a liquid dipper on the opposite cage wall. The liquid
dippers were of models BRS/LVE Model SLD-002 (cage A,
B and C) and LeHigh Valley Model 1351 (cage D). The
0.01 ml water cup on the liquid dipper protruded through
a hole within the recessed cup shield. The water cup was
positioned 0.5 cm above floor level 0.5 cm (depth) into
Page 3 of 11
(page number not for citation purposes)
Behavioral and Brain Functions 2007, 3:60
/>
the opening and the shield was 3 cm in diameter and 2 cm
deep. A photocell positioned 0.5 cm into the wall of the
cup shield recorded all visits during experimental
sessions.
A 15 W houselight located in the center of the ceiling illuminated the cage. White masking noise was provided by
the ventilation fans (65 dBA). Sessions were signaled by
onset of the houselight and the white masking noise. All
photocell beam breaks were recorded by the computer
with 55 ms accuracy. Complete records of all hole-visits
were kept.
Procedure
The experiment was run 5 days a week for most of the
experimental period. The final sessions were run 7 days a
week. All sessions were run between 1530 and 1900
hours. The duration of each session varied to some extent
due to differences in the total number of reinforcers programmed for the session, schedule, and time each rat
needed to complete the schedule (see Table 1). Due to low
response rates in some animals, other animals ended the
session earlier but remained in the darkened chamber
until all in their squad had completed their session. Each
subject was always run in the same experimental chamber.
All four rats housed together in a cage were run at the
same time every day to allow a constant water deprivation. The animals were deprived of water for 22.5 h before
each session. Immediately following the sessions, the animals were returned to their home cages where tap water
was available ad lib. for 30 min from multiple water
bottles in each cage.
Response acquisition
On arrival, all animals were registered, marked, assigned
to four separate groups for housing, and subsequently
handled. Habituation to the experimental chamber and
magazine training were conducted during the four sessions immediately preceding response shaping. During
Table 1: Summary of the experimental procedure. FI: fixed
interval schedule of reinforcement
Session number
Schedule
No. of reinforcers
1–6
7–8
9 – 11
12 – 13
14 – 15
16
17 – 54
FI 1 s1
FI 15 s
FI 30 s
FI 60 s
FI 120 s
FI 200 s
FI 300 s2
20
20
20
15
10
10
6
Note. – 1 Used for analyses of entropy, and initial Euclidean distance
(Figures 3, 4 and 5).
2 All sessions testing FI < 300s and the last 21 sessions testing FI 300 s
were used for analyses of influence functions and overall Euclidean
distance (Figures 5 and 6).
magazine training, all holes in the panel were covered,
and water was available from the water cup on a random
time (RT) 10 s schedule (two sessions) and on a RT 20 s
schedule (two sessions). Such schedules provide water at
random time intervals independent of the rat's behavior.
By the fourth magazine training session, all animals reliably collected the reinforcers when available.
Shaping
Only the target hole (2, 3) was available during response
shaping. Nose poking into the target hole was handshaped by the method of successive approximations (two
sessions).
The fixed-interval reinforcement schedule
The fixed-interval (FI) schedule delivers a reinforcer for a
correct response that occurs after a fixed time since the
previous reinforcer. The reinforced operant was the activation of the photocell in the target hole (2, 3). The sound
from the electromagnet operating the water cup signaled
the availability of water. Holes other than the target hole
were covered until the subjects reliably emitted enough
appropriate responses to produce 20 reinforcers programmed on a FI 1 s schedule in every session. Then all
holes were uncovered. The first session with all holes
uncovered is numbered as Session 1, and marks the start
of the data set to be reported here. A gradual increase in FI
value, and a compensatory decrease in the number of
reinforcers available, proceeded until session 17 when the
FI 300-s schedule was introduced. The number of available reinforcers was 20 during FI 1s and decreased to 6 during FI 300 s (Table 1). The gradually increasing FI values
were intended simply to ensure a smooth transition to the
longest schedule, FI 300 s, which was used throughout the
rest of the study.
Data analyses
Data from the first six sessions testing FI 1 s were used for
calculation of the initial distribution of responses, Euclidean distance, and entropy. These sessions were selected
to capture behavior as the animals were acquiring a
new repertoire. The data analyzed were rate of responding
in the four types of holes – light, sound, neutral, and
water – and rate of investigating the water tray. These are
reported as responses per second. To avoid redundant
counts for sniffing at holes or tray, no activity was
registered until at least 120 ms had elapsed since the previous registered response. Delay-of-reinforcement gradients were calculated based on data from all sessions
testing FI < 300 s and the last 21 sessions testing FI 300 s.
The following measures were calculated:
Distance
The Euclidean distance was measured from the center of
each hole to the center of the target hole (2, 3).
Page 4 of 11
(page number not for citation purposes)
Behavioral and Brain Functions 2007, 3:60
/>
Delay-of-reinforcement gradient
A reinforcer acts on responses that occurred immediately
before its receipt, and to a lesser extent on those that
occurred at some temporal remove. The decrease in efficacy of reinforcement as a function of the time elapsing
between a response and the reinforcer is called the delayof-reinforcement gradient. It presumably occurs because
the memory of the response on which the reinforcer acts
(the response trace) decays over time. Here, the gradient is
calculated from all sessions testing FI < 300s and the last
21 sessions testing FI 300 by (a) noting which responses
occur in various epochs before a reinforcer is delivered;
the epochs are bins of increasing size, centered at 0.15,
0.64, 1.5, 2.6, 4.3, 6.6, 9.6, 14, 20, 28, 40, 55, 73, 95, and
100 s. These steps approximately equated the number of
observations for each epoch, while providing both a relatively fine scale at the steepest portion of the gradient, and
stability of estimates as the distance increased from the
following reinforcer. Whenever such a response is
recorded, a counter of opportunities for that epoch is
incremented. (b) A counter of the number of times that
each such response occurs any time in the next interval is
incremented. (c) The number of observations of a
repeated response divided by the number of opportunities
for observing such a response gives the relative frequency
with which a response is observed following reinforcement as a function of its proximity to reinforcement in the
prior interval. These calculations, modeled after [24], provide a measure of the differential emission in the future of
behavior that was reinforced at different temporal
removes in the past. The measure, a relative frequency, is
independent of overall rate of responding.
Results
Figure
The
first
6total
sessions
2 number
of FI
of 1hole
s entries made by rats during the
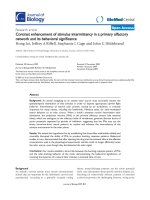
The total number of hole entries made by rats during the
first 6 sessions of FI 1 s. The graphs are truncated at 400
responses. The number of target hole (2, 3) responses was
approximately 1200 for both strains.
Entropy
Entropy is a measure of the variability of responding. It is
calculated as the sum of the probabilities of visiting each
hole multiplied by the logarithms of those probabilities:
U = -Σplog2(p). Probabilities were calculated as relative frequencies over the blocks of 100 events (nose pokes, visits
to the water cup, and reinforcers). Entropy does not take
into account the order of visiting holes, or their distance
from one another. It is measured in bits, and ranges from
0, in case every response is to the same hole, to 4.32, in
case responses are distributed to each of the 20 holes with
equal probability.
Use of holes
Figure 2 shows the total number of hole entries over all animals during the first six sessions of FI 1 s. These graphs are
truncated at 400 responses, with the number of target hole
responses rising to approximately 1200 for each strain of
rat. It is clear that the most frequently entered hole after the
target hole is the one just below it (3, 3), and that hole use
in general conformed to a simple spatial generalization gradient. Although the two graphs look similar, a Chi-Square
test shows them to be significantly different (χ2(19, 5253)
= 218, p < .01, prep > .99), the difference consisting of a flatter spatial generalization for SHR.
The average response rate of the WKY rats over these
sessions was 6.74 responses per minute, with about half
of those responses to the target hole (3.70 responses
per minute). The SHR responded almost twice as fast
(11.1 responses/minute), with about a third of their
responses to the target hole (4.42 responses/min).
The higher overall response rate is due in large part to the
greater incidence of responses to neutral holes, as those
Page 5 of 11
(page number not for citation purposes)
Behavioral and Brain Functions 2007, 3:60
/>
did not lead to operation of the water dipper, and did not
occasion the animal's trip to the dipper and the start of a
new trial.
Initial learning
Upon initial exposure to all holes, all rats probed most of
the holes. Over the course of the first 6 sessions of FI 1 s
with all holes available, the distribution of responses
narrowed, becoming both more focused on the target
hole, and becoming less variable overall. This is visible in
Figure 3, where the average distance of hole-pokes from
the target hole is plotted as a function of number of
reinforcers (n). The curves are simple power functions,
which are often used to describe learning curves:
d n = d1n − β
(1)
where d n is distance in cm around the time of the nth reinforcer, the parameter d1 is the average distance projected
to the time of the first reinforcer, and β is the rate of learning. Both strains start from an average distance of d1 = 7.1
cm, but the rate of learning is faster for WKY (β = 0.32)
than for SHR (β = 0.22).
In Figure 4, response variability, expressed as entropy, is
plotted as a function of reinforcers during acquisition. For
both strains, the decreasing variability is described by
Equation 1. The SHR start slightly more variable (U = 3.7)
and may focus more slowly (β = 0.13) than WKY (U = 3.0,
Figure
The
per
forcers)
during
100
average
the
3events
as first
a distance
function
6(hole-pokes,
sessions
of athe
hole-poke
of number
visits
FI 1 sto from
of
thereinforcers
water
the target
cup,received
and
hole,
reinThe average distance of a hole-poke from the target hole,
per 100 events (hole-pokes, visits to the water cup, and
reinforcers) as a function of the number of reinforcers
received during the first 6 sessions of FI 1 s. The acquisition
curves are drawn by Equation 1.
β = 0.18). Given the width of the error bars, however, all
that can be said with confidence is that the entropy curve
for the SHR lies above that for the WKY. The reduction in
variability of responding was largely due to the convergence of behavior onto the operant target hole.
The holes around the periphery provided additional
stimulation which seemed more attractive than the neutral holes. Figure 2 shows, however, that any additional
attractiveness of the stimulus holes may be attributed to
their spatial layout, not their sensory consequences.
Delay-of-reinforcement gradients
To what extent can a reinforcer increase the probability of
not only the response that immediately preceded it, but
also the probability of other, earlier responses? Figure 5
shows real delay-of-reinforcement gradients calculated
from all sessions testing FI < 300s and the last 21 sessions
testing FI 300 in the manner detailed in the procedure section. They are shown on a logarithmic x-axis to highlight
the time intervals closest to reinforcement. The data are
pooled across all animals within a strain. The curves
through the data are exponential processes, such as those
represented in Equation 2, where the parameter c gives the
height of the gradient above its asymptotic level, b, at the
time of reinforcement (t = 0). The parameter lambda gives
the rate of decrease in the gradient as a function of the
time between a response and the ensuing reinforcer. The
additive constant b measures the asymptotic probability
of emitting the same response on succeeding trials.
Figure
The
poke,
the
of
FInumber
average
1dipper
s 4 of
entropy
approach,
reinforcers
of and
hole-poking,
received
reinforcement)
during
per 100
the
asevents
first
a function
6 sessions
(holeof
The average entropy of hole-poking, per 100 events
(hole-poke, dipper approach, and reinforcement) as a
function of the number of reinforcers received during the
first 6 sessions of FI 1 s. The acquisition curves are drawn by
Equation 1 acting on entropy (U = -Σplog2(p)), the sum of the
logarithms of the probabilities of visiting each hole weighted
by that probability.
Page 6 of 11
(page number not for citation purposes)
Behavioral and Brain Functions 2007, 3:60
/>
FigureFI
Delay-of-reinforcement
testing
pooled
over
5 < 300s
eightand
SHR
theand
gradients
lasteight
21 sessions
WKY
calculated
rats
testing
fromFIall300
sessions
and
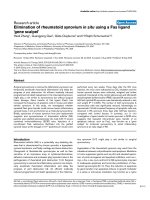
Delay-of-reinforcement gradients calculated from all sessions
testing FI < 300s and the last 21 sessions testing FI 300 and
pooled over eight SHR and eight WKY rats. The influence of
a reinforcer is measured as the probability that a response at
a given remove from the reinforcer would reappear somewhere in the next interval. For these data, the curves start
equally high for SHR and WKY (c + b equals 0.617 and 0.647,
respectively) while rate of decrease is faster for SHR (λ =
0.63 s-1) than WKY (λ = 0.38 s-1).
Influence = ce-λt + b
(2)
Whereas Figure 5 gives a representative summary of the
delay-of-reinforcement gradients, a more precise account
is obtained by fitting Equation 2 to the data of individual
rats, weighting each time bin by the number of opportunities for observing a repetition it contains. The results of
this analysis are presented in Table 2 where their contribution to the average was weighted by the average goodness
of fit of the model to their data. There is no strain difference in the immediate impact of the reinforcer (measured
by the coefficient c), or in the asymptotic probability
(measured by the additive constant b), but there is an
obvious difference in the impact of the reinforcer on the
responses preceding it: For SHR, the reach of the reinforcer is restricted to the preceding one second, whereas
for WKY it extends almost four times as far.
An alternate analysis that excludes the water hole
responses yields flatter gradients with WKY lying above
SHR, thus showing their generally greater susceptibility to
reinforcement.
Subsequent performance
The allocation of responses continued to converge on the
target hole with ongoing experimentation. Figure 6 shows
Figure
The
successive
300s
average
and6 the
FI distance
values
last 21calculated
sessions
from thetesting
for
target
all FI
sessions
hole
300as atesting
function
FI
successive FI values calculated for all sessions testing FI <
300s and the last 21 sessions testing FI 300. An approximately linear convergence on the central water hole draws
concave functions on these coordinates.
Table 2: Parameters describing the delay-of-reinforcement
gradients
Average Parameters (SEM)
Strain
c
λ
b
SHR
WKY
0.506 (0.048)
0.528 (0.039)
3.89 (0.63)
0.95 (0.38)
0.111 (0.011)
0.119 (0.025)
Note. – The average parameters of the equation. Influence = ce-λt + b
representing the delay-of-reinforcement gradients for every rat. The
parameters of each rat were weighted by the goodness of fit of that
model to their data. The semi-interquartile ranges of the parameters
are in parentheses. All sessions testing FI< 300s and the last 21
sessions testing FI 300 s were used for analyses of influence functions.
that the SHR continued to explore other holes more than
the WKY up to the longest FI, where both rate of
responding and distance from the target hole decreased
substantially.
Discussion
The dynamic developmental theory of ADHD suggests
that dopamine hypofunction produces a narrower time
window for associating preceding stimuli, behavior, and
its consequences, behaviorally described as a steeper and
shorter delay-of-reinforcement gradient. The theory also
suggests that dopamine hypofunction causes slowed
extinction of inadequate behavior. These changes in basic
learning mechanisms are suggested to produce symptoms
of ADHD and increased behavioral variability [13]. In a
Page 7 of 11
(page number not for citation purposes)
Behavioral and Brain Functions 2007, 3:60
strictly behavior-analytic sense, delay-of-reinforcement
gradients can not be considered explanatory (it would be
a category mistake to use observations of behavior to
explain behavior). However, the theory is also based on
neurobiological evidence and knowledge of how reinforcement processes are linked to dopamine function.
Hence, evidence of dopamine dysfunction in ADHD [13]
combined with findings on how dopamine modulates
neuronal activity and plasticity is an explanation of why
effects of reinforcers are altered in ADHD and how
dopamine dysfunction translates into what in behavioral
terms can be described by a steepened delay-of-reinforcement gradient.
The present study examined behavioral variability, elimination of non-operant responses, and properties of the
delay-of-reinforcement gradient in an animal model of
ADHD, the spontaneously hypertensive rat (SHR). SHR
and Wistar Kyoto (WKY) controls were tested in operant
chambers presenting 20 response alternatives (holes in
the wall). Nose-pokes in a target hole produced water
reinforcers according to fixed interval schedules of reinforcement, while nose-pokes in the remaining 19 holes
either had no consequences, or produced a brief sound or
a short flickering of the houselight (Figure 1). The stimulus-producing holes were included in the present study to
test whether light and sound act as sensory reinforcers in
SHR [23].
Behavioral variability and elimination of non-target nose
pokes
The dynamic developmental theory of ADHD states that a
combination of a short delay-of-reinforcement gradient,
which will hamper the establishment of long integrated
behavioral chains, and a deficient extinction process will
result in increased behavioral variability [13,20,25,26]. In
the present study, entropy and Euclidean distance were calculated for responding across the response alternatives
during the first six sessions following response shaping
and used as measures of intra-individual behavioral variability. The results provide support for the suggestion of
increased behavioral variability in SHR compared to WKY
controls. Response variability, expressed by entropy,
started out higher in SHR than in the controls (Figure 4).
Variability decreased as training progressed, largely due to
the convergence of behavior onto the operant target hole
(Figure 3), consistent with Antonitis' early work showing
that variability of nose pokes in rats decreased as a function of number of reinforcers [27]. The rate of convergence
was faster for the WKY, markedly in focusing of distance
(Figure 3) but slightly in decrease in variability (Figure 4).
More holes were explored by SHR than WKY up to the
longest FI where both rate of responding and distance
from the target hole decreased substantially (Figure 6).
/>
The present data do not show that light and sound have
reinforcing properties in SHR [23]. There was little or no
differential use of the stimulus-producing holes by either
strain, as seen in Figure 2. The flatter generalization gradient in SHR relative to WKY controls (Figure 2) might be
interpreted as a spatial discrimination problem in SHR,
possibly producing more variable responding. Using a
spatial memory maze, Low and co-workers [28] also
found more variable behavior in SHR compared to WKY
controls. However, while a possible spatial discrimination
problem in SHR cannot be ruled out, studies have shown
that SHR behave more variable in lever-pressing tasks
with only two response alternatives [18,29,30] and independently of the reinforcement contingencies [31], suggesting that behavioral variability in SHR has other
origins.
Focusing of behavior onto the operant hole and decrease
in variability were retarded for SHR in the present study,
consistent with the dynamic developmental theory which
predicts retarded elimination of ineffective responses in
SHR [13,20,25,26]. The theory predicts that behavior in
both strains starts out variable and then become organized as a function of learning, but more slowly in SHR.
However, the present findings show that behavioral variability, as expressed by entropy (Figure 4), also seems to
start out higher in SHR relative to WKY controls. Hence,
while the slower decrease in behavioral variability in SHR
may be related to deficient learning processes, initial variability may be unrelated to reinforcement processes, or
could be linked to the general behavior-inducing effects of
the presence of reinforcers (below).
The delay-of-reinforcement gradient
The effect of a reinforcer on a response decreases as the
time interval between the response and reinforcer delivery
is lengthened [32], which also applies to responding
during FI schedules [33]. Here, delay-of-reinforcement
gradients were calculated for SHR and controls by dividing the fixed interval into epochs and counting the various
responses within each epoch that recurred in the next
interval. As the time to reinforcement varied across the
epochs, we could calculate how this time interval affected
reinforcer effectiveness: How much did reinforcement of
a response in a particular epoch contribute to responding
in the next fixed interval trial. The results support the suggested steepened and shorter delay-of-reinforcement gradient in SHR compared to WKY [18]. The impact of a
reinforcer on the preceding responses is restricted to the
preceding one second in SHR whereas for WKY it extends
nearly four times as far (Figure 5). No significant strain
differences in the immediate impact of a reinforcer (the
intercept at a delay of 0 s) or in the asymptotic probability
were found.
Page 8 of 11
(page number not for citation purposes)
Behavioral and Brain Functions 2007, 3:60
The finding of a steepened delay-of-reinforcement
gradient in SHR relative to WKY controls is consistent
with previous studies using both water reinforcers and
intra-cranial self-stimulation (ICSS) [16,18-22]. In a study
by Evenden and Meyerson [34], SHR and WKY controls
were required to make a minimum number of consecutive
presses on one lever before switching to another lever for
a final lever-press to produce the reinforcer (fixed consecutive number schedule of reinforcement, FCN). They
found that SHR made fewer long chains on the FCN
schedule, consistent with the steepened delay-of-reinforcement gradient seen in Figure 5[34]. Hand and coworkers [35] used a 15-s resetting reinforcer delay procedure and demonstrated retarded response acquisition in
SHR compared to WKY controls. Consistent with a steepened delay-of-reinforcement gradient, SHR exhibited
lower response rates and earned fewer reinforcers during
reinforcer delay, but responded more during immediate
reinforcer delivery than WKY controls [35].
The delay-of-reinforcement gradients found in the present
study are short given Hand and co-workers' findings [35]
and the demonstrated ability of rats to learn new
responses at delays of up to 30 s (e.g., [36,37]). However,
there are many competing responses in the current experiments, and the rapid delivery of the reinforcer and the
change in the constellation of responses as a function of
learning all contribute to this shortening of the gradient.
This difference in gradients could be a by-product of the
hyperactivity of the SHR, which fills the delay interval
with more, and more diverse, behaviors than it does for
the WKY, and depresses the gradient by making diverse,
rather than target hole responses, more attractive to SHR.
However, such an account does not explain why hyperactivity in SHR develops [18,19]. The dynamic developmental theory explains the increase in activity as the combined
effect of selective reinforcement of short interresponse
times and deficient extinction [13,14]. The theory suggests
that the delay-of-reinforcement gradient is steeper and
shorter, and initially lower, in SHR compared to WKY
controls. Although the effect of reinforcers is lower in
SHR, the theory suggests that a steepened delay-of-reinforcement gradient means that mainly short interresponse
times are reinforced, leading to an increased activity level.
Deficient extinction would add to activity level by inadequate pruning of ineffective behavior [13,14].
The delay gradients calculated in the present study are
independent of overall rates of responding. Thus, a second possibility is that SHR hyperactivity is produced by a
delay-of-reinforcement gradient that is steeper and
shorter, but starts higher, in SHR compared to WKY controls [15]. This means that a reinforcer immediately following a response has a higher effect in SHR than in WKY
controls, producing a higher rate of responding. However,
/>
our data show that number of pokes in the target hole was
similar in the two strains (approximately 1200; Figure 2 is
truncated at 400 responses), suggesting that the effect of
immediate reinforcers is similar in SHR and WKY (Figure
5). Still, SHR did have a higher rate of responses than WKY
controls, the strain difference mainly produced by the
higher rate of visits to the neutral holes in SHR (Figure 2).
If the higher rate of visits to the neutral holes in SHR is
caused by a genuine discrimination problem, it will cause
problems for how we calculated the delay-of-reinforcement gradients because the underlying logic is that a reinforced response will be repeated in the same hole in the
next fixed interval. If the exact repetition of a response is
problematic for SHR due to a discrimination problem, the
implication is that the impact of an immediate reinforcer
may be higher in SHR than in WKY controls.
However, a third possibility is that the behavior-inducing
effects of reinforcers contribute to SHR overactivity. Presence of reinforcers increases general activity [38], a process that may be linked to physiological arousal and
noradrenergic function [39]. Reinforcer presence may
produce more arousal and induce more behavior in SHR
than in controls, consistent with studies showing elevated
noradrenergic levels [40,41] and increased sympathetic
nervous system activity in SHR compared to WKY controls
[42]. The higher level of induced general behavior in SHR
may show up as higher initial behavioral variability
compared to WKY controls. Additionally, effects of
periodic reinforcers seem to cumulate [38] predicting
that SHR hyperactivity will develop as a function of
exposure to reinforcers, consistent with previous
observations [17-19].
Theories of reinforcement have suggested that behavioral
arousal and the selective strengthening of behavior with
favorable outcomes are independent components of the
reinforcement process (e.g. [43,44]). Hence, while it is
conceivable that the steepened delay-of-reinforcement
gradient calculated for SHR in the present study is an artifact of the overactivity and increased behavioral variability
in SHR, both behavioral arousal and the selective
strengthening of behavior could be changed in SHR.
Indeed, studies manipulating reinforcer delay while keeping reinforcer frequency relatively constant have shown
that SHR behavior is more sensitive to reinforcer delay
than WKY controls [19,22,35]. This suggests that a steepened delay-of-reinforcement gradient in SHR is not secondary to behavioral arousal but is making an
independent contribution to behavior in SHR, consistent
with studies showing both dopamine and noradrenaline
changes in SHR [17,41]. A steepened delay-of-reinforcement gradient in SHR would imply slower and less efficient response differentiation than in normal controls.
The combination of increased behavioral arousal
Page 9 of 11
(page number not for citation purposes)
Behavioral and Brain Functions 2007, 3:60
produced by reinforcers and a steepened delay-ofreinforcement gradient in SHR is consistent with present
findings: Increased behavioral variability both initially as
well as with continued training, slowed response differentiation (Figures 3 and 4), and a steepened delay-ofreinforcement gradient (Figure 5). Additionally, it also
predicts the previously observed development of hyperactivity as a function exposure to reinforcers [17-19], the
increased sensitivity to reinforcer delay in SHR [19,22,35],
and the higher rate of responses with short interresponse
times consistently observed in SHR [16,18]. However,
although the suggestion of increased behavioral arousal
produced by reinforcers combined with a steepened
delay-of-reinforcement gradient in SHR seems to integrate
several findings, and is supported by some evidence, it
needs further testing.
Conclusion
The dynamic developmental theory of ADHD suggests
that reinforcement and extinction processes are altered in
ADHD due to dopamine dysfunction, and suggests that
the altered reinforcement processes behaviorally can be
described as a steeper and shorter delay-of-reinforcement
gradient in ADHD compared to normal controls. The theory has outlined how a steeper delay-of-reinforcement
gradient and deficient extinction can produce the main
behavioral symptoms of ADHD: Inattention, hyperactivity, and impulsivity, in addition to increased behavioral
variability that seems to be a characteristic of ADHD.
The results support the hypothesized steeper and shorter
delay-of-reinforcement gradient in the animal model, and
provided some support for the increased behavioral variability suggested by the dynamic developmental theory of
ADHD: Behavior was more variable initially, decreased
somewhat slower, and settled into comparable levels of
variability only with extended training.
In conclusion, altered reinforcement processes may be a
characteristic of an ADHD phenotype. Investigations on
how reinforces work in ADHD may provide new insights
into symptom development, sources of behavioral variability, and how behavior most efficiently can be focused
onto adequate behavior favored by parents and teachers.
This knowledge may lead to the development of more
optimal interventions and treatment strategies.
/>
manuscript. All authors were involved in interpreting the
data, read and approved the final manuscript.
Acknowledgements
This paper is part of the project "Attention-Deficit/Hyperactivity disorder
(ADHD): From genes to therapy" conducted at the Centre for Advanced
Study (CAS) at the Norwegian Academy of Science and Letters, in Oslo
during the Academic year 2004/05.
The authors acknowledge Dr. Geir Sagvolden for designing the interfaces
and writing the programs for the on-line system recording the behavior and
scheduling reinforcers. Arne Terje Gulbrandsen and Asbjørn Løve performed the daily behavioral testing. Expert technical services were provided by Trond Reppen, Bjarne Authen and Ingeborg Spinnangr.
The present study was supported by various grants from the Research
Council of Norway, the University of Oslo to TS, by NSF IBN 0236821 and
NIMH 1R01MH066860 to PRK; and, by grants from the Centre for
Advanced Study (CAS) at the Norwegian Academy of Science and Letters
to all three.
References
1.
2.
3.
4.
5.
6.
7.
8.
9.
10.
11.
12.
13.
Competing interests
The author(s) declare that they have no competing
interests.
14.
Authors' contributions
15.
TS designed study and supervised the experiment. EBJ had
the main responsibility of writing the manuscript. PRK
performed the mathematics and wrote parts of the
16.
Association AP: Diagnostic and statistical manual of mental disorders:
DSM-IV 4th edition. Washington, D.C., Author; 1994:78-85.
Swanson JM, Sergeant JA, Taylor E, Sonuga-Barke EJS, Jensen PS,
Cantwell DP: Attention-deficit hyperactivity disorder and
hyperkinetic disorder. Lancet 1998, 351:429-433.
Taylor E, Sergeant J, Doepfner M, Gunning B, Overmeyer S, Möbius
HJ, Eisert HG: Clinical guidelines for hyperkinetic disorder. Eur
Child Adolesc Psychiatry 1998, 7:184-200.
Douglas VI, Parry PA: Effects of reward on delayed reaction
time task performance of hyperactive children. J Abnorm Child
Psychol 1983, 11:313-326.
Douglas VI, Parry PA: Effects of reward and nonreward on frustration and attention in attention deficit disorder. J Abnorm
Child Psychol 1994, 22:281-301.
Sonuga-Barke EJ, Taylor E, Sembi S, Smith J: Hyperactivity and
delay aversion--I. The effect of delay on choice. J Child Psychol
Psychiatry 1992, 33:387-398.
Wender PH: Minimal brain dysfunction in children New York, Wiley;
1971.
Kollins SH, Lane SD, Shapiro SK: Experimental analysis of childhood psychopathology: A laboratory matching analysis of
the behavior of children diagnosed with Attention-Deficit
Hyperactivity Disorder (ADHD). Psychol Rec 1997, 47:25-44.
Tripp G, Alsop B: Sensitivity to reward frequency in boys with
attention deficit hyperactivity disorder. J Clin Child Psychol 1999,
28:366-375.
Sagvolden T, Aase H, Zeiner P, Berger DF: Altered reinforcement
mechanisms in Attention-Deficit/Hyperactivity Disorder.
Behav Brain Res 1998, 94:61-71.
Luman M, Oosterlaan J, Sergeant JA: The impact of reinforcement contingencies on AD/HD: a review and theoretical
appraisal. Clin Psychol Rev 2005, 25:183-213.
Sagvolden T, Sergeant JA: Attention deficit/hyperactivity disorder--from brain dysfunctions to behaviour. Behav Brain Res
1998, 94:1-10.
Sagvolden T, Johansen EB, Aase H, Russell VA: A dynamic developmental theory of Attention-Deficit/Hyperactivity Disorder
(ADHD) predominantly hyperactive/impulsive and combined subtypes. Behav Brain Sci 2005, 28:397-419.
Johansen EB, Aase H, Meyer A, Sagvolden T: Attention-deficit/
hyperactivity disorder (ADHD) behaviour explained by dysfunctioning reinforcement and extinction processes. Behav
Brain Res 2002, 130:37-45.
Catania AC: Precommentary: Attention-deficit/hyperactivity
disorder (ADHD): Delay-of-reinforcement gradients and
other behavioral mechanisms. Behav Brain Sci 2005, 28:419-424.
Sagvolden T: Behavioral validation of the spontaneously
hypertensive rat (SHR) as an animal model of attention-
Page 10 of 11
(page number not for citation purposes)
Behavioral and Brain Functions 2007, 3:60
17.
18.
19.
20.
21.
22.
23.
24.
25.
26.
27.
28.
29.
30.
31.
32.
33.
34.
35.
36.
37.
38.
39.
40.
deficit/hyperactivity disorder (AD/HD). Neurosci Biobehav Rev
2000, 24:31-39.
Russell VA, Sagvolden T, Johansen EB: Animal models of attention-deficit hyperactivity disorder. Behav Brain Func 2005, 1:9.
Sagvolden T, Russell VA, Aase H, Johansen EB, Farshbaf M: Rodent
models of attention-deficit/hyperactivity disorder. Biol Psychiatry 2005, 57:1239-1247.
Johansen EB, Sagvolden T, Kvande G: Effects of delayed reinforcers on the behavior of an animal model of attention-deficit/
hyperactivity disorder (ADHD).
Behav Brain Res 2005,
162:47-61.
Johansen EB, Sagvolden T, Aase H, Russell VA: Authors' response:
The dynamic developmental theory of attention-deficit/
hyperactivity disorder (ADHD): Present status and future
perspectives. Behav Brain Sci 2005, 28:451-468.
Johansen EB, Sagvolden T: Slower extinction of responses maintained by intra-cranial self-stimulation (ICSS) in an animal
model of attention-deficit/hyperactivity disorder (ADHD).
Behav Brain Res 2005, 162:22-31.
Johansen EB, Sagvolden T: Behavioral effects of intra-cranial
self-stimulation in an animal model of attention-deficit/
hyperactivity disorder (ADHD).
Behav Brain Res 2005,
162:32-46.
Sagvolden T, Hendley ED, Knardahl S: Behavior of hypertensive
and hyperactive rat strains: Hyperactivity is not unitarily
determined. Physiol Behav 1992, 52:49-57.
Killeen PR: Writing and overwriting short-term memory. Psychon Bull Rev 2001, 8:18-43.
Aase H, Sagvolden T: Moment-to-Moment Dynamics of ADHD
Behaviour. Behav Brain Func 2005, 1:12.
Aase H, Meyer A, Sagvolden T: Moment-to-moment dynamics of
ADHD behaviour in South African children. Behav Brain Func
2006, 2:11.
Antonitis JJ: Response variability in the white rat during conditioning, extinction, and reconditioning. J Exp Psychol 1951,
42:273-281.
Low WC, Whitehorn D, Hendley ED: Genetically related rats
with differences in hippocampal uptake of norepinephrine
and maze performance. Brain Res Bull 1984, 12:703-709.
Mook DM, Jeffrey J, Neuringer A: Spontaneously hypertensive
rats (SHR) readily learn to vary but not repeat instrumental
responses. Behav Neural Biol 1993, 59:126-135.
Mook DM, Neuringer A: Different effects of amphetamine on
reinforced variations versus repetitions in spontaneously
hypertensive rats (SHR). Physiol Behav 1994, 56:939-944.
Hunziker MH, Saldana RL, Neuringer A: Behavioral variability in
SHR and WKY rats as a function of rearing environment and
reinforcement contingency. J Exp Anal Behav 1996, 65:129-144.
Dews PB: Free-operant behavior under conditions of delayed
reinforcement I Crf-type schedules. J Exp Anal Behav 1960,
3:221-234.
Dews PB: The effect of multiple Sd periods on responding on
a fixed-interval schedule. J Exp Anal Behav 1962, 5:369-374.
Evenden J, Meyerson B: The behavior of spontaneously hypertensive and Wistar Kyoto rats under a paced fixed consecutive number schedule of reinforcement. Pharmacol Biochem
Behav 1999, 63:71-82.
Hand DJ, Fox AT, Reilly MP: Response acquisition with delayed
reinforcement in a rodent model of attention-deficit/hyperactivity disorder (ADHD). Behav Brain Res 2006, 175:337-342.
Lattal KA, Gleeson S: Response acquisition with delayed reinforcement. J Exp Psychol Anim Behav Process 1990, 16:27-39.
Williams B: Associative competition in operant conditioning:
Blocking the response-reinforcer association. Psychon Bull Rev
1999, 6:618-623.
Killeen PR, Hanson SJ, Osborne SR: Arousal: its genesis and manifestation as response rate. Psychol Rev 1978, 85:571-581.
Aston-Jones G, Rajkowski J, Kubiak P, Alexinsky T: Locus coeruleus
neurons in monkey are selectively activated by attended
cues in a vigilance task. J Neurosci 1994, 14:4467-4480.
de Villiers AS, Russell VA, Sagvolden T, Searson A, Jaffer A, Taljaard
JJF:
alpha2-Adrenoceptor
mediated
inhibition
of
[3H]dopamine release from nucleus accumbens slices and
monoamine levels in a rat model for Attention Deficit
Hyperactivity Disorder. Neurochem Res 1995, 20:357-363.
/>
41.
42.
43.
44.
Russell VA: Hypodopaminergic and hypernoradrenergic activity in prefrontal cortex slices of an animal model for attention-deficit hyperactivity disorder --- the spontaneously
hypertensive rat. Behav Brain Res 2002, 130:191-196.
Judy WV, Watanabe AM, Henry DP, Besch HR Jr., Murphy WR,
Hockel GM: Sympathetic nerve activity: role in regulation of
blood pressure in the spontaenously hypertensive rat. Circ
Res 1976, 38:21-29.
Killeen PR: Mathematical Principles of Reinforcement. Behav
Brain Sci 1994, 17:105-172.
Killeen PR, Sitomer MT: MPR. Behav Processes 2003, 62:49-64.
Publish with Bio Med Central and every
scientist can read your work free of charge
"BioMed Central will be the most significant development for
disseminating the results of biomedical researc h in our lifetime."
Sir Paul Nurse, Cancer Research UK
Your research papers will be:
available free of charge to the entire biomedical community
peer reviewed and published immediately upon acceptance
cited in PubMed and archived on PubMed Central
yours — you keep the copyright
BioMedcentral
Submit your manuscript here:
/>
Page 11 of 11
(page number not for citation purposes)