Therapeutic monitoring of serum digoxin for patients with heart failure using a rapid LC MSMS method
Bạn đang xem bản rút gọn của tài liệu. Xem và tải ngay bản đầy đủ của tài liệu tại đây (410.44 KB, 7 trang )
Available online at www.sciencedirect.com
Clinical Biochemistry 43 (2010) 307 – 313
Therapeutic monitoring of serum digoxin for patients with heart failure
using a rapid LC-MS/MS method
Shuijun Li a,b , Gangyi Liu a , Jingying Jia a , Yi Miao a , Shuiming Gu c , Peizhi Miao c ,
Xueying Shi d , Yiping Wang b , Chen Yu a,⁎
b
a
Central Laboratory, Shanghai Xuhui Central Hospital, 966 Huaihai Middle Road, Shanghai 200031, China
State Key Laboratory of Drug Research, Shanghai Institute of Materia Medica, Chinese Academy of Sciences, Shanghai 201203, China
c
Department of Cardiology, Shanghai Xuhui Central Hospital, Shanghai 200031, China
d
Department of Nuclear Medicine, Shanghai Xuhui Central Hospital, Shanghai 200031, China
Received 12 July 2009; received in revised form 5 September 2009; accepted 30 September 2009
Available online 13 October 2009
Abstract
Objective: Here we develop a liquid chromatography tandem mass spectrometry (LC-MS/MS) method for the determination of digoxin in
serum.
Design and methods: The serum samples were extracted with methyl tert-butyl ether using an isotope-labeled digoxin-d3 as internal standard.
The analyte was separated on a reverse phase Capcell C18 column and detected in positive electrospray ionization multiple reaction monitoring
mass spectrometry.
Results: The chromatographic analysis was carried out within 3 min, but the complete analysis took longer because of the liquid–liquid
extraction. The lower limit of quantification was 0.1 ng/mL for digoxin. The intra- and inter-batch precisions were less than 12%, and the bias
ranged from −9.1% to 10.7%. The external quality assessment (EQA) results obtained with the LC-MS/MS method were comparable to target
values. Subsequently, this method has been applied to the therapeutic monitoring of digoxin in a clinical setting.
Conclusion: In this study, we have developed a rapid and reliable LC-MS/MS method for the therapeutic monitoring of digoxin in human
serum.
© 2009 The Canadian Society of Clinical Chemists. Published by Elsevier Inc. All rights reserved.
Keywords: Digoxin; LC-MS/MS; Liquid–liquid extraction; Therapeutic drug monitoring; Heart failure; Human serum
Introduction
Digoxin is commonly prescribed for the treatment of heart
failure (HF) in clinical practice. Data from the Digitalis Investigation Group (DIG) trial, a randomized double-blinded placebocontrolled study, demonstrated that digoxin reduced hospitalizations among patients with HF and decreased the risk of death
attributed to worsening HF [1–3]. The role of serum digoxin
⁎ Corresponding author. Fax: +86 21 54043676.
E-mail addresses: (S. Li),
(G. Liu), (J. Jia),
(Y. Miao), (S. Gu), (P. Miao),
(Y. Wang), (C. Yu).
concentration (SDC) is well established, as many studies have
suggested that the effectiveness of digoxin therapy in patients
with HF should be optimized in the range of 0.5–0.9 ng/mL. A
SDC above 1.2 ng/mL may be harmful [4–6] and the traditional
range of 0.8–2.0 ng/mL for SDC is now questioned, because this
new lower therapeutic window is associated with improvement
of clinical outcomes [7]. Therefore, a more intensive dosage
refinement is proposed [8].
The measurement and assessment of digoxin concentration
are often performed inappropriately and the quality of SDC
monitoring is poor [9–11]. Hence, it is necessary to introduce
therapeutic drug monitoring (TDM) of digoxin, in order to
optimize therapeutic efficacy and avoid the incidence of
toxicity. In most cases, immunoassay techniques are the primary
method used for monitoring of digoxin in clinical practice.
0009-9120/$ - see front matter © 2009 The Canadian Society of Clinical Chemists. Published by Elsevier Inc. All rights reserved.
doi:10.1016/j.clinbiochem.2009.09.025
308
S. Li et al. / Clinical Biochemistry 43 (2010) 307–313
Nevertheless, cross-reactivity with endogenous digoxin-like
substances [12] and interference from other drugs, including a
number of herbal medicines [13,14], may be the main obstacle to
accurate determination of digoxin in real clinical samples. This
makes LC-MS/MS, a technique with significant advantages of
specificity and sensitivity, the most appropriate method for
digoxin monitoring, as it is free of interferences from endogenous and exogenous compounds. Recently, many LC-MS or
LC-MS/MS methods for digoxin have been reported for the
purposes of drug monitoring, pharmacokinetic studies, or drug
interaction investigations [15–21]. Some of these methods use
gradient elution program for chromatographic separation. As a
result, a long turnaround is required (14 min [15], 17 min [16],
10 min [21]) to restore the column to its original starting
conditions. Some reported methods use lengthy sample preparation [15,18,20,21], or 96-well plate [16,17], which further
increase both turnaround time and cost. Consequently, there is
still a critical need for a method that addresses both rapid
throughput and economy for the TDM of digoxin in routine
clinical practice.
The aim of this paper is to build a rapid and reliable method
for the TDM of serum digoxin concentration for patients with
heart failure. Our protocol is based on a technique of stable
isotope dilution liquid chromatography-positive electrospray
ionization tandem mass spectrometry. A simple and economical
liquid–liquid extraction with methyl tert-butyl ether is adopted
using 0.2 mL of sample volume. The total turnaround per
analysis is only 3 min and this greatly improves the assay
throughput. The validated method has been subsequently
applied to national EQA and clinical drug monitoring of
digoxin in patients with heart failure.
NH4Ac/0.1% formic acid in water and 0.1% formic acid in
acetonitrile and was run at an isocratic elution (60:40, v:v). The
sample injection volume was 20 μL and the total run time was
3 min per injection.
Mass spectrometry
A 3200 QTRAP tandem mass spectrometer (Applied
Biosystems/MDS Sciex, Toronto, Canada) equipped with
Turbo Ionspray source was used for quantitative analysis. The
instrument was operated in positive ionization mode with an ion
spray voltage at 5.5 kV and the source temperature at 400 °C.
Multiple reaction monitoring (MRM) was used to detect
digoxin and digoxin-d3, with precursor to product ion transitions of m/z 798.6/651.5 and m/z 801.6/654.5, respectively.
The collision-activated dissociation (CAD) was set at medium.
High purity nitrogen was used as the collision gas. The curtain
gas, gas 1, and gas 2 were set at 20, 50, and 50, respectively.
Dwell time of 200 ms was selected. Analyst 1.4.2 software was
used for instrument control and data acquisition.
Standard solutions
Materials and methods
Standard stock solutions of digoxin and digoxin-d3 (internal
standard) were separately prepared at 0.1 mg/mL in methanol
and stored at 4 °C. Dilutions were made to prepare calibration
standards, at serial concentrations of 0.1, 0.4, 1, 4, and 10 ng/
mL, by spiking appropriate amount of digoxin stock solution
into blank serum. Quality control (QC) samples were prepared
in the same way, at concentrations of 0.3, 1.5 and 8 ng/mL. All
of the spiked standards were stored at − 20 °C. A working
solution of internal standard was prepared from digoxin-d3
stock at 10 ng/mL in 40% methanol and stored at 4 °C.
Chemicals and reagents
Liquid–liquid extraction
Digoxin (98.0% purity) was purchased from National
Institute for the Control of Pharmaceutical and Biological
Products, Beijing, China. [2H3] digoxin (digoxin-d3) was
purchased from Toronto Research Chemicals Inc., North
York, Ontario, Canada. HPLC-grade acetonitrile, methanol,
ammonium acetate, formic acid, and methyl tert-butyl ether
were purchased from Tedia Company Inc., Fairfield, USA. All
other reagents were of analytical grade. Double distilled water
was used throughout the study.
A 200 μL serum sample was mixed with 20 μL isotopelabeled internal standard working solution (10 ng/mL) and then
extracted with 1 mL methyl tert-butyl ether by vortexing for
5 min. The mixture was subsequently centrifuged at 12 000 rpm
for 5 min. The upper layer was transferred to a clean
polypropylene tube and dried with a stream of nitrogen gas at
45 °C. The residue was reconstituted in 100 μL 40% methanol
and 20 μL was injected onto the LC column for LC/MS/MS
analysis.
Liquid chromatography
Method validation
HPLC analysis was performed on a Shimadzu system
(Kyoto, Japan) equipped with two LC-20AD pumps, a SILHTC autosampler, and an online DGU-20A3 vacuum degasser.
Chromatographic separation was achieved on a Capcell C18
MG III analytical column (100 mm × 2.0 mm I.D. 5 μm,
Shiseido, Japan) coupled with a C18 guard column
(4.0 mm × 3.0 mm I.D. 5 μm, Phenomenex, USA) at a flow
rate of 0.3 mL/min. The column and autosampler were kept at
room temperature. The mobile phase consisted of 10 mM
The method was evaluated by validation of the extraction
recovery, matrix effect, linearity, precision and accuracy, and
stability in three independent runs. The validation procedure
was performed in respect to the guideline for the bioanalytical
method validation recommended by U.S. Food and Drug
Administration [22].
The linearity of the method was evaluated by a calibration
curve prepared in duplicate over a range of 0.1–10 ng/mL
digoxin in serum. A linear regression using 1/x weighting was
S. Li et al. / Clinical Biochemistry 43 (2010) 307–313
constructed based on the measured peak area ratio of digoxin to
the internal standard, versus the nominal concentration. The
linearity was considered acceptable when the correlation
coefficient (r) was higher than 0.99.
Precision (expressed by RSD for replicate measurements)
and accuracy (expressed by the percentage of bias between
nominal and calculated concentrations) were evaluated by analysis of six replicates of QCs at four concentration levels (0.1,
0.3, 1.5 and 8 ng/mL) for three randomized batches.
The recovery and matrix effect were assessed by comparing
the peak areas of digoxin from blank serum, neat QC chemical
standards, and standards spiked before and after extraction, in
six different lots of pooled sera at three concentration levels.
Stock solution stability, three cycles of freeze–thaw stability,
309
bench-top stability, and post-processing stability were all
checked as part of method validation.
External quality assessment (EQA) and therapeutic drug
monitoring (TDM)
After being validated, the LC-MS/MS method was evaluated
by participating national external quality assessment (EQA)
program (2008–2009) offered by National Center for Clinical
Laboratory, Ministry of Health of China. The program is offered
two times a year, with five blind serum samples each time.
The method was applied to therapeutic drug monitoring of
digoxin in patients with heart failure in a clinical setting.
Patients who had been clinically diagnosed with heart failure
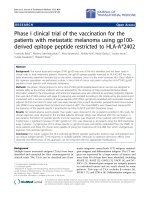
Fig. 1. Q1 full scan spectra of digoxin (a) and internal standard digoxin-d3 (b), the ion adducts are annotated.
310
S. Li et al. / Clinical Biochemistry 43 (2010) 307–313
were orally administrated digoxin at 0.125 mg/day. Blood
samples were collected into heparinized tubes after digoxin had
reached a stable state concentration. The time of blood drawing
was at least 6 h following digoxin intake. Samples were
centrifuged at 3000 rpm for 10 min and the resulting serum was
stored at −20 °C until analysis.
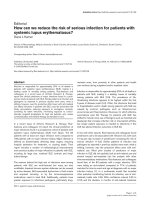
its IS, indicating a good selectivity for the method. The retention
time was about 1.6 min, allowing a turnaround of 3 min per
injection, but the complete analysis took longer because of the
liquid–liquid extraction. The signal to noise (S/N) at the LLOQ
was more than 10.
Method validation
Results
LC-MS/MS optimization
A variety of molecular ions for digoxin, including [M –H2O]+,
[M +H]+, [M +NH4]+, [M +Na]+ , [M +K]+ , [M +HCOOH]+
and [M +CH3COOH]+, were observed in Q1 positive full-scan
with respective m/z at 763.9, 781.9, 798.9, 803.9, 819.7, 826.9,
and 840.0, respectively (Fig. 1a). A similar ion addition pattern
was observed for the digoxin-d3 internal standard by adding a
mass of 3 to each of these ions (Fig. 1b). A higher abundance was
found for the ammonium addition of [M +NH4]+, which was
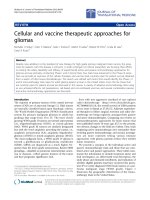
used for further fragmentation in product ion scan. The product
ions were obtained by fragmentation of the ammonium adduct
precursor ion in a collision cell. Products with m/z at 651.8,
521.6 and 391.4 were produced by the losses of glycosides from
digoxin one by one. The product ion mass spectra of digoxin are
presented in Fig. 2. Multiple reaction monitoring (MRM) mode
was used for quantitative detection, with sensitive ion transitions
of m/z 798.6/651.5 and 802.6/654.5 for digoxin and its internal
standard, respectively. Fig. 3 presents typical chromatograms of
blank human serum, blank serum spiked with digoxin at the
LLOQ level, and serum from a patient who had been orally
administered a 0.125-mg digoxin tablet. As shown in the
chromatograms, the baseline was flat and no endogenous
interference was observed at the retention time of digoxin or
Compared with an equal amount of digoxin chemically
spiked to post-extracted blank serum, the extraction recovery
was 83.9–87.1% by using liquid–liquid extraction with methyl
tert-butyl ether as extraction solvent. Table 1 shows the results
of extraction recovery and the matrix effect for digoxin and its
IS, by comparing the mean peak areas obtained from six
different lots of pooled sera after extraction with methyl tertbutyl ether. Although the matrix effect of 64.9–68.6% seems
insufficient for LC-MS/MS analysis, good reproducibility and
consistency were obtained by using an isotope-labeled internal
standard.
The linearity was evaluated by analyzing three batches of
standard curves over the concentration range of 0.1–10 ng/mL
in human serum. Table 2 shows the linearity results of digoxin
in human serum. Good linearity was observed over the quantification range when a linear regression was used with 1/x
weighting. The correlation coefficients (r) were greater than
0.9961 for all analytical batches, with a bias within ±12%.
The intra- and inter-batch precision and accuracy are
summarized in Table 3. These were obtained by spiking blank
human serum at the LLOQ (0.1 ng/mL), and low (0.3 ng/mL),
medium (1.5 ng/mL) and high (8.0 ng/mL) QC levels, then
analyzing these in six replicates each batch, for three randomized analytical batches. The intra- and inter- batch precisions
were less than 10% and 12%, respectively, and the bias ranged
Fig. 2. Product ion spectra from [M +NH4]+ m/z 798.6 and the fragmentation pattern of digoxin.
311
S. Li et al. / Clinical Biochemistry 43 (2010) 307–313
Table 2
Mean inter-assay calibration curve results of digoxin in human serum (n = 2 for
three batches).
Nominal concentration RUN1
(ng/mL)
RUN2
RUN3
Mean %RSD %Bias
0.1
0.4
1
4
10
Intercept
Slope
R
0.090
0.417
1.067
4.013
9.914
0.0 262
0.931
0.9 986
0.086
0.455
1.034
4.511
9.458
0.0 279
0.937
0.9 961
0.088
0.423
1.063
4.285
9.656
0.088
0.396
1.089
4.333
9.595
0.0 405
0.889
0.9 967
1.77
7.17
2.60
5.89
2.42
− 12.00
5.65
6.33
7.13
− 3.44
Digoxin was considerably stable after three freeze–thaw
cycles, on bench top at room temperature for 8 h, in
autosampler at room temperature for 24 h, and in storage at
− 20 °C for at least 1 month. The stability results are listed in
Table 4. The stock solution of digoxin was stable in methanol
for up to one year when kept at 4 °C. The working solution
was found to be stable for a week at 4 °C.
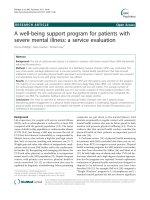
External quality assessment results
The EQA results determined by our LC-MS/MS method
are comparable to the target values, which were established
by 73 participants in 2008 and 66 participants in 2009 in
China. Linear regression analysis was performed to define the
relationship between LC-MS/MS values (y) and EQA target
values (x), the regression formula was y = 0.92x + 0.034
(r = 0.99). Linear regression correlation between the values
obtained with LC/MS/MS digoxin method and the EQA
target values was presented in Fig. 4.
Application to therapeutic drug monitoring
from − 5.2% to 8.3% and − 9.1% to10.7%, respectively. The
values were within acceptable range and the method proved
sufficiently precise and accurate.
The LC-MS/MS method was applied to determine the
serum digoxin concentrations from heart failure patients
receiving a dose of 0.125 mg/day of digoxin therapy. Among
48 collected serum samples, only 7 samples (14.6%) fell into
the clinically recommended range of 0.5–0.9 ng/mL. The
digoxin concentrations in 37 samples (77.1%) were found to
be higher than the target range, while 4 samples (8.3%) were
lower. Among the over-therapeutic-range samples, 13
samples (27.1%) had digoxin concentrations higher than
2 ng/mL.
Table 1
Extraction recovery and matrix effect of digoxin and its internal standard
obtained from six different lots of pooled sera (RSD listed in bracket).
Table 3
Accuracy and precision results of digoxin in human serum (n = 6 for three
batches).
Fig. 3. Typical chromatograms of blank human serum (a), blank serum spiked
with digoxin at the LLOQ (0.1 ng/mL digoxin) level (b), and serum collected
from a patient who had been orally administered a 0. 125-mg digoxin tablet (c).
Concentration
(ng/mL)
0.3
1.5
8
Extraction recovery
(% RSD)
Matrix effect
(% RSD)
Digoxin
IS
Digoxin
IS
85.2 (8.3)
83.9 (5.5)
87.1 (3.6)
82.4 (7.1)
78.8 (6.2)
81.7 (4.8)
68.6 (8.6)
64.9 (7.2)
66.7 (5.3)
68.6 (6.7)
67.6 (5.7)
67.3 (6.4)
Nominal concentration
(ng/mL)
0.1
0.3
1.5
8.0
Intra-assay (n = 6)
Inter-assay (n = 18)
%RSD
%Bias
%RSD
%Bias
4.25
9.83
4.44
4.99
−5.18
3.93
8.29
− 4.81
11.79
7.87
4.65
5.82
− 9.1
3.71
10.69
1.23
312
S. Li et al. / Clinical Biochemistry 43 (2010) 307–313
Table 4
Stability of digoxin in human serum.
Nominal concentration
(ng/mL)
Found concentration
(ng/mL)
%RSD
Freeze–thaw stability (three cycles)
0.3
0.31
1.22
1.5
1.53
3.87
8.0
7.98
2.42
Bench top stability (room temperature for 8 h)
0.3
0.29
10.08
1.5
1.59
5.78
8.0
7.66
5.20
Auto-sampler stability (room temperature for 24 after processing)
0.3
0.30
5.43
1.5
1.50
2.35
8.0
7.93
2.55
Long-term storage stability (− 20 °C for 3 months)
0.3
0.30
4.71
1.5
1.59
2.21
8.0
7.94
1.28
%Bias
3.33
2.00
− 0.25
−3.33
6.00
− 4.25
0.31
0.12
− 0.88
0.03
6.00
− 0.75
Discussion
Here we have described a rapid, economical, specific and
reliable liquid chromatography electrospray ionization tandem
mass spectrometry method for the quantification of serum
digoxin. The analytical performance parameters including
linearity, precision, accuracy, recovery, matrix effect, and stability were fully validated. The digoxin assay with LC-MS/MS
method demonstrated high-throughput in terms of turnaround
and cost-saving in terms of inexpensive reagents used for the
sample preparation.
After being scanned with flow injection analysis at a continuous flow of standard solution, digoxin produced the most
intense molecular ion of ammonium addition [M +NH4]+ at m/z
798.9. The most intense product ion at m/z 651.8 was produced
by loss of a glycoside from the molecular ion. The ion transition
of 798/651 was subsequently optimized, which was also
employed by other reports [16,18,20], for the digoxin MS/MS
monitoring. Furthermore, we found that ion source temperature
affects the stability of ammonium adduct ion. Therefore, we
studied the impacts of different source temperatures on the
intensity of the digoxin response. The best sensitivity was
obtained when the source temperature was set at 400 °C.
In our method, we used methyl tert-butyl ether, a commonlyused and inexpensive solvent, for the liquid–liquid extraction
procedure. During sample preparation, an isotope-labeled
digoxin-d3 was used as the internal standard. As a result of it,
good reproducibility and consistency were obtained during
method validation. This effectively eliminated systematic errors
during the process of sample preparation, chromatographic
separation, and ionization in MS. Isotope dilution mass spectrometry (IDMS) provided data with reliable accuracy and
precision [23–25].
The accuracy of the results with the proposed LC-MS/MS
method was demonstrated by participating in external quality
assessment (EQA) program (2008–2009) offered by National
Center of Clinical Laboratory, Ministry of Health, China. Our
LC-MS/MS digoxin method was capable of giving results close
to the target value.
After being validated, our method was applied to the
therapeutic monitoring of digoxin in a clinical setting. Among
the collected serum samples from heart failure patients
receiving a dose of 0.125 mg/day of digoxin therapy, only
14.6% fell into the recently recommended therapeutic window
(0.5–0.9 ng/mL). These types of sub- or over-therapeutic
concentrations of digoxin may bring potential risks of digoxin
toxicity or inefficiency during clinical therapy. Therefore,
therapeutic drug monitoring of digoxin is essential for dosage
adjustment regimens in order to obtain desirable therapy outcome in clinical practice. With regard to the timing of the blood
drawing for the digoxin TDM, digoxin will reach maximum
serum concentration within 1–2 h following drug intake. Then
its serum concentration will rapidly reduce within 5 h and
maintain to a stable state 6–7 h after the drug intake. Therefore
it should be reminded the importance to wait at least 6–7 h after
the drug intake before performing a blood drawing for digoxin
determination.
In conclusion, a LC-MS/MS protocol was developed and
validated for the analysis of digoxin in human serum extracted
with methyl tert-butyl ether. The method used isotope-labeled
digoxin-d3 as an internal standard. After separation by reverse
phase liquid chromatography, digoxin was detected with
electrospray ionization tandem mass spectrometry. The method
allowed a rapid chromatographic separation, with a total run
time of 3 min for sample analysis, and a sensitive detection with
a LLOQ of 0.1 ng/mL. The validated method was demonstrated
to be acceptable in the EQA program and subsequently applied
to therapeutic drug monitoring of digoxin in patients with heart
failure who were receiving digoxin therapy in routine clinical
practice.
Acknowledgments
Fig. 4. Linear regression comparing the values obtained with LC/MS/MS
digoxin method vs. the national EQA target values.
This work was funded by research grant 08411966700 from
Science and Technology Commission of Shanghai Municipality, Shanghai, China, and partly funded by research grant
05II028 from Shanghai Health Bureau, Shanghai, China.
S. Li et al. / Clinical Biochemistry 43 (2010) 307–313
References
[1] The Digitalis Investigation Group. The effect of digoxin on mortality and
morbidity in patients with heart failure. N Engl J Med 1997;336:525–33.
[2] Ahmed A, Waagstein F, Pitt B, et al. Effectiveness of digoxin in reducing
one-year mortality in chronic heart failure in the Digitalis Investigation
Group trial. Am J Cardiol 2009;103:82–7.
[3] Ahmed A, Rich MW, Love TE, et al. Digoxin and reduction in mortality
and hospitalization in heart failure: a comprehensive post hoc analysis of
the DIG trial. Eur Heart J 2006;27:178–86.
[4] Ahmed A. Digoxin and reduction in mortality and hospitalization in
geriatric heart failure: importance of low doses and low serum
concentrations. J Gerontol A Biol Sci Med Sci 2007;62:323–9.
[5] Adams KF, Patterson JH, Gattis WA, et al. Relationship of serum digoxin
concentration to mortality and morbidity in women in the digitalis
investigation group trial: a retrospective analysis. J Am Coll Cardiol 2005;
46:497–504.
[6] Rathore SS, Curtis JP, Wang Y, et al. Association of serum digoxin
concentration and outcomes in patients with heart failure. JAMA 2003;
289:871–8.
[7] Terra SG, Washam JB, Dunham GD, et al. Therapeutic range of digoxin's
efficacy in heart failure: what is the evidence? Pharmacotherapy 1999;19:
1123–6.
[8] Bauman JL, DiDomenico RJ, Viana M, et al. A method of determining the
dose of digoxin for heart failure in the modern era. Arch Intern Med
2006;166:2539–45.
[9] Ellington C, Grgurinovich N, Miners JO, et al. Quality of requests for
serum digoxin concentrations: experience from an Australian regional
health service. Br J Clin Pharmacol 2007;63:623–7.
[10] Sidwell A, Barclay M, Begg E, et al. Digoxin therapeutic drug monitoring:
an audit and review. N Z Med J 2003;116:U708.
[11] Steimer W, Muller C, Eber B. Digoxin assays: frequent, substantial, and
potentially dangerous interference by spironolactone, canrenone, and other
steroids. Clin Chem 2002;48:507–16.
[12] Jones TE, Morris RG. Discordant results from “real-world” patient
samples assayed for digoxin. Ann Pharmacother 2008;42:1797–803.
[13] Reyes MA, Actor JK, Risin SA, et al. Effect of Chinese medicines Chan Su
and Lu-Shen-Wan on serum digoxin measurement by Digoxin III, a new
digoxin immunoassay. Ther Drug Monit 2008;30:95–9.
313
[14] Dasgupta A. Herbal supplements and therapeutic drug monitoring: focus
on digoxin immunoassays and interactions with St. John's wort. Ther Drug
Monit 2008;30:212–7.
[15] Kirby BJ, Kalhorn T, Hebert M, et al. Sensitive and specific LC-MS assay
for quantification of digoxin in human plasma and urine. Biomed
Chromatogr 2008;22:712–8.
[16] Hashimoto Y, Shibakawa K, Nakade S, et al. Validation and application of
a 96-well format solid-phase extraction and liquid chromatography-tandem
mass spectrometry method for the quantitation of digoxin in human
plasma. J Chromatogr B Analyt Technol Biomed Life Sci 2008;869:
126–32.
[17] Smalley J, Marino AM, Xin B, et al. Development of a quantitative
LC-MS/MS analytical method coupled with turbulent flow chromatography for digoxin for the in vitro P-gp inhibition assay. J Chromatogr
B Analyt Technol Biomed Life Sci 2007;854:260–7.
[18] Mitamura K, Horikawa A, Yamane Y, et al. Determination of digoxin in
human serum using stable isotope dilution liquid chromatography/
electrospray ionization-tandem mass spectrometry. Biol Pharm Bull
2007;30:1653–6.
[19] Kaiser P, Akerboom T, Wood WG, et al. A novel LC-IDMS/MS method
for the determination of the cardiac glycosides digoxin and digitoxin using
caesium adducts. Clin Lab 2006;52:37–42.
[20] Yao M, Zhang H, Chong S, et al. A rapid and sensitive LC/MS/MS assay
for quantitative determination of digoxin in rat plasma. J Pharm Biomed
Anal 2003;32:1189–97.
[21] Tracqui A, Kintz P, Ludes B, et al. High-performance liquid chromatography-ionspray mass spectrometry for the specific determination of
digoxin and some related cardiac glycosides in human plasma.
J Chromatogr B Biomed Sci Appl 1997;692:101–9.
[22] U.S. Food and Drug Administration, Bioanalytical Method Validation.,
U.S. Department of Health and Human Services Food and Drug
Administration, Center for Drug Evaluation and Research, May 2001.
[23] Meija J, Mester Z. Paradigms in isotope dilution mass spectrometry for
elemental speciation analysis. Anal Chim Acta 2008;607:115–25.
[24] Vogeser M, Parhofer KG. Liquid chromatography tandem-mass spectrometry (LC-MS/MS)–technique and applications in endocrinology.
Exp Clin Endocrinol Diabetes 2007;115:559–70.
[25] Bowers GN, Fassett JD, Et White. Isotope dilution mass spectrometry and
the National Reference System. Anal Chem 1993;65:475R–9R.