Some research results on erosion and deposition in the coastal zone of haiphong journal of water resources and environmental engineering
Bạn đang xem bản rút gọn của tài liệu. Xem và tải ngay bản đầy đủ của tài liệu tại đây (138.21 KB, 9 trang )
Journal of Water Resources and Environmental Engineering, No. 23, November 2008
Some research results on erosion and deposition
in the coastal zone of Haiphong
Tran Anh Tu1 and Tran Duc Thanh2
Abstract: Haiphong is a major industrial and port city in Vietnam. It plays an important role in the coastal
shipping routes in the northern part of Vietnam. In recent years, the deposition and erosion of the coastal
zone of Haiphong has increased in terms of intensity and scale, which has seriously influenced the socialeconomic activities of the area. Of Haiphong’s 125 km coastline, approximately 16.1 km is being eroded
(about 23.0%). The erosion occurs at Dinh Vu Island, the southern part of Bai Nha Mac, alongside of the
road No14, Cat Hai Island and Phu Long area at a rate of 1.2 to 9.6 m/year (averaging 5.4 m/year). The
deposition in the coastal zone of Haiphong occurs in a complicated manner also, especially in the Cam River.
Annually, the amount of dredging of the river bed is about 2.5 to 2.9 million tonnes. In addition, southwest of
the Doson Peninsula is strongly affected by the deposition phenomenon. This leads to a difficulty in
construction of the deep-sea port in the area.
Keywords: erosion, deposits, deep-sea port.
1. Introduction
The deposition and erosion phenomena of the coastal zone is one of the most important
natural processes, causing the loss of land and deposition of sediment in port areas, thus
influencing local social-economic activities. The Haiphong Port is one of the biggest ports
in Vietnam (the cargo handled was 15 millions tons in 2007). In the development plan of
the Haiphong port, the construction of a new port in the Doson Peninsula are currently
being developed.
The coastline of Haiphong is 125 kilometers long, and it has five estuaries belonging to the
Hong-Thai Binh River system that run into the sea. The erosion occurs in the Dinh Vu
Island area, the south of Bai Nha Mac, alongside of the road No.14, Cat Hai Island and Phu
Long areas at a rate of 1.2 to 9.6 m/year, 5.4 m/year on average [3]. However, sediment
deposition in the estuary and channels in recent years has increased, obstructing the
activities of the port. In addition, the south-west of the Doson Peninsula is also strongly
affected by sediment deposition. Therefore, building the deep-sea port in this area in the
future will be pressured from sediment deposition from the channels.
This paper presents preliminary results of sediment erosion and deposition in the coastal
zone of Haiphong, and discuss the implications of these processes on the environment and
the Haiphong Port extension.
1
Institute of Marine Environment and Resources (IMER)/ Vietnamese Academy of Science and Technology;
246 Da Nang Street, Hai Phong City; Tel. 084 0313 760605; E-mail:
2
Institute of Marine Environment and Resources (IMER)/ Vietnamese Academy of Science and Technology;
246 Da Nang Street, Hai Phong City; Tel. 084 0313 760605; E-mail:
143
Journal of Water Resources and Environmental Engineering, No. 23, November 2008
2. Material and method
This paper uses the data produced by several projects, including the National Project
KHCN-5a “Research of Prediction and Control of Coastal Erosion in the North of Vietnam
from Quang Ninh to Thanh Hoa” completed in 2000 (reference), and the basic project of
IMER “Assessment of erosion, deposition situation and propose usage of the southern-west
of the Doson peninsula” completed in 2002 (reference), and the project “Prediction of
erosion and deposition phenomena in coastal zone estuaries in the Northern area and
solutions to prevent” 2004 (reference).
The following basic methods were used:
- Analysis and integration of data.
- Statistics of data in meteorology and hydrology.
- Application of SBEACH (Numerical Model for
Simulating Storm-Induced Beach Change) to
calculate the height of the sea bottom according to
section in a short period.
- CERC method to calculate transport of mud and
sand by coastal wave
- Analysis of effect of deposition, erosion by
Sundborg diagram.
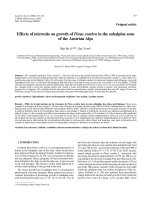
Figure 1. The Map of Study Area
3. Results and discussion
3.1. Erosion in the coastal zone of Cat Hai Island
• Results of the calculation of sand transport along the coastline caused by wave energy
using the CERC model in Cat Hai:
The calculation was done at three different points Ben Got, Gia Loc and Hoang Chau.
Based on survey data of wave in March (dry season), sediment transportation was
calculated in Ben Got toward to the eastern was of -894 m3, in Gia Loc toward to the
eastern was of -148 m3 and Hoang Chau toward to the western was of 205 m3, the
transportation at Gia Loc occurs in both directions Ben Got and Hoang Chau. In August
(rainy season), these values were 6,065 m3, 7,421 m3, 7,644 m3, respectively, and the
transportation was from Ben Got to Hoang Chau (the western). Calculated for twelve
months, the volume of sediment transported at Ben Got was 98,370 m3, at Gia Loc was
131,656 m3 and at Hoang Chau 163,617 m3. The results showed that, in all years, all three
areas lost sediments toward the northwest of Hoang Chau [2].
• Results of the calculation of erosion and deposition frequency according to Sundborg
diagram in Cat Hai:
- In the dry season (March), there was an erosional trend in Cat Hai area. The Gia Loc area
experienced the most erosion (58.9%), in which the erosion was in the west and weak in
the east. At Hoang Chau, erosion was on average (25.9%), in which the erosion in the east
was stronger than in the east. The deposition at Ben Got was on average level (<30%), the
deposition in the east was stronger than in the west [4].
144
Journal of Water Resources and Environmental Engineering, No. 23, November 2008
- In the rainy season (August), the erosional trend occurs in the Cat Hai area also. In Hoang
Chau, Ben Got, the trend and volume of the erosion and deposition was the same as the dry
season, in Gia Loc, there was deposition trend in the east and erosion trend in the west.
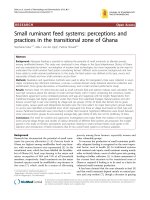
• The calculation results of bottom variation according to the SBEACH model in Cat
Hai:
Calculated with the same conditions (size of sedimentation Md, height of wave,…) for
both rainy and dry season, the results were similar:
- There was bottom scrape phenomena in all the sections, but its distribution was different
from the coast to the sea (Figure 2).
- In Hoang Chau: the maximum of bottom scrape was 0.060 m, far from the coast was
about 250m.
- In Gia Loc: the bottom scrape was occurred in length 180-260 m from the coast, the
maximum of bottom scrape was 0.072 m.
- In Ben Got: the bottom scrape was occurred in length 180-260 m from the coast, the
maximum of bottom scrape was 0.066 m.
Change the depth in b cross-section
(gia loc - Cat Hai) rainy season (08/2000)
0.08
0.08
0.06
0.06
0.04
0.04
Height (m)
Height (m)
Change the depth in a cross-section
(hoang chau - Cat Hai) rainy season (08/2000)
0.02
0
0.02
0
0
1000
2000
3000
4000
5000
6000
-0.02
0
1000
2000
3000
4000
5000
6000
-0.02
Distance from the coast (m)
Distance from the coast (m)
Change the depth in c cross-section
(ben got - Cat Hai) rainy season (08/2000)
Figure 2. Calculation Chart of bottom variation
according to SBEACH model in Cat Hai Haiphong (source [5])
0.08
Height (m)
0.06
0.04
0.02
0
0
1000
2000
3000
4000
5000
6000
-0.02
Distance from the coast (m)
The coastal zone in Cat Hai has an eroded coastal length of about 6200 m (table 1). Of this,
4000 m of breakwater was very weak and dangerous due to the concentration of residents
near coast in Gia Loc-Hoa Quang (1500 m), in Van Chan-Hoang Chau (2500m). In the
period from 1930 to 1996, the sea encroached the island by about 230 m at the Cat Hai
Town area, 360 m at Van Chan-Hoang Chau area and 600 m at Gia Loc area. The coastal
145
Journal of Water Resources and Environmental Engineering, No. 23, November 2008
length in Cat Hai Town and Van Chan was stoned soon so the rate of erosion has been
reduced in recent years, the coastal length in Gia Loc has continued to undergo natural
erosion, at a rate of up to 21 m/year.
Table 1. The erosion evolution in Cat Hai coast (source [2])
Period
1930 - 1965
1965 - 1900
1900 - 2000
Number of erosion sections
3
5
3
Total of erosion length (m)
6000
6200
6400
Among: weak
0
3700
3060
average
1800
0
0
strong
4200
0
2040
very strong
0
2500
1300
Average erosion velocity (m/year)
4.5
5.0
12.9
Max erosion velocity (m/year)
8.5
10.0
50.0
Velocity of erosion (m/year)
2.7
3.09
8.27
Assessment shows that, the surface of ground near the dike footing was scraped at a rate of
15 to 32 cm/year. In the last seventy years, although the coast was protected by a dike
system, the scale of erosion in Cat Hai has increased a small amount, but the intensity of
the erosion has increased significantly and the total area of erosion was 250 ha. Beside the
of erosion in high banks, more than 1000 ha of low tidal flats were also eroded and scraped
into pools with depths ranging from 0.5 to 2.0 m. A prediction for the velocity of natural
erosion in the Cat Hai coastal area for the next twenty years is about 6.5 to 26.5 m/year, 1.0
m/year in average [2].
3.2. Erosion situation in Dinh Vu pesunanly
Table 2. The erosion evolution in coastal zone of Dinh Vu and neigbough areas (source [3])
Section
Period 1965 - 1994
Status
Length (m)
Average velocity
(m/year)
Area (m²)
South of Vu Yen
erosion
890
1.2
30972
Dinh Vu
erosion
3000
8.6
498800
o
The road N 14
erosion
3400
4.2
414120
South of Bai Nha Mac
erosion
1700
1.2
59160
South Cat Hai
erosion
6400
6.4
454720
Phu Long
erosion
3300
9.6
918720
18690
5.4
2376492
Total
By application of GIS and Remote sensing using SPOT multi-spectrometer photographed
in 1994, IKONOS photographed in 2001 and data from field surveys [3], it was showed
that: in the south and the south-east of Dinh Vu, the zero line of the sea chart (0m) in 1934
was directed near parallel with channels of Cua Cam and Nam Trieu, it created two
sandbars at low tide and last to the sea and get close two estuaries. Section of low tidal flat
in the south, the zero line of sea chart was uneven, saw-tooth shape. In 1991, the tail and
middle sections of sand bars were cut and pushed toward the south-east creating high sand
146
Journal of Water Resources and Environmental Engineering, No. 23, November 2008
bars with tops that were higher than
the average seawater level. The zero
line of sea chart had saw-tooth shape
of low tidal flat in the south of Dinh
Vu that was deposited and widened
toward the sea by eroded sediment
from the high tidal flat. The general
change of the zero line of sea chart
was expanded toward the south (Cam
Estuary) - the largest section was 800
m - but eroded in Nam Trieu Estuary
and creating sand bars higher than the
average seawater level. These sand
bars had trend to transport into the
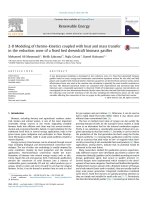
Figure 3. The chart of deposition- erosion in south-east of
west and reach distance from 700 to
Dinh Vu area in 1965-1980-2001 (source [3])
800 m. Ten years after building of
Dinh Vu Dam (1991), the Cua Cam
Channel behind Dinh Vu Dam was absolutely deposited and become to low tidal flat, the
erosion length of Dinh Vu was about 300 m (table 2). In 2001, twenty years after building
of Dinh Vu Dam, the Cua Cam Channel behind Dinh Vu Dam was higher than the average
seawater level and it was banked into aquaculture ponds. At present, the distance of Dinh
Vu and Trang Cat coasts is only 100 to 200 m and it was used as canal to collect and
irrigate water for aquaculture ponds.
In summary, the trend of deposition and erosion in the south and south-east Dinh Vu was
erosion of high tidal flat, deposition in the channel and low tidal flats that occurred in long
time ago. Noticeably, after 1981, with the completion of Dinh Vu Dam, deposition of
channels and low shore in the west and south-west of Dinh Vu increased suddenly and
filled up the Cua Cam Channel, and it begins to occur the trend of widen deposition of high
tidal flat. However, in the section of the concreted dyke in the south of Dinh Vu to Nam
Trieu Estuary, deposition in high tidal flat has slowly reduced, and erosion has occurred at
many high banks.
At present, there is a depositional trend of low tidal flats and deep canals by natural
processes and by the Dinh Vu Dam building, but in the high coast in the south-east of Dinh
Vu is strong eroded continuously. This result was originated from the facts and was
determined by comparison of two high coasts (2,3m/0m) on the SPOT multi-spectrometer
satellite photo taken in 1994 and the IKONOS photo taken in 2001. On the coastal length
of near 1500m from the concreted dyke to Dinh Vu that was building in seven years (19942001), the high coast was eroded continuously. The intensive coastal erosion in the southeast of Dinh Vu can be divided into four levels: strong (velocity > 10 m/year) occupied
about 10.3%, a mildly strong (5 to 10 m/year) occupied 24%, average (2.5 to 5 m/year)
occupied 31.5%, and weak (<2.5m/year) occupied 34.2%. Thus, about one-third of coast in
the south-east of Dinh Vu underwent strong erosion (>5m/year), one-third underwent
average erosion and one- third underwent weak erosion.
The study result of deposition and erosion variation of average coastline in the south- east
of Dinh Vu showed that:
- In the period from 1965 to 1980 (before building of Dinh Vu Dam), this was the period
that the erosion was strongest with the highest velocity 11.8 m/year. The eroded coast was
1,610 m long, occupied 83% of the erosion/deposition coast length and the strongest
eroded coast was 1,250 m long, occupied 64.4% of erosion/deposition coast length and
147
Journal of Water Resources and Environmental Engineering, No. 23, November 2008
occupied 77.6% of eroded coast length (Figure 3). Average velocity of erosion was 7.7
m/year. The strongest erosion coast was about 1 km from the concrete dyke toward the
eastern part. There were two old sand bars in this area before, and outside of old sand bars
was high tidal flat with mangrove.
Table 3. Deposition-erosion variation of average coastline in the southeast of Dinh Vu in 1980-2001 (source
[3])
The average
coast length
(m)
The average
coast width (m)
Area (ha)
Deposition
Erosion
Blance erosiondeposition
Average
velocity
(m/year)
1100
150
16.5
-
+16.5
+7.1
210
52
-
1.1
-1.1
-2.5
150
53
-
0.8
-0.8
-2.5
300
10
-
0.03
-0.03
-0.5
16.5
1.93
14.6
+3.5
Total: 1490
(+) The blance and velocity of deposition, (-) The blance and velocity of erosion
- In period from 1980 to 2001 (Dinh Vu Dam was completed), the effect of Dinh Vu Dam
to the average coast was quite high express in the reduce of not only erosion velocity but
also the length of the erosion coast. (table 3). However, as analyzed in the 1994 SPOT
image and 2001 IKONOS image, it was showed that the coast was continuously eroded in
seven years with an average velocity of 4.2 m/year. According to survey data of
bathymetry and our survey results in last ten years [3], although the low tidal flat in the
southeast of Dinh Vu had a deposition trend toward the sea, there were always existence of
a small canal far away from the average coast about 250-500m and last to the northeastsouthwest then changed into south-north. This canal eroded low tidal flats and created
shallow (1 to 1.5 m deep) pools compared to the surface of the tidal flat.
148
Journal of Water Resources and Environmental Engineering, No. 23, November 2008
3.3. Deposition status in the coastal zone of Haiphong
The coastal zone of Hai Phong is facing a sediment
deposition problem, especially for the channels
entering Hai Phong Port. The port was built along
the Cam-Bach Dang Estuary. These two rivers
control the hydrodynamic regime of the area, and
both flow to the sea through Nam Trieu Estuary.
The total annual average water discharge through
the Nam Trieu Estuary was 12 km3 and the mudsand discharge was approximate 5.0 million tons.
The concentration of sand is high and changes
depending on the season. In the rainy season, the
average turbidity changed in range of 53 to 215 g/m3
to a maximum of 700 to 964 g/m3. In the dry season,
the average turbidity changed in range from 42 to 94
g/m3 to a maximum of 252 to 860 g/m3, turbidity
was high in the mouth of the river due to the wave
and tidal current. The mud-sand amount in August
was highest, comprising 35 to 40% of total mudsand of the year, the mud-sand amount in March
was lowest, only 0.5 to 1.0% total mud-sand of the
year [6]. According to table 4, in the period from
2001 to 2005, the annual dredging volume of the
channel and Hai Phong Port was 2.3 to 2.9 million m3.
Table 4. The dredging amount in port of
Haiphong
Year
Dredging amonut
(milion m3) (*)
2001
2.950
2002
2.361
2003
2.404
2004
2.845
2005
2.470
Fisrt quarter in 2006
1.480
(*): the above amount did not include the
dreading amount of the Improve Project
of Haiphong port phase II in 2004-2005
for Ha Nam canal and Lach Huyen.
Source: Hai Phong Port Administration,
2006.
Table 5. Predicted results of isobathymetry contour site in the southwest of Do Son area in the next 50 years
compared to 2002 (source: [1])
Velocity and site of isobathymetry contour compare to 2002
Radian coast
Cong Hong
2.5 km
Average
seawater level
Deposition velocity (m/year)
Site compare to Average seawater level in 2002 (m)
0m Sea Chart
Deposition velocity (m/year))
Site compare to 0m Sea Chart 2002 (m)
2m
Deposition velocity (m/year))
Site compare to 2m Sea Chart 2002 (m)
4m
Deposition velocity (m/year))
Site compare to 4m Sea Chart 2002 (m)
Bang La
1.5km
Quan Muc
1.7 km
70
56
50
3500
2800
2500
40
50
30
2000
2500
1500
30
20
20
1500
1000
1000
18
16
14
900
800
700
The coastal zone in the southwest of Do Son Peninsula is the northeast edge of the Hong
River Delta that extends from Do Son to Lach Truong. The evolution of the sedimentary
environment of the area during the Holocene shows that the accumulation of sediment
occurred continuously during the last 80,000 years with an average velocity of 2.2
mm/year. About 3,000 years ago, the velocity of sediment accumulation increased strong
149
Journal of Water Resources and Environmental Engineering, No. 23, November 2008
and reached an average 5 mm/year, exceeding the rising sea water level and depression
tectonic (approximately 3 mm/year). The major supply source of alluvium for the area now
is the Van Uc River with an alluvium discharge of about 11 million tons/year. The average
coastline represents clear phases of erosion and deposition with a cycle of about 30 to 40
years, the average velocity was approximate 10 m/year reaching a maximum of 100 m/year
in short periods of time. The erosion/deposition balance of two phases deposition and
erosion was adjoining each other to trend deposition encroach the sea. The zero line of sea
chart had deposition trend continuously when erosion-deposition balance with average
deposition velocity over 10 m/year, maximum to 70-80m/year, express unclear erosiondeposition phase. In the side of coast, the erosion-deposition balance in isobathymetry
contours showed the continuous deposition trend and encroached toward to the sea clearly
with velocity higher tens times compare to the coast. Prediction, that in the next 5 to 10
years, the deposition velocity of coast and coast side will be the same in the period of ten
years ago, the average coastline will extend from the current coastline by about 500 to
600m, the zero line of sea chart for deposition will come to sea about 600-700m, and in
depth about 4-12m, the deposition velocity will be as strong as at present. In next twenty
year, the deposition velocity of coast and submarine coast will reduce compared to the
1992 to 2002 period but many times higher compared to 1934 to 1965 period, the average
coast will have shape similar to one meter height contour upper the zero line of sea chart at
present. In the next 50 years, the side of submarine coast near shore with deposition
activity of wave will create submarine sand bar in the southeast of Hon Dau, the zero line
of sea chart will come across to Van Set bay, near the current isobathymetry contour 2m
and the average coastline will come to near Van Huong bay.
The southwest of the Do Son area belongs to a delta area with strong sediment deposition
characteristics,, the shape is convex toward the sea, the isobathymetry contour and
coastline always changes strongly while the deep-sea port always need to maintain
channels‘s depth over ten meters. Therefore, building of a deep-sea port in this area is not
fit for nature rule.
4. Conclusions
The coastal zone of Hai Phong and the northeastern of Do Son is characterized by Bach
Dang Estuary, the erosion-deposition phenomena are complex and are increasing in terms
of both intensity and frequency in recent years. Noticeable erosion phenomena in Cat Hai
coast, Dinh Vu coast was dominated by a horizontal erosion trend, deposition of channels,
in which deposition of Nam Trieu, Bach Dang Channels, Cam River Channel that get into
Hai Phong Port related natural processes that decided system - geography nature and
geological environment of delta estuary area and even derivative effect of human works
leading change hydrographic structure of delta estuary. The total length of the Hai Phong
eroded coast was 16.1 km, 23% of the 125 km coastline, in which, the erosion
phenomenon in Cat Hai coast was most serious compared to the total coastline of Hai
Phong, after that, it was the southeastern area of Dinh Vu Peninsula. The deposition
phenomena in coastal zone of Hai Phong also occurs complex, especially Cam River
Channel - the major channel of Hai Phong Port. With current deposition velocity, the
dredging amount of channels was 2.5 to 2.9 million tons/year. In addition, the
southwestern part of Do Son Peninsula belongs to a delta area with noticeable deposition
and with the planned building of the deep-sea port in this area there will be high pressure
from deposition from the channel.
150
Journal of Water Resources and Environmental Engineering, No. 23, November 2008
5. References
[1] Dinh Van Huy et al (2002). Assessment of erosion, deposition situation and propose usage of the
southern-west of the Doson peninsula. The basic project of Institute of Marine Environment and
Resources.
[2] Tran Duc Thanh, Nguyen Duc Cu, Nguyen Huu Cu, Do Dinh Chien (2002). Research of Prediction and
Control of Coastal Erosion in the North of Vietnam from Quang Ninh to Thanh Hoa. National Project
KHCN-5a. of Institute of Marine Environment and Resources.
[3] Tran Duc Thanh (2004). Prediction of erosion and deposition phenomena in coastal zone estuaries in the
Northern area and solutions to prevent. Institute of Marine Environment and Resources.
[4] Tran Anh Tu (2001). Application of the Sundborg’ diagram method to contribute to studying sediment
transportation in the Hai Hau coastal area. Marine Resources and Environment, Tome VIII, Science and
Technology Publishing House Hanoi, paper 75-84.
[5] Tran Anh Tu, Do Dinh Chien, Nguyen Tho Sao (2002). Application of SBEACH Model to Calculate
Deformation of Bottom Topography in the South of Cat Hai Island. Marine Resources and Environment,
Tome IX, Science and Technology Publishing House Hanoi, paper 23-32.
[6] Bui Van Vuong, Tran Duc Thanh, Do Thi Thu Huong, Cao Thi Thu Trang (2007). The dredge Hai Phong
port and some affect for environment and sea ecosystem. Vietnam Maritime University, paper 202-209.
151