The sedimentary processes on tidal flats in the north of vietnam initial results and implication future proceedings of VAST
Bạn đang xem bản rút gọn của tài liệu. Xem và tải ngay bản đầy đủ của tài liệu tại đây (2.91 MB, 17 trang )
VIETNAM ACADEMY
OF SCIENCE AND TECHNOLOGY
(VAST)
~
Institut de recherche
pour Ie d'veloppement
INSTITUT DE RECHERCHE
POUR LE DEVELOPPEMENT
(IRD)xwvutsrqponmlkjih
ISBN: 978-604-913-162-2
BAo cso KHOA
HOC
~.
,,?
HOI
THAO VAST - IRD VE KHOA HOC
BIEN
•
•QPONMLKJIHGFEDCBA
,,?
P R O C E E D IN G S O F
V A S T - IR D S Y M P O S IU M O N M A R IN E S C IE N C E
H a ip h o n g - V ie tn a m , N o v e m b e r
"
_,
?
_
28th_29th, 2 0 1 3
"A
_
N H A X U A T B A N K H O A H Q C T V N H IE N V A C O N G N G H I;
PROCEEDINGS
9.
OF VAST -IRD
SYMPOSIUM
5
ON MARINE SCIENCE
Hubert Loisel, Vincent Vantrepotte, Dinh Ngoc Dat, Sylvain Quillon,
Jean-Pierre Lefebvre, Xavier Meriaux, Ph am Minh Thu, Antoine Mangin
96
Analysis of the suspended particulate matter concentration variability of the
coastal waters under the Mekong's influence from remote sensing
10. Le Quang Dung, Nguyen Viet Linh, Nguyen Due Cu, Vu Van Tu
108
Levels of heavy metals in muscles with relation to the growth
of two marine fish speciesxwvutsrqponmlkjihgfedcbaZYXWVUTSRQPONMLKJIHGFEDCBA
II.
117
Judith C. Klein, Nguyen Vu Thanh, Nguyen Dinh Tu,
Nguyen Thanh Hien, Ulrich Saint-Paul
Macrobenthic communities in estuarine mangrove ecosystems subject to
aquaculture activities
12. Cung Thi Ngoc Mai, Le Thi Nhi Cong, Nghiem Ngoc Minh
125
Degradation of naphthalene by biofilm forming rhodococcus sp. bqn 11 isolated
from petroleum-polluted water samples in Quang Ninh coastal zone, Vietnam
13. Vu Duy Vinh, Sylvain Quillon, Jean-Pierre Lefebvre,
Pham Hai An, Le Due Cuong, Nguyen Minh Hai
Tran Anh Tu,
134
Application of a 3d numerical model for simulation of suspended sediment
transport in Bach Dang - Cam estuary (Vietnam)
14. Cao Thi Thu Trang, Ph am Thi Kha, Jean Pascal Torreton
Duong Thanh Nghi, Vu Thi Luu
145
Water quality in Cam - Bach Dang estuary area
15. Chu Van Thuoc, Nguyen Thi Minh Huyen, Duong Thanh Nghi, Vu Thi Luu,
Dinh Van Nhan, Pham The Thu, Do Manh Hao
152
Spatio-temporal variability of phytoplankton in Halong bay: a preliminary result
16. Dang Hoai Nhon, Tran Due Thanh, Dinh Van Huy, Nguyen Thi Kim Anh,
Nguyen Mai Luu, Nguyen Dinh Khang, Phan Son Hai, Nguyen Manh Ha,
Pham Tien Due, Lai Thi Bich Thuy
164
The sedimentary processes on tidal flats in the north of Vietnam: initial results
and implication future
17. Dinh Van Nhan, Chu Van Thuoc, Nguyen Xu an Quynh
A preliminary study on variability oftintinnid
179
(order tintinnida) in Halong bay
186
18. Do Thi Phuong Thao
Biological and physical aggregation/disaggregation
process in mixing jar
19. Tran My Linh, Ninh Khac Ban, Dam Due Tien, Vu Huong Giang, Le Quynh Lien,
Ph an Van Kiem, Chau Van Minh
195
Studies on marine sponge biodiversity in Vietnam: patterns and outlooks
20. Le Quynh Lien, Tran My Linh, Ninh Khac Ban, Chau Van Minh, Tatyana Dautova
202
Molecular marker: an alternative strategy to study biodiversity of soft coralsdcbaZYXWVUTSRQ
(c n id a r ia : o c to c o r a llia )
164
BAo cAo KHOA HOC HOI THAo VAST - IRD V~ KHOA HOC BI~Nxwvutsr
THE SEDIMENTARY PROCESSES ON TIDAL FLATS IN THE
NORTH OF VIETNAM: INITIAL RESULTS AND IMPLICATION
FUTURE
Phan Son Hae, Nguyen Manh Ha\ Ph am Tien Due", Lai Thi Bieh Thuy4 NMLKJIHGF
1
In
dcbaZYXWVUTSRQPONMLKJIHGFEDCBA
s titu te o f M a r in e E n v ir o n m e n t a n d R e s o u r c e s ,
V ie tn a m A c a d e m y
o f S c ie n c e a n d T e c h n o lo g y
(V A S T )
2 N u c le a r R e s e a r c h In s titu te , D a L a t
3
F a c u lty o f C h e m is tr y , H a n o i U n iv e r s ity o f S c ie n c e s
" C e n tr e fo r G e o lo g ic a l A n a ly s is L a b o r a to r y ,
H a N oi
1. SUMMARY
Tidal flats in North Vietnam extending from Mong Cai (Quang Ninh province) to
Kim Son (Ninh Binh province) are affected by human activities and land - ocean
interaction processes. It can be shown in erosion, accretion, accumulation of pollutants
with time. For understanding sedimentary processes on tidal flats, samples from 11
collected sediment cores were in analysis of 210Pb, 226Ra, grain size, metals and
minerals. The sediment parameters on tidal flats are divided in three sedimentary
environment types, including Deltaic tidal flat sedimentary environment from southwest
Do Son Peninsula to Kim Son and dominated by accretion processes, estuarine tidal flat
sedimentary environment from northeast of Do Son Peninsula to southwest of Cat Ba
Islands, and embayment tidal flat sedimentary environment from Cat Ba Islands to
Mong Cai and characterised with slow accretion and small rate of sedimentation.
K eyw ords:
tid a l fla t, s e d im e n ta r y p r o c e s s , N o r th V ie tn a m ,
21O p b ,
h e a v y m e ta ls .
2. INTRODUCTION
Tidal flat which is a kind of coastal wetlands plays an important role for human
life by providing space for socio-economic development and being in high biodiversity
[20]. Because the tidal sediments record many of information on the impacts from
nature and human activities, it is a key factor to understand sedimentary processes.
Tracking environmental changes using many indicators of biology and geochemistry
[12] can help us to get information on environment conditions in the past and at present.
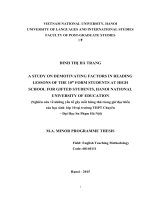
The coastal provinces of North Vietnam extend from Quang Ninh to Ninh Binh
where the rivers discharge to sea through their mouths of Ka Long, Tien Yen, Ba Che,
Troi, Bach Dang, Carn, Lach Tray, Van Uc, Thai Binh, Ba Lat, Ninh Co and Day
(Fig. 1). The channels which bring water from mainland to sea are changing coastal
PROCEEDINGS
OF VAST - IRD SYMPOSIUM
165xwvutsrqponm
ON MARINE SCIENCE
environment conditions. The coastal environments record human impacts, nature events
in sediments, but they are reflected changing with time.
As part of the coastal region of North Vietnam, intertidal zones interest many
scientists, indicating with the number of articles on environmental sediment. These
studies can help us understand environmental conditions as sedimentation and erosion
rates [11, 15, 19,21], geological structure of tidal flats in Holocene [7, 18], sediment
compositions [9, 16] and sediment geochemistry [1, 2, 6, 14, 19]. These publications
have shown that nature and human activities are influenced on the tidal environment.
Our research questions are in the past and at present what the human and the
nature have affected on the tidal environment. By analysis of sediment cores in the tidal
. gram
.. size, 210P b , 226R a, meta Is an d mmera
mi
1s, se diirnentary processes on tiid a 1 fl ats
fl ats m
will be clearer understood.
3. MATERIALS
AND METHODS
3.1.dcbaZYXWVUTSRQPONMLKJIHGFEDCBA
M a te r ia ls
During 2009 - 2012, three campaigns were carried out to collect samples of sediment
cores Me 6 (0-40cm) and Me 5 (0-63cm) in April 2009, Me 8 (0-40cm) and Me 11(050cm) in October 2010, and Me 1(0-90cm), Me 2 (0-70cm), Me 3 (0-70cm), Me 4 (090cm), Me 7 (0-90cm), Me 9 (0-90cm) and Me 10 (0-90cm) in March 2012 (Fig.1).
21'
34'
106· 00'
--
108001'
I
~
(
,<
~ "l' NMLKJIHGFEDCBA
J
-
'%( •
p
f
'"
'.~
VTNHBACB<)
LEGEND
•
COle positions
,
,,+.
s
19.~.>."
55'~
.'
19
•
55'
108001'
106· ~O'
Fig. 1. Position
1
1
of sediment
cores on the tidal flats of North Vietnam
BAo cAo KHOA HOC HOI THAo VAST - IRD ~
166xwvutsrqponmlkjihgfedcbaZYXWVUTSRQPONMLKJIHGFEDCBA
3 .2 .
KHOA HOC BI~NdcbaZY
Methods
We had cut 2.0 em per samples from the top to the end of cores, and kept them at
4°C in field before storing in laboratory. In the laboratory, all sediments are dried in aircondition at 16°C.
Grain sizes of sediment were analyzed by sieves for coarse grain (> 0.063mm) and
particle size analyzers CILAS 990 for fine grain « 0.063mm) after removing salts and
organic matters by distilled water and hydrogen peroxide (10% H 202). Sediment
classification is according to Lisitzin [13].
The 2lOPb analysis in sediments was calculated indirectly by 2lOpO in sediments,
the sediments were extracted by HN03 and HF concentrated. Then we used 0.1 %
diethylammonium diethyldithiocarbamate and chloroform in 5M HCI to absorb 210pO
by silver dish and measured on alpha s£ectrometry. We used 209pO as initial standard
assess recovery of extraction [8]. The 22 Ra in sediments as background were measured
directly by gamma spectrometry. The constant rate supply (CRS) model is used to
calculate chronology
of sediment layers (1). This model was suggested by
Krishnaswami [10], later have been modified [3, 4, 17]. Nowadays, this CRS model is
used very common in calculating sedimentation rate in coastal and estuaries.
(1)
Where t: year;
A constant = 0.031;
A(O) is total of 210Pbexcess
in sediment core elOPbcxccss=210Pbactivity
- 226Ra);
A(x) is 210Pbexcess
in sediment core at depth x.
For metals analysis: Weighed 0.5g dry sediments, then were extracted by 10 ml
8N HN03 and 3ml 30% H 202 under reflux column at 95°C in 15 minutes. After that
samples were cooled and added about 5ml 16N HN03, then kept at 95°C in 2 hours
(Method 3050b), cooled and filtered by 0.45 urn papers (Whatman). Finally, samples
were diluted to 100 ml and measured by using ICP-MS method (Elan 9000 Perkin
Elmer). All chemicals are in grade analysis. For control Q A lQ C of analysis processes,
the certified reference material samples (PACS2, MESS-3) were used.
Minerals in sediments were analyzed by two methods, which were analysis by
thermo gravimetric on STA-PT 1600 instrument for clay minerals with relative error ±
5%; other minerals were analysis by X-ray diffraction analysis on D8-Advance Bruker
instrument with in ± 3% relative error.
4. RESULTS AND DISCUSSION
4.1. Distribution of grain
s iz e
in tidal flats
From Mong Cai to Kim Son, sediments on tidal flats were composed of coarse
sand (Md = 0.50-1.00mm), medium sand (Md = 0.25 - 0.50mm), fine sand (Md = 0.10 0.25mm), coarse aleurites (Md = 0.05 - 0.10mm), fine-aleurites muds (Md = 0.01-
PROCEEDINGS
ON MARINE SCIENCExwvutsrqponmlkjihgfedcbaZYXWVUTSRQPONMLKJIH
167
OF VAST - IRD SYMPOSIUM
0.05mm) and alerutic-pelitic muds (Md < 0.05mm). Coarse, medium and fine sands
were only in the north of the study area (MC 1, MC 3) and most of them were medium
and well in sorting. Fine-grain sediments dominated the south of the area and most of
them were poor to medium in sorting.
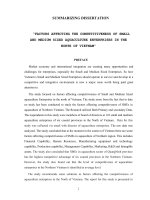
In Fig. 2, the diameters of sediments in the cores changed in depths, reflecting the
change of sedimentary environmental conditions with time. Based on the diameters,
sediments can be divided into two sedimentary processes of erosion and accretion on the
tidal flats. Erosion processes are seen at MC II in depth of 27-50 em. At MC 10 erosion
and accretion were alternative from 22 to 90 cm, at MC 8 in depth of 33 - 40 em, at MC
3 in depth of 20 - 66 em and on MC I at 15 - 90 cm, where the diameters were from
coarse aleurites to coarse sands. Accretion processes are seen in all cores, at MC 11 in
depth of 0-27 cm, at MC 10 from 0-22 em, at MC 8 in depth ofO-27cm, at MC 7, MC 5
and MC 4 in all of dep,th in cores, on MC I and MC 3 in depth of 0-20cm.
Based on mean diameters (Md) of sediments, three areas were divided, including
Deltaic tidal flat sedimentary environment (MC 11, MC 10, MC 9, MC 8, MC 7) with
most sediments of coarse aleurites to fine-aleurites muds; Estuarine tidal flat
sedimentary environment dominated by fine-aleurites muds (MC 4, MC 5); and .
Embayment tidal flat sedimentary environment dominated by fine to coarse sands (MC
1, MC 3).
Table 1. Sediment parameters on the tidal flats
SoNMLKJIHGFEDCBA
M d (mm)
CoresQPONMLKJIHGFEDCBA
SO .
M in .
dcbaZYXWVUTSRQPONMLKJIHGFEDCBA
M ax.
A v e r.
SO .
M in .
M ax.
A v e r.
MC1
0.052
0.725
0.224
0.119
1.297
6.381
2.280
1.497
MC3
0.080
0.181
0.130
0.021
1.531
4.047
1.887
0.654
MC4
0.008
0.057
0.024
0.015
2.284
3.988
3.262
0.380
MC5
0.008
0.034
0.015
0.007
1.601
2.986
2.686
0.324
MC7
0.022
0.063
0.048
0.012
1.740
3.557
2.991
0.408
MC8
0.019
0.116
0.040
0.029
1.803
3.060
2.565
0.255
MC9
0.054
0.102
0.065
0.008
1.255
3.635
2.119
0.810
MC10
0.051
0.084
0.066
0.007
1.233
3.588
2.108
0.848
MC 11
0.037
0.068
0.057
0.008
1.366
2.696
2.151
0.410
Min. = minimum; Max. = maximum; Aver. = average; SD. = Standard deviation
BAo cAo KHOA HOC HOI THAo VAST - IRD V~
168xwvutsrqponmlkjihgfedcbaZYXWVUTSRQPONMLKJIHGFEDCBA
Sediment
QPONMLKJIHGFEDCBA
SJ
pw am e
•••.•
(Md,
KHOA HOC BI~N
J M II'W 'I8 1 e r1 (Md,
Sedment
Sol
...,
Me.
Sediment
paramelera
(Md,
Sediment parameters
so>
{Md.
SJ
__
lAd("",,)
-.-
S.
Sedimentary
MC8
___
parameters
/
(Md,
so>
NMLKJIHGFEDCBA
'\lT i'
' ,
",(mm)
~s.
-.,
,,/
./
Sediment
paramelltf$
(Md,
so>
Sediment
Fig. 2. Distribution
4 .2 . D is tr ib u tio n
O f2 1 O
Pb and
parameter
(Md,
so>
Sediment
parame\efl
(Md.
SJ
of sediment parameters on tidal flatsdcbaZYXWVUTSRQPONML
226 R a
a n d s e d im e n ta tio n
r a te o n tid a l fla ts
The 210Pb and 226Ra in sediments can help us tracking change of environments;
they are indicators for erosion or accretion processes. When the content of 226Ra in
sediment layer is higher than that of 210Pb, there is no deposition of sediment. On the
other hand, if the content of 210Pbin sediment is higher than that of 226Ra, it will show
the deposition of sediment. On the tidal flats of North Vietnam, there are consisted of
two above cases.
In the sediment cores Me 2, Me 4, Me 5, Me 6, Me 7 on the tidal flats, the
content of 210Pbactivity
is higher than that of 226Rain a111ayers, indicating the accretion in
these areas for the whole time (Fig. 3). In the sediment cores Me 3, Me 8, Me 9, Me
10, Me 11 in the tidal flats, there are in these sediment cores two phases, including the
first phase with content of 210Pbactivity
in sediment higher than that of 226Raand the later
second phase with content of 226Rain sediment higher than that of 210Pbactivity
(Fig. 3).
PROCEEDINGS
OF VAST - IRD SYMPOSIUM
.., ..,
J"Pb_
,
'1
.. ,..,
and lltIRa (8qlkg)
.. ..,
11OPb_
,
,
"
""
J
·
I~j ,t
•·
;
,
..
-+-"'"PD_
~~
f
,
toe
"
'~
c:
Me2
.. ,..,
and mRa (SqIIotg)
'"
"
· dcbaZYXWVUTSRQPONMLKJIHGFEDCBA
.rr>
"
169xwvutsrqponmlk
ON MARINE SCIENCE
,,
'"
,,
"I
Me3
1:1NMLKJIHGFEDCBA
f
.'I ••
1:1
-+-
210
...•..
22&Ra
PblldMly
.. ..
J~_.nd~(8q/IIgl
"
I
"
)
'>
"
'"
'"
Me4
_210PII~
..".22eRlt
!"
I
t
•
.. .. .. ~""
210P!:l_
,
:1
:1
/
t
"
and mRa (8q/tg)
'~==
:j
~"
.'I ••
"
"ss
""J
,
:1
"
"1
~-..
.. ,..,
and Z2tRa(Bqlkgl
roc
"
r-
~
,
'"
<
{
K"i "
o as
_"'Pb-,.
.. ..
2· 'Pb....,
..
,
M'-'
X
I
'"
..,
t
MC6
__
:,
"
"
"
'"
'"
Me,
c
..
'>OPb_
~~
..
J"'AI_ and -Ra (8qI\g)
,
---'~~~ ..
~
5 ••
!"
.. '
,
:1
..
",
710
Pb.....,
't'
1i
and mRa (Bqlkg)
"
'",
'I"
..,,
.. ..
:h0P!)_
•.
, ,
" "
,,
and 21IIRa
"
'"
'"
Me.
-v-
:1 j)
'''Re
I"
j"
"
t ••
,,
.. ..
'''Pb_and~'
"
b
"j
"
"
....•... ''''PtJ..-,.
..
,
"
~g)
,.,
".
Me 10
MC9
~
__
210~
I ..
j
- •••-
226R•
!"
P
-""""~ ..•.
l"Pb_ and 22IRa(BqIkg)
o
01
_
_
•••
1
_
_
._
I
I
._
._
._
1
Men
~-..
__
K"
'''Pb_
t"
.'I "
as
,,'
Fig. 3. Distribution of
210Pb
and
226Ra
in sediments on tidal flats
Sedimentation rates on tidal flats were timely changed in different areas. They
were low in Me 3 and Me 10 (Fig. 4), high in Me 2, Me 4, Me 5, Me7, Me 9, Me II
(Table 2 and Fig. 4). On tidal flats, there were not only accretions, but also erosion that
was indicated at Me II, MetO, Me 9, and Me 8. The sedimentation rate is closely
related to the diameter of sediment. The high sedimentation rate, the much more fine
BAo cAo KHOA HOC HOI THAo VAST
170xwvutsrqponmlkjihgfedcbaZYXWVUTSRQPONMLKJIHGFEDCBA
- IRD V~ KHOA HOC BI~N
sediment is. In three sedimentary environments mentioned above, high sedimentation
rate was recorded in estuarine tidal flat sedimentary environment and deltaic tidal flat
sedimentary environment.
Table 2. Sedimentation rates (em/year) on tidal flatsNMLKJIHGFEDCBA
M C2
M C3
M C4
Max.
0.11
1.31
0.04
0.34
0.19
2.35
A v e r.
0 .8 2
0 .1 4
1 .4 0
SD.
0.37
0.11
0.65
Min.
Min.
=
minimum;
M C5
0.13
15.00
2.94
4.01
=
Max.
M C7
M C6
0.26
M C8
0.17
14.42
1.18
M C9
0.07
3.24
MC
MC 11
10
0.06
15.83
0.14
0.09
14.84
0.64
0 .5 0
2 .0 8
0 .7 7
3 .0 4
0 .3 4
1.71
0.31
3.105
0.83
5.27
0.15
4.15
= average;
maximum; Aver.
SD.
= Standard
deviation
In Table 2, at MC 5, MC 7, MC 9 and M C II standard deviation of sedimentation
rates are high, because in these cores sedimentation rates are change very fast and
suddenly (Fig. 4), they show that effect from sedimentary environment, we are also
seeing same trend changes by concentration of metals and clay minerals and quartz in
these sediment cores.
.
Sedimentalioo
rate
.
(anlyear)
Sedimentation
rates
(cmlyear)
""
"'"
"",,,.
...•
""
....
.......
,
....
....
...,
'9111
MC 2
"51
MC3
""
-"""
~
..
'"3
,
"..
:"":::
"""
,, ,
..
..."
....
"..
117.
,...
> .,
1'13
.•.
,
""
,."
.
Sedimentation
...
1911
'1173
,
''''
""
.
rate (cmfyear)
•••~~->--~->---+--->---+-----<
Me5
!!
e " ••
..
19845
1981
"
,...
,
""
1'70
""
""
""
•..
,
1.71
""
""
....
1'15
...
,
1912
'&71
rate
"
= ••••
>
55
""
"
""
..
Sedimentation
(cnVyear)
rate
(cm'yeat)
~H'~~~-~"",;,,-+-~->--~
...,
""
""
MC.
I :~ l
G
""
,"
"
..
..
''''
f g
dcbaZYXWVUTSRQPONMLKJIHGFEDCBA
'.1 0
199&
'995
'970
Sedimenlalion
""
"'":::
...,
,
::
.
""t====~=====:;:;;;-:::
Mea
Me7
·...
>-
..
rate (anlyear)
(emlyear)
..
~r---;=====~======-....
...,
"
Sedimentation
rates
""
"""
MC6
1911
""
Sedimentation
"" r-""t"""->--~--~->---+-----<
19711
1111'
...
,"-...
,.
.
(cm'year)
11191
:
>-
1'71
"",
K'IM
Sedimentation rate
""~~->---+--->---+--~>---+-----<
"'"
..
"",."
.
""
,...
",.. r~:::;~~~=====-""
~ ,,....,,
""""
"
""
,
""
MC.
· .....
rt
i~
!"
.,.
; ..
I "••
~
rate
::~r---j.-+-.....;..-+--+--+-~--<
e ,",
S
Sedimentalion
"" ~~-+--+-+--+--+--+---<
""
""
""
""''''
>-
.
(cmtyear)
,,,,t-"r--->--~->---+---':'-~---<
__
"79
Hil"
1 .7 0
1 !:!
l5
·
~ S"
::
""
""
"
MC10
PROCEEDINGS
OF VAST - IRD SYMPOSIUM
Sedm.ntalion
rate
ON MARINE SCIENCExwvutsrqponmlkjihgfedcbaZYXWVUTSRQPONMLKJIHG
171
(O'I'IIyNr)
Me 11
rates on tidal flatsdcbaZYXWVUTSRQPONMLKJIHGFEDCB
Fig. 4. Sedimentation
4 .3 . D is tr ib u tio n
o f m e ta ls o n tid a l fla ts
Heavy metals in sediment cores were analyzed including Cu, Pb, Zn, As, Ni, Cr.
High concentrations of elements are As, Cu, Pb and Zn in MC 5, MC 6, M NMLKJIHGFEDCBA
C 7 , MC 8
and MC 10. In comparison with MC 1, MC 2 and MC 3 in the north of the study area,
the concentrations of metals in the south of the study area is higher. Metals in sediment
cores increased in recent years, clearly in MC 5, MC 8 and MC 2 (Table 3).
Copper (Cu) in sediments were in the range from low to high concentration, the
highest concentration at MC 5 and MC 6. Most of them are higher than ISQG levels of
Canadian standard. The lower concentration compared with ISQG is in MC 1 MC 2 and
MC 3 (Table 3).
The concentration of lead (Pb) in sediment had a trend similar to the one of Cu. It
was high in sediment cores MC 5, MC 6, MC 7, MC 8 and MC 10, only at MC 1, MC 2
and MC 3 but lower than ISQG level. The highest concentration was at MC 7.
Table 3. Value of metals (mg/kg) in core sediments on tidal flats
M C1
M e ta l
(n =
Cu
M C2
M C3
M C5
8)
(n = 2 0 )
(n = 2 1
)
(n =
24)
M C7
(n =
23)
M C8
M C10
(n = 1 7 )
(n = 4 )
M C
11
(n = 1 8
Min.
2.17
10.06
0.69
47.66
53.25
60.31
19.93
33.68
11.42
7.37
18.84
12.14
70.88
89.01
94.76
85.59
74.55
36.12
A v e r.
5.12
1 4 .8 0
3.85
57.58
8 0 .0 5
72.93
5 6 .0 3
5 0 .4 1
23.72
SO.
1.83
2.20
2.80
8.03
8.46
7.78
21.51
17.54
6.77
)
18.70
Min.
5.78
18.37
5.99
59.61
55.36
70.96
22.32
60.59
12.67
Max.
26.06
31.12
22.99
90.20
82.25
120.32
96.28
103.01
111.63
A v e r.
19.59
23.71
12.69
76.16
72.25
95.02
61.27
79.41
28.61
SO.
6.98
2.93
4.00
6.88
8.72
12.24
22.48
18.76
21.43
Min.
3.95
13.26
19.63
87.46
94.25
72.21
62.19
88.60
26.67
Max.
45.66
492.01
62.64
137.68
132.99
143.68
151.79
152.08
152.16
A v e r.
30.69
81.62
35.89
111.66
123.05
98.89
1 0 6 .2 2
113.80
65.97
SO.
14.39
111.89
11.37
18.26
8.72
17.71
27.20
30.93
29.88
30.20
ISOG
Zn
(n = 1 9 )
Max.
ISOG
Pb
M C6
L e v e ls
BAo cAo KHOA HOC HOI THAo VAST
172xwvutsrqponmlkjihgfedcbaZYXWVUTSRQPONMLKJIHGFEDCBA
- IRO V~ KHOA HOC BIf:N
124.00
ISQG
Min.
0.61
3.15
0.26
23.43
20.24
25.78
7.13
13.27
376
Max.
6.69
9.69
8.41
53.93
42.94
38.62
42.16
30.81
12.09
AsNMLKJIHGFEDCBA
27.53
A v e r.
4.22 dcbaZYXWVUTSRQPONMLKJIHGFEDCBA
6 .1 0
3 2 .8 0
38.29
4 .0 1
26.68
21.66
7.31
11.38
7.96
2.22
2.18
SO.
2.21
2.18
5.27
12.86
Ni
Min.
10.88
9.93
2.60
30.96
23.16
34.66
8.74
34.88
2.05
Max.
23.86
41.44
24.97
44.80
36.83
74.11
63.67
55.97
323.32
A v e r.
16.38
18.12
1 6 .0 9
3 8 .1 0
31.92
44.18
32.41
44.49
45.89
4.18
8.43
6.62
4.34
3.85
9.82
12.01
8.75
83.66
SO.
-
ISQG
Cr
4.00
7.20
ISQG
Min.
5.35
17.07
5.98
34.40
28.71
32.35
12.70
30.67
8.86
Max.
22.17
54.46
17.65
49.80
47.83
53.33
50.83
44.40
22.71
A v e r.
16.44
24.11
11.47
41.98
41.41
4 2 .6 0
33.19
36.55
15.78
ISQG
5.74
8.30
2.75
5.11
4.39
5.00
12.75
5.79
3.53
52.30
TEL
Min. = minimum; Max. = maximum; Aver. = average; SD. = Standard deviation; n= number of sample
Zinc (Zn) has high concentration in sediment
Although average concentration of Zn was lower than
were higher than ISQG level. At some positions on
recently (Me 8, Me 11, Me 3 and Me 2) increased.
Me 1 and Me 3 (Fig. 5, Table 3).
Concentration
of metals
(mgIkg
dry weight)
Concentration
of metals
eo
80
(mgfkg
in Me 5, Me 6 and Me 10.
ISQG level, some layers in cores
the tidal flats, the concentration
The lowest concentration was in
dry weight)
JOe)
of
Concentration
500
~r.~--~7/,'~'--------'
0102030
40
50
60
metals
7011090
(mglkg dry
weigl!)
100110120130140150160
o~~~~~~~~~~~
MC3
"
MC1
~""
...••.•
Pb
MC2
..• -. In
Concentration
of metals
(mglkg city
weight)
Concenltalion
of metals
(mglkg
dry weighl)
Concentration
of metals
(mglkg
dry weight)
PROCEEDINGS
Concentration
o
~u
~c"
•.•..
Concentration
dry weight)
(mglkg
o I
40
of metals
60
"
'"
.:::.:
20
•..........•........
Concentration
'''''
.....
1
-"
I~
,_
"',
•••••
. e-
"w
dl)' weignt)
•
<,
Me11
,.~~,(
K"
(m~g
o 10M..
"'--"
,+
//
Pb
Zn
", ..
L
dcbaZYXWVUTSRQPONMLKJIHGFEDCBA
Fig. 5. Distribution
of metals
1~
.•
~c..
rJ
c-,
120
.,>
,.
•...
':;::::~;:a
dry weight)
100
....tn. ...'!
,':0
Zn
(mglkg
80
=-L..
~~~.~'.
Pb
.--
K
of metals
20
~
173
ON MARINE SCIENCE
xwvutsrqponmlkjihgfedcbaZYXWVUTSRQPONMLKJIHGFEDCBA
o
~
_
~
~
,~
o
NMLKJIHGFEDCBA
vv:==::; m:: '.~~:~:~_~~~'.
'1-
Mca
01
1
OF VAST - IRD SYMPOSIUM
~
.0
£
~
so
o
/
..,/
W'
Me 10
.
~""
~• "'0
of Cu, Pb and Zn in sediments
on tidal flats
Arsenic (As) in sediments was quite high in concentration, up to five times higher
ISQL levels. Arsenic at Me 1, Me 2 and Me 3 had concentrations lower than ISQG
levels.
Concentration
of metals
(mQlkg
Concentration
dry weigh!)
of metals
(mglkg
dry weight)
Concentration
of metals
(mg.l\.g
dry weight)
..•.......-- ...--\-~::::.::::~-::::::=-.,.
.~.!'
•.. _
~.=:;::.~-.
-''P-~
MC1
~"
__
K"
e-:"
Hi
K
~
~'"
£
__
£
~"
Pi
,,-.--' .-
\
•
"
.•.
,
..
~
,
_ ••••
MC2
~,.
N,
•
MC3
..·•. ··N'
•
C,
C,
...
! .
,J
o
•
!
Concentration
o
H'
01
I
~u
off metals
(mglkg
~u
""
~u
MC5
o
''''
10
N!
of metats
~
••
(mglkg
•
.•••••
dry weight)
~
Concenlration
~
_
o
I
B
01
IV
LV
I
.
K
;;"
~JB
Concentration
10
20
K
1
g ...
C,
UU
Iv
DO.
~,.
·-•.··N'
'"
.,)'!, .
'<;.,"'".
~ ,"
K"
~"
i
0"
..••...
(mglkg
.0
so
::=;l;:w:
.....
)e
Concentration
dry weight)
60
o
._
I
o
50
100
of metals
1~
(mglkg
200
Concentration
dry weight)
250
300
o
."
lV
~
of metals
.JU
4V
(mg/kg
~
dry we.ght)
O\J
ru
II
Or'---+-.r+--~,.-hr-~--~--+-~
Iwq
Me 10
'---
'.
H;
dry weight)
MC 7
•...
!
,.'.
Mca
__
~A.
01 metals
30
""
-::;:-.-
NI
? ~)
o
I
(mg/IIg
~V
Wi
MC6
~,.
'"
.
-
o
of metals
.••••
•
•..~~;;~---==-~=:!:~.
--~
• -- 0
~
o I
•..: I e
~,"~,,""
•.•.•
Concentration
dry weight)
IJI'
: J iiU
..~
MC
~"
~.
-=--==::=:--.-
~A.
1'~ ..
· .• · · Cr
~N'
~C,
1..
0
'I."
20
.
... ;.-....
)i
-
~"
,
~----..•....----.-
~~~
__ -:':=;"~
~
"
--._.,.
Fig. 6. Distribution
of As, Ni and Cr in sediments
on tidal flats
/
174xwvutsrqponmlkjihgfedcbaZYXWVUTSRQPONMLKJIHGFEDCBA
BAo cAo KHOA HOC HOI THAo VAST
- IRD V~ KHOA HOC BI~N
Niken (Ni) in sediment got its high concentration at MC 7, MCI 0 and MC 11, but
low concentration at MC I, MC 2 and MC 3. The increasing in concentration ofNi was
shown at MC I, MC 2, MC 3 and MC 8 (Fig. 6).
Chromium (Cr) in sediment on all tidal flats had its concentration lower than
ISQG level, changing in a sediment core but not clear among the cores. The highest
concentration of Cr was recorded at MC 5, MC 6 and MC 7.
Along tidal flats of the North Vietnam, heavy metals are high concentration of Cu,
Pb, As and Zn, most of them is higher than ISQG levels. High concentrations of metals
are focus on Hai Phong to Ninh Binh coastal area, where mean diameters of sediment
are smaller and clay minerals content are higher than Cua Luc to Mong Cai.dcbaZYXWVUTSRQPO
4 .4 . D is tr ib u tio n
o f m in e r a ls
o n tid a l fla ts
Minerals in sediments on tidal flats are monmoriolite, kaolinite, illite, chlorite,
fenspate, quartz and goethite. Clay minerals which are common in sediment cores are
kaolinite, illite; monmoriolite and chlorite had low concentrations (Fig.7). Quartz was
high in concentration in all the cores while other minerals (fenspate and goethite) were
low in concentration in tidal sediment (Fig. 8).
Monmoliolite was not common in tidal sediments of North Vietnam, its
concentration was highest in MC 5 and MC 6. There was no change or less than limit
detection of equipment at MC 2, MC 3.
Table 4. Value of minerals (%) in core sediments on tidal flatsNMLKJIHGFEDCBA
M C2
M in e r a l
(n =
~
M C3
M C5
M C6
M C7
20)
(n = 2 1
)
(n = 1 6
)
(n =
14)
(n = 2 3 )
Min.
3.00
3.00
3.00
3.00
3.00
"§
Max.
3.00
3.00
E
A v e r.
3 .0 0
3 .0 0
6.00
4.44
0.00
11.00
18.00
15.45
4.00
15.00
7.67
1.26
14.00
23.00
19.13
6.00
4.43
1.40
15.00
23.00
19.79
5.00
3.22
0.60
8.00
16.00
12.26
Max.
1.70
10.00
19.00
3.06
7.00
19.00
3.12
21.00
27.00
2.58
16.00
29.00
A v e r.
0
c:
~
2
SO.
Min.
:S
Max.
0
co
::.:::
A v e r.
2
·c
0
z
(J
OJ
roa.
'"
c
OJ
u.
~
~
M C
11
0.00
(n =
16)
3.00
4.00
3.19
0.40
7.00
13.00
(n = 2 0 )
3.00
5.00
3.45
0.61
6.00
14.00
1 0 .3 1
9 .1 0
1.89
17.00
29.00
2.15
15.00
25.00
23.56
1 9 .7 0
3.60
3.10
1 5 .9 0
12.76
2 4 .0 0
2 4 .0 0
2.20
19.00
27.00
22.65
SO.
1.77
3.94
2.16
3.11
2.55
Min.
5.00
8.00
11.00
6.00
10.00
7.00
6.00
6.00
3.00
7.00
5.00
Max.
A v e r.
5 .2 0
4.68
8.94
8.43
7.00
6.65
10.00
8.13
9.00
6.95
SO.
0.41
1.65
1.00
1.59
0.57
1.09
Min.
3.00
3.00
5.00
4.00
4.00
5.00
0.83
4.00
Max.
5.00
6.00
15.00
13.00
14.00
4 .4 0
4.00
3.14
7.00
A v e r.
5.88
SO.
1.42
6.69
2.70
2.82
39.00
63.00
0.96
20.00
39.00
6.74
2.77
Min.
0.81
48.00
5.29
0.73
22.00
47.00
31.00
47.00
32.00
SO.
Min.
~
M C8
L e v e ls
Max.
83.00
52.00
7 .2 0
38.00
59.50
PROCEEDINGS
SD.
46.15
4.92
Min.
6.00
Max.
8 .0 0
A v e r.
7.35
0.75
A v e r.
2
:.c
Q3
0
(9
ON MARINE SCIENCExwvutsrqponmlkjihgfedcbaZYXWVUTSRQPONMLKJIH
175NMLKJIHGF
OF VAST - IRD SYMPOSIUM
SD.
64.76
8.89
3.00
27.56
4.07
6.00
4.33
1.56
9.00
6.56
1.26
29.43 dcbaZYXWVUTSRQPONMLKJIHGFEDCBA
3 9 .3 0
39.31
4 6 .3 0
5.96
5.00
8.00
6.57
0.76
5.00
4.58
4.00
7.00
5.65
0.83
6.11
4.00
7.00
4.79
3.00
7.00
5.88
0.89
5 .1 0
0.79
Min. = minimum; Max. = maximum; Aver. = average; SD. = Standard deviation; n= number of sample
Kaolinite had a high concentration after those of illite and quartz. The highest
content was at Me 2, Me 5 and Me 6; the lowest content was at Me 3 and Me 11.
Taking kaolinite as an indicator for accretion, it shows accretion in all depth of the cores
Me 2, Me 5, Me 6 and Me 7.
Illite had the highest concentration in clay minerals of tidal sediments and been
observed of changing as of kaolinite. It is a good indicator for understanding
environmental conditions; at position of cores have high sedimentation rate which are
positive linear with content of illite.
Content
o
i ••
:
i
l
~
sr
~_o
i
f~ ;,
::a
,
)
ov'"
•.•.~
25
f
)
..
Hlil.
C\of~.
,"
s
ro
I
~"1
5 "
'.
9
/'
~.W
~"
KaoIln~e
a Illite
~<>-- Clorlt8
o
. •..
)
Q
•
of minerals
of minerals
I
~.,.
'
I
, ...
..
~.
~ .
-.
,.
eo
B
(%)
Conlent
25
I
'.
~
,
_.~.;:.o
•
Q
Q
..•.
'.
,
01 minerals
Me7
__
.,.
••
.oo
l
~ zc
5
!
...• -.
~~.'
-;:::=-.
~,Y)
Monmoriol~.
•
iii.
· · <>· · · CIort.
(%)
o
o
~" ~
.
·:i
0'
as
"
·
. ··. .
,.
b
..
lUte
CIof.,'4;<
"
"
e-;
0
0
I
• .•
-:-:~."'
~
0"
••••
p
~
II
••
Conloot
o
°1
.
."
•.
~.
/
~
MonrnonoI~e
.-
Q~t
.. " ....•• a
1.
ro1
..
"'~
c
"
(%)
.;~Iwn
.",
9 ~
I 9~"::····..,:
I, • " :::
!", I
'
.P-'"· 'I
.)
I
" , 't . " . '
A
~ ~ ·.~ i
-+-
o
•
Content
0
K.omH
'.
I>
'I
.i
,,:, ......•
,.
.
i ~ ..
•..
r:'::~:f;
.: '," .: : : .: : -
+
•
(%)
,.9'
_ _ MorImoIioI~.
.••
I
I
•
40
'1.
'I ..
q;
~
1
I
MC6
,·-1
. ..:~ •
D'
3D
~_
:
.>
%'"
~
of minerals
e,
~)
. i
~ ..~.~Q' .."
~
o
••
: r
I
0 : ·~ : b
0:::.
I t:
•
.w
(I~'.
I
r-.·.·.·~...
_~~D
Content
o
t
I
v.
;
,
I
.A r
Monmoloit.
Kaolin~ãã
!lit.
CIor~.
Conlent 01 minerals
(%)
o
Me2
ã.ã.ã
'1
I:t
.- ..
,.
,
01
15
,
ã~ -.ã
i
Vi
o
"
,
,
_1_
s-,
'>
,.
f
..
Content 01 minerals
(%)
~v
0,,,0.._
.."
j
1"
of minerals
.~
Mea'
.-"
ô
f .i.
"
,
-<>-
CIort.
0
~
.0
f)
.
~.:.
0
(%)
~_
,I (' .~"
I;c-""-
~'"
~~~~~:~
L
o~.,
t,·",,'v
).,
tv
~:
_ ..
MC11
__
MonmorioIt.
.••... KeoIini\e
...•..
CIoriI.
Fig. 7. Distribution of monmoriolite, kaolinite, illite and chlorite in sediments on tidal flats
176
BAo cAo KHOA HOC HOI THAo VAST - IRD V~ KHOA HOC BIt:N
Chlorite concentration was only higher than that of monmoriolite in clay minerals.
The concentration was higher at MC 5, MC 6 and lower in other cores. Comparison with
other clay minerals in tidal sediments, the concentration of chlorite was changed in
depths but not so clear.
Fenspate in sediments was high in concentration at MC 8 and MC 11 at depth
from 30cm to the end of cores. The lowest concentration of fenspate was at MC 2 and
MC 3, but not clearly changing in the cores.
NMLKJIHGFEDCBA
..~': "" .,:.--" " "
Cootentofminefilis
(%l
,
0
0
'''.
(
1"
'"
of minerals
Content
(%)
of minerals
("!o )
",
-,~J
MC>
",J
K
Content
eo
.
•
MC5
__
- •••.. Quatlz
-a··
Go.Ih~
\
1<::,~
/
K"
xwvutsrqponmlkjihgfedcbaZYXWVUTSRQPONMLKJ
F.n-,,"
Fenspat&
...~ .. Qu~
e-. Goe4i>M
L
-+..•..
•
QUlII1z
Go.IhiI •
~
Conlenlofminerals(%)
o
10~
~
~
~
ro ~
~
0r---~---"~'~'~'~~~
···•
•·.
·.:
·
"
~
"
~
.f
MC6
.
-.•...F,,"-, •
-.-
""""
Goelh.
~
o
o
-"
~
""
!"
l
ConlentofmineraJs
dcbaZYXWVUTSRQPONMLKJIHGFEDCBA
("to )
Fig. 8. Distribution of fenspate, quartz and goethite in sediments on tidal flats
Quartz in tidal sediments was quite high in concentration at all cores. In Table 4
standard deviation of mineral is high with quartz, this mineral are most abundant in tidal
sediment, if concentration of quartz changes that mean sedimentary environment are
changed, these event are shown in MC 3 (at 20-70 em in depth), MC 6 (at 30 - 40cm in
depth), MC 8 (27-40 em in depth) and MC 11 (27-50 em in depth) (fig. 8).
Goethite had the highest concentration at MC 2, followed by those at MC 5, MC
6. In the other cores, the change in concentration was not so high. As the results, it is
difficult to indicate for dynamic conditions, but it may be an indicator for physical chemical of sediment.
PROCEEDINGS
ON MARINE SCIENCExwvutsrqponmlkjihgfedcbaZYXWVUTSRQPONMLKJI
177
OF VAST - IRD SYMPOSIUM
Generally, in three environments mentioned above, common clay minerals in
sediment cores are kaolinite and illite. The highest content in these clay minerals are in
the order: MC 5 > MC 6 > MC 7 > MC 8 > MC 11 > MC 2. Quartz was concentrated at
MC 3. Taking the concentrations of clay minerals and quartz as indicators for
sedimentary processes, the accretion takes place where high clay minerals are
concentrated and the erosion with low sedimentation rates is at the areas with high
quartz concentration.
Finally connection all data in sediment cores shows that used 210Pb and 226Ra in
monitoring sedimentation
rates only true for the accretion environment,
but
environmental erosion did not specify the exact age. This problem is seeing in sediment
cores at MC 3, MC 8, MC 9, and MC 11, other sediment parameters are complementary
to each other reflect sedimentary processes at tidal flats. As difference of21°Pb and 226Ra
at layers are causes of during time, mean diameters, clay minerals and condition
environment. All of them show clearly two sedimentary processes which are erosion and
accretion in the North of Vietnam.
5. CONCLUSION
Based on study results on the sedimentary characteristics
of grain size,
sedimentation rate, metals and minerals, three sedimentary environments are classified,
including deltaic tidal flat sedimentary environment from Kim Son to southwest Do Son
Peninsula, estuarine tidal flat sedimentary environment from northeast Do Don
Peninsula to southwest Cat Ba Island and embayment tidal flat sedimentary environment
from Cat Ba to Mong Cai.
In deltaic tidal flat sedimentary environment, two sedimentary processes of
accretion that is dominant and erosion that appears at 30cm in depth of MC 8, MC 9,
MC 10 and MC 11 are with common fine sediments and high sedimentation rate,
accumulation of metals in sediment, high clay minerals concentration. Estuarine tidal
flat sedimentary environment is characterised by accretion process, dominating fine
sediment, high sedimentation rate, highest accumulation of metals and high clay
minerals. Embayment tidal flat sedimentary environment is with low sedimentation rate,
common coarse sediments, low accumulation of metals and high quartz.
The study results from a large area with 11 sediment cores are initial information
on sedimentary environments. For future understanding the sedimentary processes in the
region, more studies and detail research plans should be developed and carried out.
These studies will contribute to use and manage tidal flats, function and fate of them in
local environmental conditions.dcbaZYXWVUTSRQPONMLKJIHGFEDCBA
A c k n o w le d g m e n t:
S c ie n c e
p o llu ta n ts
and
in
T e c h n o lo g y
tid a l
V A S T C T G .0 1 l1 2 -1 3
F u n d s J o r th is w o r k w e r e p r o v id e d
(V A S T )
s e d im e n ta r y
in
tw o
p r o je c ts :
e n v ir o n m e n t
o j th e
a n d " S tu d y , a s s e s s a c c r e tio n
a r e a o j th e R e d R iv e r D e lta " d u r in g 2 0 1 0 -2 0 1 1 .
by
V ie tn a m
"A ssessm ent
N o r th
A cadem y
a c c u m u la tio n
oj
oj
oj
V ie tn a m "
w ith
a n d e x p a n s io n
o J m u d fla t
o n c o a s ta l
W e a r e in d e b te d
code
w ith c o lle a g u e s J r o m
178
BAo cAo
th e In s titu te
o f M a r in e
E n v ir o n m e n t
KHOA HOC HOI THAo
a n d R e s o u r c e s fo r
VAST - IRD V~ KHOA HOC BI~NdcbaZYX
th e ir h e lp in s a m p le c o lle c tio n ,
s u b s a m p lin g a n d h a n d lin g .
6. REFERENCES
1.
Anh N. T. T, Giang N. K (2006). Status metal pollutant of tidal sediment of Tien Yen - Ha Coi area, Quang Ninh
O.
Provine. Journal of Geology, Serial A, Vol. 293, p.1-1xwvutsrqponmlkjihgfedcbaZYXWVUTSRQPONMLKJIHGFED
2.
Anh N. T. T, Giang N. K, An P. V (2005). Environmetal geochemistry of sediments in estuary and tidal flat: A case
study in Ha Long City, Quang Ninh province. Journal of Geology, Serial B, Vol. 26, p. 55-64.
3.
A~pleby P. G, Oldfield F (1978). The caculation
21 Pb to sediment. Catena 5, p, 1-8.
4.
Appleby P. G, Oldfield F (1992). Applications of 210Pb to sedimentation
(Eds.), Uranium Series Disequilibrium Application to the Earth. Clarendon
5.
Canadian Council of Ministers of the Environment,
6.
Cu N. D (1991). Some characteristic
geochemical sediments in Mangrove forest of coastal area in the North
Vietnam. Marine Environment and Resources, Vol. 1, p. 54-59. Science and Technics Publishing House, Ha Noi.
7.
Cu N. H, Tuan N. V, Thanh T. D, Tuan N. Q, Nhon D. H (2003). Geological structure and evolution of the Nghia
Hung tidal flat area. Marine Environment and Resources, Tome X, p. 54 - 66. Science and Technology Publishing
House, Hanoi.
8.
Hai P. S, et al (1999). Determination of Pb-210 in sediment and it's application
Journal Analysis chemistry, physic and biology. Vol 4, issue 4, pp. 40-42.
9.
Hoai V. T. T, Huyen N. X (2010). Composition characteristics of modern alluvial estuaries from Ba Lat to Day river
mouths. Journal of Marine Science and Technology, Vol. 10, Issue 3, p. 53-67. Publishing House for Science and
Technology, Hanoi.
10.
Krishnaswami S, Lal D, Martin J. M, Meybeck
Science Letter Vol. 11, p. 407-414.
11.
Lan T. D, Thanh T. D (1991). Morphology, sediment distribution and accumulative process of tidal flood plain of
coastal Kim Son area. Marine Environment and Resources. Vol. 1, p.33-39. Science and Technics Publising
House, Ha Noi.
of
210 Pb
dates assuming
1999. Canadian
M (1971).
rate of supply of unsupported
studies. In: Ivanovich M., Harmon
Press, Oxford, pp. 731-778.
environmental
Geochronology
quality guidelines,
for estimation
update 2002.
of dating sediments.
of lake sediments.
Earth and Planet
12.
Last W. M, Smol J. P (2001). Tracking
Lisitzin A. P (1986).
N.33, Paris.
14.
Nhan N. D, Am N. M, Hoi N. C, Dieu L. V, Cavanho F. P, Villeneuve J. P, Catini C (1998). Organochlorine
pesticides and PCBs in the Red River Delta, North Vietnam. Marine Pollution Bulletin Vol. 36, p. 742-749.
15.
Nhon D. H, Chien H. T, Anh N. T. K, Vuong B. V, Anh N. N, An P. H, Hung V. M, Hai P. S (2011). Sedimentation in
the Bang La and Ngoc Hai intertidal zone, Hai Phong. Joumal of Marine Science and Technology, Vol. 11, Issue
1, p. 1-13. Publishing House for Science and Technology, Hanoi
16.
Nhon D. H, Tuan N. Q, Thanh T. D, Cu N. D, Cu N. H, Toan N. D (2012). Distribution sediments and heavy
minerals in Hai Hau coastal area, Nam Dinh Province. Joumal of Sciences and Technology, Vol. 50, Issue 3 E, p.
1139-1150. Publishing House for Science and Technology, Hanoi.
17.
Robbins J. A (1978). Geochemiscal
and geophysical applications of radioactive lead. In: Nkagru
Biogeochemistry of Lead in the Environment. Elsevier, The Netherlands, pp. 285-393.
18.
Thanh T. D (1999). Holocene stratigraphy and structure of tidal flats Hai Phong coastal area. Journal of the Earth
Science, Vol. 3, p. 197-206. Science and Techniques Publishing House, Ha Noi.
19.
Tue N. T, Quy T. D, Amano A, Hamaoka H, Tanabe S, Nhuan M. T, Omori K (2011). Historical profiles of trace
element concentrations
in mangrove sediment from Ba Lat Estuary, Red River, Vietnam. Water Air Soil Pollut.
Volume 223, 1315-1330.
20.
Perillo G, Wolanski
Elsevier.
21.
Van den Bergh G. D, Boer W, Schaapveld M. A. S, Duc D. M, Van Weering T. C. E (2007). Recent sedimentation
and sediment accumulation
rates of the Ba Lat prodelta (Red River, Vietnam). Journal of Asian Earth Sciences
Vol. 29, p. 545-557.
E, Cahoon
of geological
Change Using Lake Sediments.
R.S.
13.
Principles
Environmental
a constant
mapping
of marine
sediments.
D, Brinson M (Eds.) (2009). Coastal Wetlands:
Unesco
Vol. 1 - 4. Springer.
Reports
An Integrated
in Marine Science
J. (Ed.), The
Ecosystem
Approach.