Ha minh hoa 2018 improvement of the accu
Bạn đang xem bản rút gọn của tài liệu. Xem và tải ngay bản đầy đủ của tài liệu tại đây (197.97 KB, 8 trang )
Vietnam Journal of Earth Sciences, 40(1), 39-46, Doi: 10.15625/0866-7187/40/1/10914
Vietnam Academy of Science and Technology
(VAST)
Vietnam Journal of Earth Sciences
/>
Improvement of the accuracy of the quasigeoid model
VIGAC2017
Ha Minh Hoa
Vietnam Institute of Geodesy and Cartography (VIGAC)
Received 14 June 2017; Received in revised form 25 October 2017; Accepted 10 November 2017
ABSTRACT
As mentioned in (Ha Minh Hoa, 2017), a national spatial reference system will be constructed based on a highly
accurate national quasigeoid model with accuracy more than 4 cm. In Vietnam at the present stage there isn’t a
detailed gravimetric measurement in mountainous regions and marine area. So with the purpose of improvement of
accuracy of the national quasigeoid model VIGAC2017, we only can solve the task of fitting this model to national
quasigeoid heights obtained from heights GPS/first, second orders levelling quasigeoid heights through least squares
collocation.
This scientific article will introduce a first research result for improvement of accuracy of the quasigeoid model
VIGAC2017 on the base of it’s fitting to 194 national quasigeoid heights by the least squares collocation. Research
results show that accuracy of the quasigeoid model VIGAC2017 will be obtained at level of ±0,058 m and increased
to 20,69 %.
Keywords: National spatial reference system; national quasigeoid height; least squares collocation; covariance
matrix; semivariogram; semivariance function.
©2017 Vietnam Academy of Science and Technology
1. Introduction1
A wide application of GNSS technology
with GNSS data processing in ITRF and a
combined usage of detailed gravimetric data
and more accurate with every passing day
Earth Gravity Model (EGM) for the
construction of a highly accurate national
quasigeoid model naturely lead to a bulding
of a national spatial reference system. Ha
Minh Hoa, 2017 had found that the most
impotant base for the bulding of the national
*
Corresponding author, Email: minhhoavigac@gmail,com
spatial reference system is the national
quasigeoid model with accuracy more than
±4 cm, which is the guarantee that the national
geodetic height of every point on the national
territory is equal to the sum of the it’s national
normal height and national quasigeoid height.
At present, many countries had constructed
the highly accurate national quasigeoid/geoid
models, for example, OSGM2002 (United
Kingdom) with accuracy at level ± 3,2 cm
(Iliffe J.C., Ziebart M,, Cross P.A., Forsberg
R., Strykowski G., Tscherning C.C., 2003),
USGG2009 (United States) with accuracy at
level ± (3-4) cm (Roman D. R., Y.M. Wang,
J. Saleh, X. Li, 2010), CGG2013 (Canada)
39
Ha Minh Hoa/Vietnam Journal of Earth Sciences 40 (2018)
with accuracy more ±3 cm on the 80%
continent part (Huang J., Véronneau M.,
2013), GCG16 (Germany) with accuracy
more ±1 cm (Alps max 2cm, marine area 2-6
cm) (Quasigeoid of the Federal Republic of
Germany GCG2016).
The fit of gravimetric geoid/quasigeoid
model to GPS/levelling geoid/quasigeoid
heights through the least squares collocation
had been accomplished in many countries. For
example, the geoid model OSGM2002 had
been fitted to the 179 GPS/levelling geoid
heights cm (Iliffe J.C., Ziebart M., Cross
P.A., Forsberg R., Strykowski G., Tscherning
C.C., 2003). In (Metin Soycan, 2014) had
been presented results of fitting EGM2008
derived geoid heights to the 87 GPS/leveling
geoid heights in Turkey.
(Ha Minh Hoa, 2017) has presented
results of construction of the initial national
spatial referense system on base of orientation
of the WGS84 ellipsoid to best fit it to the
Hon Dau local quasigeoid at tide gauge Hon
Dau with using the most stable 164 co located GPS observations first and second
orders bench marks. When the national
quasigeoid heights have been calculated
from the GPS/first and second orders levelling
quasigeoid heights GPS / leveling by formula:
GPS / leveling
dX 0
A. dY0 ,
dZ
0
(1)
while national quasigeoid heights from the
inital national quasigeoid model VIGAC2017
have been determined by following formula:
*
dX 0
* * A. dY0 ,
dZ
0
(2)
where the GPS/first and second orders
levelling quasigeoid height GPS / leveling has
been calculated by formula:
GPS / leveling H z H z ,
H z - geodetic height of the first (or
second) order bench mark obtained from the
GPS data processing in ITRF and converted to
the zero - tide system; H z - first (or second)
order national normal height converted to the
zero - tide system; * - mixed quasigeoid
height of point got from the mixed quasigeoid
model VIGAC2014 and converted to the zero
- tide system; matrix
A (cos B cos L
cos B sin L
sin B ),
B, L - geodetic latitude and longitude of
point according to the WGS84 ellipsoid;
coordinate transformation parameters from
ITRF to the VN2000-3D:
dX 0 204,511083 m, dY0 42,192468 m, dZ0 111,417880 m.
In (Ha Minh Hoa, 2017) with purpose of
comparision of an accuracy of series of the
national quasigeoid heights (1) with an
accuracy of according series of the quasigeoid
heights (2) on the 164 GPS/first order
levelling points, the both those series of the
quasigeoid heights had been considered to be
*
the equal accuracy at level of 0,062 m.
However, in practice the both above
mentioned series of the quasigeoid heights
40
don’t have the same accuracy. In (Ha Minh
Hoa, 2017) RMS of the differencies
Z * is equal to:
Zi2
164
mZ
m m2*
1,265
0,088 m.
164
164
Meanwhile in (Ha Minh Hoa et al., 2016)
based on co - located GPS observations first
order bench marks and global quassigeoid
heights from the EGM2008 model on those
2
i 1
Vietnam Journal of Earth Sciences, 40(1), 39-46
bench marks. RMS of series of the quasigeoid
heights
*
m
*
had been established at level of
0,070 m.
When
contribution
portion of RMS m of series of the 164
national quasigeoid heights to the RMS
value
mZ 0,088 m
0,053 m.
is
equal
to
As such for following usage in this article,
we accept that the RMS of the national
quasigeoid height calculated by formula
(1) from the corresponding GPS/first (or
second) order levelling quasigeoid height
GPS / leveling on the stable first (or second)
order bench mark is equal to 0,053 m,
while the RMS of the national quasigeoid
from the quasigeoid model
height
VIGAC2017 calculated by formula (2) is
equal to:
*
*
m
0,070 m.
(3)
With the purpose of improvement of
accuracy
of
the
quasigeoid
model
VIGAC2017 this scientific article will
introduce results of fitting this model to the
194 GPS/first, second orders levelling
quasigeoid heights by the least squares
collocation.
2. Data
Apart from the 164 GPS/first, second
orders leveling quasigeoid heights used in
(Ha Minh Hoa, 2017), for solving
abovementioned task had been added 30
GPS/first order levelling quasigeoid heights in
the zero - tide system on the stable first order
bench marks obtained by Vietnam Institute of
Geodesy and Cartography (VIGAC) in period
2012 - 2013 (Ha Minh Hoa, et al., 2012; Ha
Minh Hoa, Nguyen Ba Thuy, Phan Trong
Trinh, et al, 2016), Stability of the first order
benchmarks had been controled by Smirnov’s
criteria (Smirnov N.V., Belugin D.A., 1969),
The abovementioned 30 GPS/first order
levelling quasigeoid heights had been
converted to the national WGS84 reference
ellipsoid by formula (1). On the 30 first order
bench marks had been determined quasigeoid
heights according to the quasigeoid model
VIGAC2017 by formula (2). The total 194
first and second orders bench marks have
been distributed relatively regularly on whole
territory of Vietnam.
*
3. Applied methods
We symbolize Q as a set of n GPS/first and
second orders leveling bench marks (in our
case n = 194), P as a set of points whose
quasigeoid heights will be determined by the
least squares collocation. In the set Q
had been calculated the differencies
Zi i i* , i 1,2,..,194, where for point i
the national quasigeoid height i had been
determined by formula (1), while the
quasigeoid height i from the quasigeoid
model VIGAC2017 had been determined by
formula (2). In addition the accuracy of the
national quasigeoid height i is considered
*
equal to 0,053 m. On base of the least
squares collocation, at a point p P, a
p* will be
~
national quasigeoid height
determined by formula:
p* *p *p ,
~
where quasigeoid height
*p
(4)
from the
quasigeoid model VIGAC2017 is calculated
by formula (2), correction *p is determined
by formula (Moritz, H,, 1980):
*p C pQ .K Z1.Z ,
(5)
C PQ (C p1 C p 2 C pn ) is the cross -
covariance matrix between the differences
41
Ha Minh Hoa/Vietnam Journal of Earth Sciences 40 (2018)
Z i i i* (i 1,2,..,194), in the set Q
and the estimated quasigeoid height at the
point p P, Z is column - vector containing
the differences Z i i i* (i 1,2,..,194),
covariance matrix has form:
(6)
K Z C Z C ZZ ,
C Z is the auto - covariance matrix of
vector Z, C ZZ is the covariance matrix, which
reflects the spatial dependencies of the all
(h)
1 h
.Z (xi ) Z (xi h)2 ,
2nh i 1
n
where Z ( xi ) is the difference Z * of
the point at position xi , Z ( xi h) is the
difference Z * of the point at position
xi h separated from position xi by a
distance not more than lag distance h; nh is
the number of pairs Z ( xi ).
differences Z i i i* (i 1,2,..,194) in the
set Q.
For
the
194
differences
By such way in the set Q we must create
groups of points, in addition in every group
the distances between points not more than
lag distance h. Based on an experimatal
semivariogram we will determine form of
theoretical semivariance, which in general
case has following form:
d
(10)
(d ) C0 C1. f ,
a
where C0 is the nugget effect; C1 is the
structural variance; a is the range of spatial
dependence; function f d will be selected
where Enxn - unit matrix of order 194.
The covariance matrix C ZZ , which
reflects the spatial dependencies of the all
in relation to distribution of the
semivariogram corresponding to standaed
models of semivariance functions (Gaussian,
spherical, exponential, linear models).
Value C0 C1 is the sill and determined
from the semivariogram.
Z i i i* (i 1,2,..,194), their RMS is
equal to:
1,580915
mZ
0,0081490,090m. (7)
194
When the auto - covariance matrix C Z has
the form:
CZ mZ2 .Enxn 0,008149.Enxn m2 , (8)
differences Z i i i* (i 1,2,..,194) in
the set Q, will be determined based on a
covariance function
C(d) mZ2
(d),
(9)
where (d ) is a semivariance; d is a distance
between any two points in the set Q.
As such in our case the spatial dependence
of quassigeoid heights in the set Q will
be studied using semivariogram, The
experimental semivariance (h ) at lag
distance h is calculated by formula (Cressie
N.A.C., 1993; Schabenger O., Gotway C.A.,
2005;
Marcin Ligas, Marek Kulczycki,
2014):
42
a
4. Results
From the 194 most stable co - located GPS
observations first and second orders bench
marks covering the whole territory of Vietnam
had been constructed the set Q, which
contains the 194 differences Z *. In
the set Q had been created 58 groups of
points with change of the distances
from 25 km to 1475 km. The lag distance
h = 25 km.
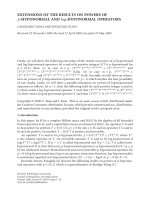
For the semivariogram of the experimatal
semivariances, shown in Figure 1, the sill
Vietnam Journal of Earth Sciences, 40(1), 39-46
C0 C1 0,007928 m2 , the range of spatial
dependence a 1475 km. Next analysis
results
show
that
the
nugget
effect
C0 0,002706 m2 , the structural variance
C1 0,005222 m 2 .
From the semivariogram of the experimatal
semivariances we realize that distribution of
the experimatal semivariances corresponds
to spherical model. So the theoretical
semivariance (10) has form:
3.d 1 d 3
. m 2 .
(d ) 0,002706 0,005222.
2.a 2 a
(11)
On account of the formulas (7), (11), the covariance function (8) gets form:
3.d 1 d 3
C ( d ) 0,005443 0,005222 .
. m 2 .
2.a 2 a
(12)
Figure 1. The semivariogram of the experimatal semivariances
After determination of the covariance
matrix C ZZ baded on the the covariance
function (12), on account of the auto covariance matrix C Z (8), we had calculated
the covariance matrix K Z (6),
The correction *p to the quasigeoid height
*p
of any point p P was calculated by
formula (5) and the corrected quasigeoid height
p* of this point was determined by formula (4).
~
With purpose of accuracy estimation of the 194
corrected
quasigeoid
heights
* of
~
the
quasigeoid model VIGAC2017 at the 194
first and second orders bench marks,
we
had
calculated
194
differences
~*
Z i i i (i 1,2,...,194 ), where i is the
national quasigeoid height of bench mark i
calculated by formula (1) (see Table 1).
43
Vietnam Journal of Earth Sciences, 40(1), 39-46
Table 1, The differences
No
Points
1
2
3
4
5
6
7
8
9
10
11
12
13
14
15
16
17
18
19
20
21
22
23
24
25
26
27
28
29
30
31
32
33
34
35
36
37
38
39
40
41
42
43
44
45
46
47
48
49
50
51
52
IBH-LS97
IBH-TH122A
IBH-TH119
IBH-HN33
IBH-HN39
IBH-HN42
IHN-HP7
IHN-VL10A
IHN-VL4-1
IHN-VL6-1
IDN-BMT16
IDN-BMT28
IVL-HT150
IVL-HT152-1
IHN-VL34IHP-MC48A
IBH-TH3-1
IVL-HT181
ILS-TY4
IVL-HT309A
IVL-HT317
IVL-HT187
IVL-HT170-1
IHP-MC41
IHN-VL56
IBH-TH11
IHN-VL40-1
IVL-HT130
IBH-LS77
IBH-TH5
IHN-VL38-1
IVL-HT197
IBMT-APD63
IVL-HT127-3
IBMT-APD59-1
IVL-HT278-1
IVL-HT108
IDN-BT77
IBMT-NH17-1
IVL-HT83
IBH-HN17
IHN-VL45-1
IBH-TH65
IVL-HT178
IVL-HT103
IHN-VL64
IVL-HT141-3
IVL-HT329A
IHN-VL72
IVL-HT158
IVL-HT121
IDN-BT74
Z on the 194 first and second orders bench marks
Differences
Differences
No
Points
Z (m)
Z (m)
0,0543
66 IVL-HT71
0,0523
0,0049
67 IBH-TH59
0,0627
0,0246
68 IVL-HT173-2
0,0860
-0,0141
69 IBH-TH70A
0,0665
-0,0123
70 IHN-VL50
0,1029
-0,0410
71 IVL-HT123
0,0804
0,0344
72 ILS-HN12
0,0415
-0,1006
73 IHP-MC4-1
0,0550
-0,0039
74 IBH-LS80
0,0470
-0,0206
75 IDN-BT86
0,0950
-0,0646
76 IVL-HT320A
0,1044
-0,0582
77 IBMT-APD49-1
0,1158
-0,0686
78 IHP-NB14A
-0,1340
-0,0192
79 ILS-HN36
0,0140
-0,0504
80 ILS-HN22
-0,1483
-0,0945
81 ILS-HN29
-0,0746
-0,0572
82 IBH-HN16A
0,0509
-0,0485
83 IHN-VL28-1
0,0222
-0,0933
84 IBH-HN48
0,0954
-0,0278
85 IHN-HP2A
0,0859
-0,0323
86 IHN-HP5
0,1210
-0,0337
87 IVL-HT73
0,1703
-0,0414
88 IVL-HT95
0,1522
-0,0684
89 IIDK-TM41
0,0320
0,0631
90 IIAB-CL5
-0,0628
0,0272
91 IIAS-KS10
-0,1188
0,0619
92 IIAS-KS16
-0,0715
-0,0353
93 IIAS-KS22
-0,1120
0,0036
94 IIAS-KS32
-0,0971
-0,0512
95 IIAS-KS35
-0,1490
-0,0157
96 IIBH-XL11-1
-0,0204
-0,0177
97 IIBH-XL17
0,0250
-0,0186
98 IIBH-XL6
0,1134
-0,0283
99 IIBMT-DT12
-0,0944
-0,0199
100 IIBMT-DT14
-0,1441
0,0208
101 IIBMT-DT4
0,1568
-0,0264
102 IIBN-QT11-1
0,1120
-0,0083
103 IIBS-CD12
-0,0333
-0,0103
104 IIBS-CD14
0,1611
-0,0326
105 IIBS-CD3
0,0155
-0,0392
106 IIBS-CD7-1
0,0832
0,0611
107 IICD-HN6
0,1058
-0,0178
108 IICD-VC4
-0,1091
0,0113
109 IICD-VC4-1
0,0054
-0,0079
110 IICT-GD1
0,1305
0,0259
111 IICT-GD10
0,0103
0,0082
112 IICT-GD15-1
-0,0216
0,0175
113 IICT-GD4
0,1442
0,0225
114 IICF-VT1
0,0049
0,0264
115 IIDK-TM29
-0,0886
0,0765
116 IIDK-TM45
-0,1262
0,0485
117 IIDL-PR31
-0,1293
No
131
132
133
134
135
136
137
138
139
140
141
142
143
144
145
146
147
148
149
150
151
152
153
154
155
156
157
158
159
160
161
162
163
164
165
166
167
168
169
170
171
172
173
174
175
176
177
178
179
180
181
182
Points
IILC-TG15
IILC-TG19A
IILC-TG31
IIMC-XM7-1
IIMT-TH25
IIMT-TH4
IIMT-TH7
IIMT-TV11
IIMX-DC34
IINB-HN11-1
IINB-HN15
IINB-HN24
IINB-HN27-1
IINB-HN32-1
IINK-PT10
IINK-PT13
IINK-PT6-1
IIPLK-PL12
IIPLK-PL16
IIPLK-PL2
IIPLK-PL24
IIPLK-PL8
IISC-PL29
IISC-VT3-1
IITL-TV5-1
IITL-TV7
IITT-TK29
IITX-TL14
IITX-TL20-1
IITX-TL25
IITX-TL6
IIYB-CN18
IIYB-CN24-1
IDN-BT18-1
IBMT-APD46
IVL-HT305
IVL-HT159-3
IVL-HT262A
IHN-VL76
IVL-HT113
ILS-HN10
IBH-HN19-1
IBMT-NH11-1
IBH-HN20-1
TB01
QN01
QNG1
BP01
22A1
38A1
VL48
IHN-VL59
Differences
Z (m)
0,0427
-0,0469
0,0422
-0,0825
-0,1431
-0,0217
-0,1424
-0,0902
-0,1341
0,0281
-0,0019
0,0397
0,0055
0,1176
0,0268
0,0887
-0,2096
-0,0317
-0,0667
0,0641
-0,1687
-0,0346
-0,0922
0,0001
-0,0861
-0,0792
-0,1479
-0,0624
-0,0886
-0,0068
-0,0214
-0,0811
-0,1574
-0,0764
-0,0854
-0,0510
0,1423
0,1721
0,1302
0,1196
0,0748
0,1009
0,1350
0,1026
0,1079
-0,0246
-0,1084
0,0219
-0,0264
-0,0757
0,0401
0,0123
45
Ha Minh Hoa/Vietnam Journal of Earth Sciences 40 (2018)
53
54
55
56
57
58
59
60
61
62
63
64
65
IBH-LS88-1
IVL-HT98
IBH-LS85-1
IBH-LS93
IBH-LS71
IBT-APD56
IVL-HT87
IVL-HT247A
ILS-TY1
IVL-HT325-1
IDN-BT83
IVL-HT78
ILS-HN7
The
-0,0155
0,0110
-0,0117
-0,0133
-0,0074
0,0382
0,0281
0,0574
0,0040
0,1074
0,0552
0,0298
0,0170
RMS
of
the
118
119
120
121
122
123
124
125
126
127
128
129
130
IIGD-AB12
IIGD-AB3-1
IIGD-AB9-1
IIGD-APD2-1
IIGD-APD6-1
IIHN-AB11
IIHN-AB17
IIHN-AB20
IIHN-AB23
IIHN-AB3
IIHN-AB7
IIHN-MT15
IIHN-MT5
differences
Z i i i (i 1,2,...,194 ) is equal to:
~*
Zi2
194
mZ
1,1750
0,078 m.
194
194
Because the RMS of the national quasigeoid
heights calculated by formula (1) got equal
i 1
to m 0,053 m, the contribution portion
of RMS m ~* of the quasigeoid heights of
~*
the corrected quasigeoid model VIGAC2017
to the RMS value mZ 0,078 m is equal
to 0,058 m.
From the RMS values m~* 0,058 m
and m * (3) we realize that in comparison
with
the
initial
quasigeoid
model
VIGAC2017, the corrected quasigeoid model
VIGAC2017 has been more accurate than
20,69 %.
5. Discussions
Research results show that after fitting the
initial quasigeoid model VIGAC2017 to 194
national quasigeoid heights at the first and
second orders bench marks by the least
squares collocation, accuracy of the corrected
quasigeoid model VIGAC2017 had been
increased to 20,69 %. That has been obtained
46
-0,0212
-0,0451
-0,0068
0,1062
-0,0193
-0,0317
-0,0880
-0,0542
-0,0333
-0,0346
-0,1025
-0,0598
0,0092
183
184
185
186
187
188
189
190
191
192
193
194
VL73
HT73
HT84
HT94
HT106
HT121
HT127-4
IVL-HT141-3
HT159-1
HT173-3
HT197
IHP-MC45
0,1348
0,1263
0,0415
0,0882
0,0137
-0,0415
0,0117
0,0622
-0,0326
-0,0243
0,0932
0,0950
taking into account the spatial dependences of
the quasigeoid heights in the Earth gravity
field on territory of Vietnam.
However, the corrected quasigeoid
model VIGAC2017 still does not obtain
accuracy more than 4 cm. The next increase
of accuracy of the national quasigeoid model
in Vietnam will be accomplished in the future
on base of using detailed gravimetric data.
6. Conclusions
Above represented research results show,
that on the base of solving the task of fitting
the initial quasigeoid model VIGAC2017 to
the 194 national quasigeoid heights got from
the 194 GPS/first and second orders levelling
quasigeoid heights by the least squares
collocation, the accuracy of the this model has
been increased to to 20,69 %. That had been
obtained due to taking into account the spatial
dependences of the quasigeoid heights in the
Earth gravity field on territory of Vietnam,
With obtained accuracy of ± 0,058 m the
corrected quasigeoid model VIGAC2017 may
be used for solving of some tasks related to
physical geodesy in the initial spatial
reference system VN2000-3D.
A perfection of the national spatial
reference system in relation to step by step
accuracy improvement of the national
quasigeoid model is iterative process. After
accomplishment of detailed gravimetric
measurements on whole territory of Vietnam
Ha Minh Hoa/Vietnam Journal of Earth Sciences 40 (2018)
will be realized the next accuracy
improvement of the national quasigeoid
model, That will create conditions for the next
perfection of the national spatial reference
system in Vietnam in the future.
References
Cressie N.A.C., 1993. Statistics for spatial data, John
Wiley & Sons. New York, 900p.
Ha Minh Hoa, et al., 2012. Research scientific base for
perfection of the height system in connection with
construction of national dynamic reference system.
General report of the science - technological teme of
the Ministry of Natural Resources and Environment,
Hanoi, 247p.
Ha Minh Hoa (Editor), 2016. Research for determination
of normal surfaces of sea levels (“zero” depth
surface, mean sea surface, highest sea surface) by
methods of geodesy, hydrography and geology with
serving construction of buildings and planning of
coastline in tendency of climate changes”. State
techno - scientific theme with code KC,09,19/11-15
in period of 2011-2015, Vietnam Ministry of
Science and Technology, Hanoi, 563p.
Ha Minh Hoa, 2017. Construction of inital national
quasigeoid model VIGAC2017 - First step to
national spatial reference system in Vietnam.
Vietnam J. Earth Sci., 39(2), 155-166, Doi:
10,15625/0866-7187/39/2/9702.
Huang J., Véronneau M., 2013. Contribution of the
GRACE and GOCE models to a geopotential based geodetich vertical datum in Canada.
46
Geophysical Research Abstracts, 15, EGU201310164.
Iliffe J.C., Ziebart M., Cross P.A., Forsberg R.,
Strykowski G., Tscherning C.C., 2003. OSGM02: A
New model for converting GPS-derived heights to
local height datums in Great Britain and Ireland.
Survey Review, 37(290), 276-293.
Marcin Ligas, Marek Kulczycki, 2014. Kriging approch
for local height transformations. J, Geodesy And
Cartography, Polish Academy of Sciences, 63(1), 537, Doi: 10,2478/geocart-2014-0002.
Metin Soycan, 2014. Improving EGM2008 by GPS and
leveling data at local scale. BCG - Boletin de
Ciências Geodésicas Sec, Artigos, Curitiba, 20(1),
3-18, on - lineversion, ISSN 1982-2170,
Doi,org/10,1590/S1982-21702014000100001.
Moritz H., 1980. Advanced Physical Geodesy. Herbert
wichmann Verlag Karlsruhe, Abacus Press
Tunbridge Wells Ken, 512p.
Quasigeoid of the Federal Republic of Germany
GCG2016. Federal Agency for Cartography and
Geodesy, www,geodatenzentrum.de.
Roman D.R., Wang Y.M., Saleh J., Li X., 2010.
Geodesy, Geoids & Vertical Datums: A Perspective
from the U,S, National Geodetic Survey. FIG
Congress 2010, Sydney, Australia, April 2010,
11-16.
Schabenger O., Gotway C.A., 2005. Statistical methods
for spatial data analysis. Chapman & Hall/CRC,
New York, ISBN 1-58488-322-7, 488p.
Smirnov N.V., Belugin D.A., 1969. Probability theory
and mathematical statistics in applying to geodesy.
Moscow, Nedra, 379p.