Soil structure and soil organic matter in water stable aggregates under different application rates of biochar
Bạn đang xem bản rút gọn của tài liệu. Xem và tải ngay bản đầy đủ của tài liệu tại đây (323.35 KB, 12 trang )
Vietnam Journal of Earth Sciences, 40(2), 97-108, Doi: 10.15625/0866-7187/40/2/11090
Vietnam Academy of Science and Technology
Vietnam Journal of Earth Sciences
(VAST)
/>
Soil structure and soil organic matter in water-stable
aggregates under different application rates of biochar
Vladimir Simansky1*, Jan Horak2, Martin Juriga1, Dusan Srank1
1
Department of Soil Science, FAFR - SUA Nitra, 949 76 Nitra, Tr. A. Hlinku 2, Slovak Republic
Department of Biometeorology and Hydrology, HLEF - SUA Nitra, 949 76 Nitra, Hospodarska 7, Slovak
Republic
2
Received 3 November 2017; Received in revised form 11 January 2018; Accepted 13 February 2018
ABSTRACT
The effects of biochar and biochar combined with N-fertilizer on the content of soil organic matter in water-stable
aggregates were investigated. A field experiment was conducted with different biochar application rates: B0 control
(0 t ha-1), B10 (10 t ha-1) and B20 (20 t ha-1) and 0 (no N), 1st and 2nd levels of nitrogen fertilization on silt loam Haplic Luvisol (Dolna Malanta, Slovakia), in 2014. The N doses of level 1 were calculated on required average crop production using balance method. Level 2 included additional 100% of N in year 2014 and additional 50% of N in year
2016. The effects were investigated during the growing seasons of spring barley and spring wheat in 2014 and 2016,
respectively. Results indicate that the B20N2 treatment significantly increased the proportion of water-stable macroaggregates (WSAma) and reduced water-stable micro-aggregates (WSAmi). Aggregate stability increased only in the
B20N1 treatment. The B20N2 treatment showed a robust decrease by 27% in the WSAma of 0.5-0.25 mm. On the
other hand, an increase by 56% was observed in the content of WSAma with fractions 3-2 mm compared to the B0N0
treatment. The effect of N fertilizer on WSAma was confirmed only in the case of the B10N2 treatment. The proportion of WSAma with fractions 3-2 mm decreased by 42%, while the size fraction of 0.5-0.25 mm increased by 30%
compared to the B10N0 treatment. The content of WSAma with fractions 1-0.5 mm decreased with time. On the contrary, the content of WSAma with particle sizes above 5 mm increased with time in all treatments except the B10N2
and B20N2 treatments. A statistically significant trend was identified in the proportion of WSA in the B10N2 and
B20N2 treatments, which indicates that biochar with higher application levels of N fertilizer stabilizes the proportion
of water-stable aggregates. In all treatments, the content of soil organic carbon (SOC) and labile carbon (C L) in
WSAmi was lower than those in WSAma. A considerable decrease of SOC in the WSAma >5 mm and an increase of
SOC in WSAmi were observed when biochar was applied at the rate of 10 t ha-1. Contents of SOC in WSAmi increased as a result of adding biochar combined with N fertilizer at first level. C L in WSA significantly increased in all
size fractions of WSA.
Keywords: soil structure; soil organic carbon; labile carbon; aggregate stability; biochar; N fertilizer.
©2018 Vietnam Academy of Science and Technology
1. Introduction1
Soil structure depends on the organization
of mineral and organic particles with an active
*
Corresponding author, Email:
involvement of microorganisms and soil fauna
(Bronick and Lal, 2005; Six et al., 2004). Soil
aggregates are the key elements of soil structure. They play an important role in the accumulation and protection of soil organic matter
97
Vladimir Simansky, et al./Vietnam Journal of Earth Sciences 40 (2018)
(SOM), the optimization of soil water and air
regimes, and the storage and availability of
plant nutrients (Von Lutzow et al., 2006). Soil
aggregates are also the basic units of soil
structure (Lynch and Bragg, 1985). From the
agronomical point of view, water-stable micro-aggregates and mainly macro-aggregates
are essential.
One of the most important characteristics
of soil aggregates is their stability. Aggregate
stability refers to the ability of soil aggregates
to resist disruption induced by external forces
(Hiller, 1982). Aggregate stability is often regarded as a reflection of soil structure and soil
health, because it depends on the balance between chemical, physical, and biological factors (Bronick and Lal, 2005; Brevik et al.,
2015). Aggregate stability is affected by soil
intrinsic factors such as the strength of electrolytes, types of exchangeable cations (Paradelo et al., 2013), type and abundance of
clay minerals (Bronic and Lal, 2005), content
of carbonates (Vaezi et al., 2008), SOM (Saha
et al., 2011; Simansky and Jonczak, 2016),
and geochemical barriers such as Fe, Mn and
Al oxides and hydroxides (Barthes et al.,
2008). All of these factors depend on the climate conditions, soil formation processes
(wet-dry and freeze-thaw cycles), biological
factors and soil management practices (Balashov and Buchkina, 2011; Kurakov and
Kharin, 2012). It has been already observed
that aggregate stability increases with the content of SOM (Kodesova et al., 2015; Simansky and Jonczak, 2016). Soil aggregates are of
particular importance for processes of soil
carbon sequestration (Chenu and Plante, 2006;
Six et al., 2000).
Soil management plays an important role
in the formation of soil structure (Balashov
and Buchkina, 2011). It is already well known
that soil management practices influence the
content of SOM (Simon et al., 2009), which is
one of the essential factors in WSA formation
(Krol et al., 2013). Over the last decade, biochars have been in the focus of agricultural
research due to their positive effects on soil
pH (Jeffery et al., 2011). Since biochar has the
98
surface-to-volume ratio with the high specific
surface area (Glaser et al., 2002), nutrient regimes in soils are usually improved after its
application. Applied biochar improves soil
physical properties such as retention water capacity, total porosity (Kammanm et al., 2011)
and soil structure (Barrow, 2012). Biochars
associate with soil particles resulting in stable
soil aggregates with favorable structure (Jien
and Wang, 2013). Biochar is a stable source
of organic carbon (Fischer and Glaser, 2012).
Applying biochar into soil can also immobilize P, Ca and N nutrients (Rees et al., 2015).
Therefore, incorporating biochar into soils requires that other organic and mineral fertilizers are artificially supplemented.
As for agriculture sustainability, combining biochar with a N fertilizer appears to be a
promising practice offering a possibility of
higher carbon sequestration rates. Since the
interaction between biochar, mineral fertilizer
and soil is a complex process, additional research is necessary.
The objectives of this study were to (i)
quantify the effects of biochar and biochar in
combination with N fertilizer on the soil structure parameters, the proportion of water-stable
aggregates (WSA) and SOM in WSA, and (ii)
evaluate the dynamic changes of proportion of
WSA and SOM in aggregates in relation with
doses of biochar and biochar with N fertilizer.
2. Material and Methods
Description of study site
The field experiments were conducted at
the experimental site of the Slovak University
of Agriculture Nitra, Dolna Malanta Nitra
(48o19 00 N; 18o09 00 E). The site has a temperate climate, with a mean annual air temperature of 9.8°C, and the mean annual precipitation is 540 mm. The geological substratum consists of little bedrock materials such
as biotite, quartz, diorite, triassic quartzites
with phyllite horizonts, crinoid limestones and
sandy limestone with high quantities of fine
materials. The young Neogene deposits consist of various clays, loams and sand gravels
on which loess was deposited during the
Vietnam Journal of Earth Sciences, 40(2), 97-108
Pleistocene epoch. The soil at this site is classified as Haplic Luvisol according to the Soil
Taxonomy (WRB, 2014). The soil has 9.13 g
kg-1 of soil organic carbon, pH is 5.71 and the
texture is silt loam (sand: 15.2%, silt: 59.9%
and clay: 24.9%).
Experimental design and field management
The soil had been cultivated for over 100
years classic conventional agriculture techniques before the experiment. The experiment
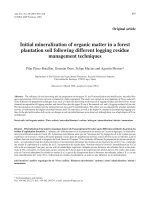
was established in March 2014 and experimental field is shown in Figure 1. As is shown
in Table 1 the experiment consisted of seven
treatments. The study was set up in the field
research station as a total of 21 plots each
with an area of 24 m2 (4 m × 6 m). Each set of
seven plots was arranged in a row and treated
as a replication, and the interval between
neighboring replications was 0.5 m. To maintain consistency, ploughing and mixing treatments were also performed in control
plots where no biochar and N fertilizer
were applied. A standard N fertilizer
(Calc-Ammonium nitrate with dolomite, LAD
27) was used in this experiment. The doses of
the level 1 were calculated on required average crop production using balance method.
The level 2 included additional 100% of N in
the year 2014 and additional 50% of N in the
year 2016. The biochar used in this study was
acquired from Sonnenerde, Austria. The biochar was produced from paper fiber sludge
and grain husks (1:1 w/w). As declared by the
manufacturer, the biochar was produced at a
pyrolysis temperature of 550°C applied for 30
minutes in a Pyreg reactor. The pyrolysis
product has particle sizes between 1 to 5 mm.
On average, it contains 57 g kg-1 of Ca, 3.9 g
kg-1 of Mg, 15 g kg-1 of K and 0.77 g kg-1 of
Na. The total C content of the biochar sample
is 53.1 %, while the total N content is 1.4 %,
the C:N ratio is 37.9, the specific surface area
(SSA) is 21.7 m2 g-1 and the content of ash is
38.3 %. On average, the pH of the biochar is
8.8. The spring barley (Hordeum vulgare L.)
and spring wheat (Triticum aestivum L.) were
sown in 2014 and 2016, respectively.
Figure 1. Field site location and an areal view of experimental plots
99
Vladimir Simansky, et al./Vietnam Journal of Earth Sciences 40 (2018)
Table 1. The investigated treatments
Treatment
Description
B0N0
no biochar, no N fertilization
B10N0
biochar at rate of 10 t ha–1
B20N0
biochar at rate of 20 t ha–1
biochar at rate of 10 t ha–1 with N: dose of N were, 40 and 100 kg
B10N1
2016, respectively
biochar at rate of 20 t ha–1 with N: dose of N were, 40 and 100 kg
B20N1
2016, respectively
biochar at rate of 10 t ha–1 with N: dose of N were, 80 and 150 kg
B10N2
2016, respectively
biochar at rate of 20 t ha–1 with N: dose of N were, 80 and 150 kg
B20N2
2016, respectively
Sampling and measurements
Soil samples were collected from the topsoil (0-20 cm) in all treatments. Sampling of
soil was conducted monthly to cover the
whole growing season of spring barley (sampling dates: 17 April, 15 May, 16 June, and 13
July in 2014) as well as in 2016 to cover the
whole spring growing season of wheat (sampling dates: on 20 April, 17 May, 22 June, and
18 July). Thus, for the 2014 treatments, sampling was conducted at one, two, three and
four months after biochar application, while
for the 2016 treatments, sampling was conducted at 26, 27, 28 and 29 months after biochar application.
The soil samples were carefully taken using a spade to avoid disruption of the soil aggregates. The samples were mixed to produce
an average representative sample from each
plot. Roots and large pieces of crop residues
were removed. The collected soil samples
were transported to the laboratory and large
clods were gently broken up along natural
fracture lines. The samples were air-dried at
laboratory temperature 20oC to obtain undisturbed soil samples. We used the Baksheev
method (Vadjunina and Korchagina, 1986) to
determine the water-stable aggregates (WSA).
The soil organic carbon (SOC) and the labile
carbon (CL) were analyzed in all fraction sizes
of the WSA (Loginow et al., 1987; Dziadowiec and Gonet, 1999). The indexes of aggre100
N ha–1 in 2014 and
N ha–1 in 2014 and
N ha–1 in 2014 and
N ha–1 in 2014 and
gate stability (Sw), mean weight diameters of
aggregates for dry (MWDd) and wet sieving
(MWDW), as well as vulnerability coefficient
(Kv) were calculated according to following
equations (1-4):
Sw
WSA 0.09sand
silt clay
(1)
where: Sw denotes aggregate stability and
WSA is the content of water-stable aggregates
(%).
MWDd xi wi
n
i 1
(2)
where: MWDd is the mean weight diameter of
aggregates for dry sieving (mm), xi is the
mean diameter of each size fraction (mm) and
wi is the portion of the total sample weight
within the corresponding size fraction, and n
is the number of size fractions.
MWDW xiWSA
n
i 1
(3)
where: MWDw is mean weight diameter of
WSA (mm), xi is mean diameter of each size
fraction (mm), and WSA is the portion of the
total sample weight within the corresponding
size fraction, and n is the number of size fractions.
Kv
MWDd
MWDw
(4)
where: Kv is the vulnerability coefficient,
MWDd is the mean weight diameter of aggre-
Vietnam Journal of Earth Sciences, 40(2), 97-108
gates for dry sieving (mm), and MWDw is the
mean weight diameter of WSA (mm).
Statistics
The data was analyzed by ANOVA tests
using a software package Statgraphics Centurion XV.I (Statpoint Technologies, Inc.,
USA). Comparisons were made using the
method of least significant differences (LSD)
at the probability level P = 0.05. The MannKendall test was used to evaluate the trends in
the proportions of WSA and the contents of
SOC and CL in the WSA.
3. Results and discussion
Proportion of water-stable aggregates and
soil structure parameters
Parameters of soil structure such as
MWDw, Kv, Sw, as well as WSAma and WSAmi
as a result of biochar amendment are shown in
Table 2. Our findings confirm the results of
Atkinson et al. (2010) i.e. biochar exerted positive effects on soil structure. However, the
effects of biochar on soil structure largely depend on the properties of biochar that may
vary considerably due to the variations in
feedstock materials, pyrolysis conditions, etc.
(Purakayastha et al. 2015; Heitkötter and
Marschner 2015). In our case, the proportion
of WSAma decreased in the following order:
B20N2 > B10N0 > B20N1 > B20N0 >
B10N1 > B0N0 > B10N2. The index of aggregate stability increased in the following order: B10N2 < B0N0 < B10N1 = B20N1 <
B10N0 = B20N0
and MWDw (Table 2). Compared to the B0N0,
only the B20N2 treatment significantly increased the proportion of WSAma and reduced
the proportion of WSAmi. Furthermore, our
results suggest that biochar did not enhance
the formation of WSAmi, since the particle
sizes of the biochar were within the range of 1
to 5 mm. These findings agree with those of
Herath et al. (2013) who also observed that
biochar applied after 295 days of incubation
did not enhance the formation of microaggregates. Brodowski et al. (2006) stated that
incorporation of biochar into soil contributes
to the formation of micro-aggregates. Generally, organic amendments added to soil are
accompanied with an increase in microbiallyproduced polysaccharides (Angers et al.,
1993), especially those from fungi (Tiessen
and Stewart, 1988) which can increase the
stability of aggregates and the content of
WSAma (Herath et al., 2013; Soinne et al.,
2014). In our study, a statistically significant
effect on Sw was observed in the treatment
with 20 t biochar ha-1 combined with 2nd level
of N fertilization. The reasons for a higher aggregate stability can be explained by the application of higher doses of biochar together
with nitrogen. Fertilizer application generally
improves soil aggregation (Munkholm et al.,
2002). An improved nutrient management increases biomass and enhances the growth of
roots and their activity (Abiven et al., 2015).
The increased aggregate stability can be explained by the enhanced root activity and the
direct effect of biochar acting as a binding
agent of soil particles (Brodowski et al.,
2006). The higher root biomass through exudates and moving soil particles help aggregate
formation (Bronick and Lal, 2005).
The effects of various rates of biochar and
biochar with various levels of N fertilizer on
the individual size fractions of the WSAma are
shown in Table 3. The B20N2 treatment
showed a robust decrease (by 27%) in WSAma
between 0.5 and 0.25 mm, but on the other
hand, the content of WSAma with particle sizes
between 3 and 2 mm increased by 56% compared to B0N0. Formation of soil aggregates
is a function of biological activity and time,
and it is unlikely to occur immediately upon
biochar application (Herath et al., 2013).
101
Vladimir Simansky, et al./Vietnam Journal of Earth Sciences 40 (2018)
Table 2. Parameters of soil structure (mean and standard deviation)
Treatments
%WSAma
%WSAmi
Sw
Kv
MWDd
MWDW
B0N0
72.0±6.78ab
28.6±6.78bc
0.82±0.08a
4.29±0.90ab
2.97±0.69a
0.72±0.21ab
abc
abc
ab
a
a
B10N0
75.6±9.70
24.4±9.70
0.88±0.11
3.33±0.62
2.90±0.37
0.90±0.24 b
abc
abc
ab
ab
a
B20N0
75.4±10.5
24.6±10.5
0.88±0.12
3.99±1.92
2.85 ±0.13
0.87±0.38ab
abc
abc
ab
a
a
B10N1
75.2±6.54
24.8±6.54
0.87±0.08
3.48±0.90
3.07±0.43
0.94 ±0.28b
B20N1
76.3±8.68bc
23.7±8.68ab
0.87±0.13ab
3.37±1.31a
2.73±0.43 a
0.90±0.31b
a
c
a
b
a
B10N2
68.0±6.93
32.0±6.93
0.79±0.08
4.75±1.68
2.74 ±0.48
0.62 ±0.17a
c
a
b
a
a
B20N2
80.3±7.40
19.7±7.40
0.93±0.09
3.05±0.69
2.88±0.43
0.98±0.25b
Different letters (a, b, c) between lines indicate that treatment means are significantly different at P<0.05 according to
LSD test
Table 3. Percentage contents of individual size fraction of water-stable macro-aggregates (mean and standard deviation)
Individual size fractions of water-stable macro-aggregates in mm
Treatments
>5
5-3
3-2
2-1
1-0.5
0.5-0.25
B0N0
2.44±1.58ab
3.81±1.23ab
7.87±3.41ab
15.0±7.75ab
25.5±5.03a
17.5±4.60bc
B10N0
3.62±1.22ab
5.91±2.10ab
11.0±4.23bc
17.4±7.35ab
22.5±3.52a
15.2±3.90ab
ab
ab
bc
ab
a
B20N0
3.19±1.02
5.42±1.98
11.1±5.89
16.3±7.16
23.9±5.14
15.5±4.87abc
b
ab
abc
ab
a
B10N1
4.70±1.30
6.16±3.16
10.5±4.16
15.7±5.25
21.0±3.31
17.2±5.65bc
B20N1
4.10±1.13ab
4.50±1.35ab
10.6±4.35abc
19.3±7.65b
23.4±5.32a
14.3±3.12ab
a
a
a
a
a
B10N2
2.06±0.93
3.29±1.09
6.34±3.29
11.7±7.30
24.9±4.95
19.7±4.19c
B20N2
3.421.23ab
6.66±2.39b
12.3±4.64c
21.8±7.13b
23.5±5.58a
12.7±2.80a
Different letters (a, b, c) between lines indicate that treatment means are significantly different at P<0.05 according to
LSD test
The biochar in our experiments has rather
coarse particle sizes with diameters ranging
from 1 to 5 mm, which may pose limitations
to the soil-microbe-biochar interactions. Furthermore, the conversion to WSAma with particle sizes 0.5-0.25 mm might therefore be difficult and can happen only after a certain
amount of time. Applying biochar with no N
fertilization at the rates of 10 and 20 t ha-1 did
not affect the proportion of WSAma. A combination of biochar applied at 10 t ha-1 with both
levels of N fertilizer had no significant effect
on the proportion of WSAma compared to the
B0N0 treatment. The effect of N fertilizer on
the WSAma was confirmed only in the case of
the B10N2 treatment. The proportion of
WSAma with particle sizes ranging from 3 to 2
mm decreased by 42%, and increased by 30%
for the size fraction 0.5-0.25 mm compared to
the B10N0 treatment. The Mann-Kendall test
identified a significant trend in the WSA
(Table 4). The proportion of WSAma with particle diameters of 2 to 1 mm did not change
during the growing season in 2014 and 2016.
102
The content of WSAma with particle sizes
between 1 and 0.5 mm decreased, whereas the
content of WSAma with particle sizes above 5
mm increased during the investigated periods
in all treatments except the B10N2 and the
B20N2 treatments. The proportions of WSAma
with particle sizes between 5 and 3 mm and
between 3 and 2 mm increased in the B20N0,
B10N1 and the B20N1 treatments over the
growing seasons.
Our findings show that sole biochar and
biochar with the combination of N fertilizer
do not explain the changes in the WSAma with
particle sizes between 2 to 1 mm. The proportion of the WSAma with larger particle sizes
increased over the investigated periods. On
the contrary, the proportion of the WSA with
small size fractions decreased during the
growing periods. A stable trend was observed
in the proportion of the WSA in both the
B10N2 and B20N2 treatments. This means
that biochar with a higher N fertilizer content
may be responsible for the stabilized proportion of WSA (Table 4).
Vietnam Journal of Earth Sciences, 40(2), 97-108
Table 4. Dynamics of individual size fraction of water-stable aggregates and soil organic carbon and labile carbon in
water-stable aggregates during investigated period (Mann-Kendall test)
Individual size fractions of water-stable aggregates in mm
Treatments
>5
5-3
3-2
2-1
1-0.5
0.5-0.25
<0.25
B0N0
increased
increased
increased
stable/no
decreased
stable/no
stable/no
trend
trend
trend
B10N0
increased
stable/no
decreased
stable/no
decreased
stable/no
stable/no
trend
trend
trend
trend
B20N0
increased
increased
increased
stable/no
decreased
stable/no
decreased
trend
trend
B10N1
increased
increased
increased
stable/no
decreased
decreased
stable/no
trend
trend
B20N1
increased
increased
increased
stable/no
decreased
stable/no
stable/no
trend
trend
trend
B10N2
stable/no
stable/no
stable/no
stable/no
stable/no
stable/no
stable/no
trend
trend
trend
trend
trend
trend
trend
B20N2
stable/no
stable/no
stable/no
stable/no
stable/no
stable/no
stable/no
trend
trend
trend
trend
trend
trend
trend
Content of soil organic carbon in water-stable aggregates
B0N0
stable/no
decreased
stable/no
stable/no
increased
stable/no
stable/no
trend
trend
trend
trend
trend
B10N0
decreased
stable/no
stable/no
stable/no
stable/no
stable/no
increased
trend
trend
trend
trend
trend
B20N0
stable/no
stable/no
stable/no
stable/no
stable/no
stable/no
stable/no
trend
trend
trend
trend
trend
trend
trend
B10N1
increased
decreased
stable/no
stable/no
stable/no
increased
increased
trend
trend
trend
B20N1
stable/no
stable/no
stable/no
stable/no
increased
increased
increased
trend
trend
trend
trend
B10N2
stable/no
stable/no
stable/no
stable/no
stable/no
stable/no
stable/no
trend
trend
trend
trend
trend
trend
trend
B20N2
stable/no
stable/no
decreased
stable/no
stable/no
stable/no
stable/no
trend
trend
trend
trend
trend
trend
Content of labile carbon in water-stable aggregates
B0N0
increased
increased
increased
increased
increased
increased
increased
B10N0
increased
increased
increased
increased
increased
increased
increased
B20N0
increased
increased
increased
increased
increased
increased
increased
B10N1
increased
increased
increased
increased
increased
increased
increased
B20N1
increased
increased
increased
increased
increased
increased
increased
B10N2
increased
increased
increased
increased
increased
increased
increased
B20N2
increased
increased
increased
increased
increased
increased
increased
Contents of soil organic matter in waterstable aggregates
Organic amendments are known to increase the content of SOC (Agegnehu et al.,
2016). Soil particles tend to form aggregates
accompanying with occluded biochar
(Brodowski et al., 2006). This could be the
main reason of the elevated C content in the
aggregates (Blanco-Canqui and Lal, 2004).
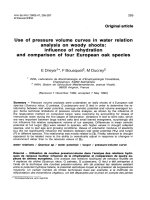
Results of our study showed that different
rates of biochar and biochar with different
levels of N fertilization affected the distribution of SOC and CL content in aggregates
(Figure 2 and 3), ranging from 8.80 to 15.8 g
103
Vladimir Simansky, et al./Vietnam Journal of Earth Sciences 40 (2018)
kg-1 and from 1.11 to 1.65 g kg-1 for biochar
treatments, and from 9.70 to 15.6 g kg-1 and
from 0.99 to 1.81 g kg-1 for biochar with N
fertilization treatments. In all treatments, the
content of SOC in WSAmi was lower than
WSAma. The SOC in WSAmi were 10.5, 8.80,
10.6, 9.70, 11.1, 10.4 and 11.5 g kg-1 of SOC
in the B0N0, B10N0, B20N0, B10N1,
B20N1, B10N2 and B20N2 treatments, re-
spectively. The largest size class of WSA (> 5
mm) contained the largest CL in all treatments,
with 1.54, 1.54, 1.65, 1.57, 1.59, 1.66 and
1.81 g kg-1 of CL in the B0N0, B10N0,
B20N0, B10N1, B20N1, B10N2 and B20N2
treatments, respectively, while the smallest
size class of WSA (< 0.25 mm or WSAmi)
contained the lowest CL pool in all treatments
(Figure 3).
25
b
content of soil organic carbon (g kg-1)
20
b
a
a
15
a
b
a
a
ab
b
bc
b
c
a
a
b
a
aa
b
cd
a
a
b
a
a
b
c
b
c
a
b
b
ab
b
b
b
c
a
c
b
d
b
d
b
b
a
10
5
0
B0N0
B10N0
B20N0
>5
5-3
B10N1
B20N1
treatments
3-2
2-1
1-0.5
0.5-0.25
B10N2
B20N2
<0.25
Figure 2. Contents of soil organic carbon in individual size fractions of water-stable aggregates (mean and standard
deviation); Different letters (a, b, c, d) between columns (the same color) indicate that treatment means are significantly different at P<0.05 according to LSD test
Generally, the higher content of SOC is accompanied with a higher occurrence of WSAma
and WSAmi. The importance of SOC content in
the formation of aggregates is well known
(Kodesova et al., 2015). In the study of Liu and
Zhou (2017), macro- and micro-aggregation
was significantly improved by using organic
amendments. The large aggregates contained
the largest pool of C in manure treatments
(Simansky, 2013). Tisdall and Oades (1980)
and Six et al. (2004) found higher concentrations of organic C in macro-aggregates than in
micro-aggregates. Decomposition of roots and
hyphae occurs within macro-aggregates. Elliott
(1986) suggested that macro-aggregates have
elevated C concentrations because of the or104
ganic matter binding micro-aggregates into
macro-aggregates and the organic matter is
“qualitatively more labile and less highly processed” than the organics stabilizing microaggregates. Based on Mann-Kendall test, the
temporal behavior of SOC in WSA in relation
to application of biochar or biochar with N fertilizer was different during the investigated period (Table 4). A considerable decrease in SOC
with WSAma >5 mm and an increase in SOC
with WSAmi when 10 t ha-1 of biochar was applied. During the investigated period, the application of 20 t ha-1 of biochar as well as 10 and
20 t ha-1 of biochar combined with the second
level of N fertilization had no effect on the redistribution of SOC in WSA. The SOC in
Vietnam Journal of Earth Sciences, 40(2), 97-108
WSAmi gradually increased after applying biochar combined with the first level of N fertilization during the investigated period. CL in
WSA significantly increased in all size fractions of WSA and in all treatments (Table 4)
during the investigated period. The dynamic of
CL changes significantly due to different soil
management practices (Benbi et al., 2012).
Therefore, the CL is used as a sensitive indicator of changes in SOM (Benbi et al., 2015) and
aggregate stability (Simansky, 2013). As a result, the decomposition of the organic matter
increases CL, eventually enhancing aggregation
(Bronick and Lal, 2005).
2.5
a
content of labile carbon (g kg-1)
2
aa
a
a
0.5
a
a
a
a
ab
1
a a
a
a
a a
Genraly,the igherconte ofSOCisacompaniedwtha igherocurencofWSAmaandWSAmi.
TheimportanceofSOCconte intheformation fagreatsiwelknow (Kodesvaetl.,2015).In
thesudyofLiuandZhou(2017),macro-ndmicro-agreationwasignfcatlyimprovedbyusing
organicmend ts.Thelarg regatscontaiedthlargestpol fCinmauret aments
(Simansky,2013).Tisdal ndOaes(1980)andSixetal.(204)foundhigerconetraions forganic
Cinmacro-greatshani mcro-agreats.Decompsiton frotsandhypaeocurswithn
macro-greats.Eliot(1986)sugetdhatmcro-agreatshvel atedCconetraionsbecaus
oftheorganicmaterbind gmicro-agreatsinomacro-greatsndtheorganicmateris
“qualitativelymorelabiendleshiglyproces d”than eorganicstabilzngmicro-agreats.
BasedonMan-Kedaltes,htemporalbehvior fSOCinWSAinrelation aplicton fbiochar
orbicharwithNfertilz wasdiferntduringtheinvstgaedpriod(Table4).Aconsiderabl
decraseinSOCwithWSAma>5m and increasinSOCwithWSAmiwhen10tha-1ofbicharws
aplied.Duringtheinvstgaedpriod,theaplicton f20tha-1ofbicharswelas10nd20tha-1
ofbicharombinedwith escondlev ofNertilzaonhad oef ctonher-distrbuion fSOCin
WSA.TheSOCinWSAmigradulyincreasdfteraplyingbocharombinedwith efirstlev ofN
fertilzaondurigtheinvstgaedpriod.CLinWSAsignfcatlyincreasdinalsizefractions f
WSAandi altremnts(Table4)duringtheinvstgaedpriod.ThedynamicofCLchanges
signfcatlyduetodiferntsoilmangemntpracies(Bnbietal.,201).Therfo ,theCLisuedas
senitvendicator fchangesi SOM(Benbital.2015)andgreatsbilty(Simansky,2013).Asa
result,hedcompsiton ftheorganicmaterinceas CL,evntualyenhacinga regation(Bronick
andLl,205).
Genraly,theig rconte ofSOCisacompaniedwthaigherocurencofWSAmaandWSAmi.
TheimportanceofSOCconte itheformationfagreatsiwelknow(Kodesvatl.,2015).In
thesudyofLiuandZhou(2017),macro-ndmicro-agreationwasignfcatlyimprovedbyusing
organicmend ts.Thelarg regatscontaiedthlargestpolfCinmauretaments
(Simansky,2013).Tisdal ndOaes(1980)andSixetal.(204)foundhigerconetraionsforganic
Cinmacro-greatshnimcro-agreats.Decompsitonfrotsandhypaeocurswithn
macro-greats.Eliot(1986)sugetdhatmcro-agreatshvel atedCconetraionsbecaus
oftherganicmaterbind gmicro-agreatsinomacro-greatsndtheorganicmateris
“qualitativelymorelabi ndleshiglyproces d”than eorganicstabilzngmicro-agreats.
BasedonMa -Kendaltes,htemporalbehviorfSOCinWSAinrelation aplictonfbiochar
orbicharwithNfertilz wasdiferntduringtheinvstgaedpriod(Table4).Aconsiderabl
decrasinSOCwithWSAma>5m and increasinSOCwithWSAmiwhen10tha-1ofbicharws
aplied.Duringtheinvstgaedpriod,theaplictonf20tha-1ofbicharswelas10nd20tha-1
ofbicharombinedwith escondlev ofNertilzaonhadoefctonher-distbuionfSOCin
WSA.TheSOCinWSAmigradulyincreasdfteraplyingbocharombinedwith efirstlev ofN
fertilzaondurigtheinvstgaedpriod.CLinWSAsignfcatlyincreasdinalsizefractionsf
WSAandialtremnts(Table4)duringtheinvstgaedpriod.ThedynamicofCLchanges
signfcatlyduetodiferntsoilmangemntpracies(Bnbietal.,201).Therfo,theCLisuedas
senitvendicatorfchangesiSOM(Benbital.2015)andgreatsbilty(Simansky,2013).Asa
result,hedcompsitonftheorganicmaterincaseCL,evntualyenhacinga regation(Br ick
andLl,205).
B0N0
B10N0
Genraly,theig rconte fSOCisacompaniedwthaigerocuencofWSAmaandWSAmi.
TheimportanceofSOCconte i heformatinofagre tsiwelknow(Kodesvatl.,2015).In
thesudyofLiuandZhou(2017),macro-ndmicro-age tionwasignfcatlyimprovedbyusing
organicmend ts.Thelarg regatsconaiedthlargestpolfCinmauretaments
(Simansky,2013).Tisdal nOades(1980)andSixetal.(204)foundhigerconetraionsfrganic
Cinmacro-geatshnimcro-age ts.Decompsitonfrotsandhypaeocurswithn
macro-geats.Eliot(1986)sugetdhamcro-age tshavel atedCconetraionsbecaus
oftherganicmterbindgmicro-age tsinomacr-geatsndtheorganicmteris
“qualitativelymorelabi ndleshiglyprocesd”than eorganicstabilzngmicro-age ts.
BasedonMa -Kendaltes,htemporalbehviorfSOCinWSAinrelaton aplictonfbiochar
orbicharwitNfertilz wasdiferntduigtheinvstgaedprio(Table4).Aconsiderabl
decrasinSOCwithWSAma>5m and icreasinSOCwithWSAmiwhen10tha-1ofbicharws
aplied.Duringtheinvstgaedprio,theaplictonf20tha-1ofbicharswelas10nd20tha-1
ofbicharombinedwth escondlev ofNertilzaonhdoefctonher-distbuonfSOCin
WSA.TheSOCinWSAmigradulyincreasdfteraplyingbocharombinedwth efirstlveofN
fertilzaondurigtheinvstgaedprio.CLinWSAsignfcatlyincreasdinalszefractionsf
WSAandi ltreamnts(Table4)duringtheinvstgaedprio.ThedynamicofCLchanges
signfcatlyduetoiferntsoilmangemntpracies(Bnbietal.,201).Therfo,theCLisuedas
senitv ndicatorfchangesiSOM(Benbital.2015)andgreatsbilty(Smansky,2013).Asa
result,hedcompsitonftheorganicmterincaseCL,ventualyenhaciga regtion(Br ick
andLl,205).
a
a
a
a
aa
Genraly,theig rconte fSOCisacompaniedwthaigerocuencofWSAmaandWSAmi.
TheimportanceofSOCconte i heformatinofagre tsiwelknow(Kodesvatl.,2015).In
thesudyofLiuandZhou(2017),macro-ndmicro-age tionwasignfcatlyimprovedbyusing
organicmend ts.Thelarg regatsconaiedthlargestpolfCinmauretaments
(Simansky,2013).Tisdal nOades(1980)andSixetal.(204)foundhigercon traionsfrganic
Cinmacro-geatshnimcro-age ts.Decompsitonfrotsandhypaeocurswithn
macro-geats.Eliot(1986)sugetdhamcro-age tshavel atedCconetraionsbecaus
oftherganicmterbindgmicro-age tsinomacr-geatsndtheorganicmteris
“qualitativelymorelabi ndleshiglyprocesd”than eorganicstabilzngmicro-age ts.
BasedonMa -Kendaltes,htemporalbehviorfSOCinWSAinrelaton aplictonfbiochar
orbicharwitNfertilz wasdiferntduigtheinvstgaedprio(Table4).Aconsiderabl
decrasinSOCwithWSAma>5m and icreasinSOCwithWSAmiwhen10tha-1ofbicharws
aplied.Duringtheinvstgaedprio,theaplictonf20tha-1ofbicharswelas10nd2tha-1
ofbicharombinedwth escondlev ofNertilzaonhdoefctonher-distbuonfSOCin
WSA.TheSOCinWSAmigradulyincreasdfteraplyingbochar mbinedwth efirstlveofN
fertilzaondurigtheinvstgaedprio.CLinWSAsignfcatlyincreasdinalszefractionsf
WSAandi ltreamnts(Table4)duringtheinvstgaedprio.ThedynamicofCLchanges
signfcatlyduetoiferntsoilmangemntpracies(Bnbietal.,201).Therfo,theCLisuedas
senitv ndicatorfchangesiSOM(Benbital.2015)andgreatsbilty(Smansky,2013).Asa
result,hedcompsitonfheorganicmterincaseCL,ventualyenhacig regation(Br ick
andLl,205).
a
b
c
b
a
1.5
a
a
a
a
b
a
a
a
a
a a
b
a
a
b
a
b
a
a
ab
Genraly,theig rconte fSOCisacompaniedwthaigerocuencofWSAmaandWSAmi.
TheimportanceofSOCconte i heformatinofagre tsiwelknow(Kodesvatl.,2015).In
thesudyofLiuandZhou(2017),macro-ndmicro-age tionwasignfcatlyimprovedbyusing
organicmend ts.Thelarg regatsconaiedthlargestpolfCinmauretaments
(Simansky,2013).Tisdal nOades(1980)andSixetal.(204)foundhigerconetraionsfrganic
Cinmacro-geatshnimcro-age ts.Decompsitonfrotsandhypaeocurswithn
macro-geats.Eliot(1986)sugetdhamcro-age tshavel atedCconetraionsbecaus
oftherganicmterbindgmicro-age tsinomacr-geatsndtheorganicmteris
“qualitativelymorelabi ndleshiglyprocesd”than eorganicstabilzngmicro-age ts.
BasedonMa -Kendaltes,htemporalbehviorfSOCinWSAinrelaton aplictonfbiochar
orbicharwitNfertilz wasdiferntduigtheinvstgaedprio(Table4).Aconsiderabl
decrasinSOCwithWSAma>5m and icreasinSOCwithWSAmiwhen10tha-1ofbicharws
aplied.Duringtheinvstgaedprio,theaplictonf20tha-1ofbicharswelas10nd20tha-1
ofbicharombinedwth escondlev ofNertilzaonhdoefctonher-distbuonfSOCin
WSA.TheSOCinWSAmigradulyincreasdfteraplyingbocharombinedwth efirstlveofN
fertilzaondurigtheinvstgaedprio.CLinWSAsignfcatlyincreasdinalszefractionsf
WSAandi ltreamnts(Table4)duringtheinvstgaedprio.ThedynamicofCLchanges
signfcatlyduetoiferntsoilmangemntpracies(Bnbietal.,201).Therfo,theCLisuedas
senitv ndicatorfchangesiSOM(Benbital.2015)andgreatsbilty(Smansky,2013).Asa
result,hedcompsitonfheorganicmterincaseCL,ventualyenhaciga regtion(Br ick
andLl,205).
Genraly,theig rconte ofSOCisacompaniedwthaigherocurencofWSAmaandWSAmi.
TheimportanceofSOCconte itheformatinofagreatsiwelknow(Kodesvatl.,2015).In
thesudyofLiuandZhou(2017),macro-ndmicro-ag eationwasignfcatlyimprovedbyusing
organicmend ts.Thelarg regatscontaiedhlargestpolfCinmauretaments
(Simansky,2013).Tisdal nOades(1980)andSixetal.(204)foundhigerconetraionsforganic
Cinmacro-g eatshnimcro-ag eats.Decompsitonfrotsandhypaeocurswithn
macro-g eats.Eliot(1986)sugetdhamcro-ag eatshvel atedCconetraionsbecaus
oftherganicmterbindgmicro-ag eatsinomacro-g eatsndtheorganicmteris
“qualitativelymorelabi ndleshiglyproces d”than eorganicstabilzngmicro-ag eats.
BasedonMa -Kendaltes,htemporalbehviorfSOCinWSAinrelation aplictonfbiochar
orbicharwithNfertilz wasdiferntdurigtheinvstgaedpriod(Table4).Aconsiderabl
decrasinSOCwithWSAma>5m and increasinSOCwithWSAmiwhen10tha-1ofbicharws
aplied.Duringtheinvstgaedpriod,theaplictonf20tha-1ofbicharswelas10nd20tha-1
ofbicharombinedwth escondlev ofNertilzaonhadoefctonher-distbuionfSOCin
WSA.TheSOCinWSAmigradulyincreasdfteraplyingbocharombinedwth efirstlev ofN
fertilzaondurigtheinvstgaedpriod.CLinWSAsignfcatlyincreasdinalszefractionsf
WSAandialtremnts(Table4)duringtheinvstgaedpriod.ThedynamicofCLchanges
signfcatlyduetodiferntsoilmangemntpracies(Bnbietal.,201).Therfo,theCLisuedas
senitv ndicatorfchangesiSOM(Benbital.2015)andgreatsbilty(Simansky,2013).Asa
result,hedcompsitonftheorganicmterincaseCL,ventualyenhaciga regation(Br ick
andLl,205).
a
a
Genraly,theigrconte fSOCisacompniedwthaigerocuen ofWSAmaandWSAmi.
TheimportanceofSOCconte i heformatinofagretsiwelknow(Kdesovatl.,2015)In
thesudyofLiuandZhou(2017),macro-ndmicro-agetionwasignfcatlyimprovedbyusing
organicmed nts.Thelarg egatsconaiedthlargestpolfCinmauretaments
(Simansky,2013).Tisdal nOades(1980)andSixetal.(204)foundhigercon traionsfrganic
Cinmacro-geatshnimcro-agets.Decompsitonfrotsandhypaeocurswithn
macro-geats.Eliot(1986)sugetdhamcro-agetshavelatdCconetraionsbecau
oftherganicmterbindgmicro-agetsinomacr-geatsndheorganicmteris
“qualitativelymorlabiendlshiglyprocesd”than eorganicstblizngmcro-age ts.
BasedonMa -Kendalts,hetmporalbehviorfSOCinWSAinrelaton aplictonfbichar
orbicharwitNferilz wasdiferntduigthenvstigaedprio(Table4).Aconsiderabl
decrasinSOCwithWSAma>5m and icreasinSOCwithWSAmiwhen10tha-1ofbicharws
aplied.Duringthe vstigaedprio,theaplictonf20tha-1ofbicharswela10nd2tha-1
ofbicharombinedwth escondlev ofNertilzaonhdoefctonher-distbuonfSOCin
WSA.TheSOCinWSAmigradulyincreasdfteraplyingbochar mbinedwth efirstlveofN
fertilzaondurigthenvstigaedprio.CLnWSAsignfcatlyincreasdinlszefractionsf
WSAandi ltreamnts(Table4)duringthe vstigaedprio.ThedynamicofCLhanges
signfcatlydueoiferntsoilmange tpracies(Bnbietal.,201)Therfo,theCLisuedas
senitv ndicatorfchangesiSOM(Benbital.2015)andgreatsbilty(Smansky,2013).Asa
result,hedcompsitonfheorganicmterincaseCL,ventualyenhacig reation(Br ick
andLl,205).
0
B20N0
>5
5-3
B10N1
B20N1
treatments
3-2
Generally, the higher content of SOC is accompanied with a higher occurrence of WSAma and WSAmi.
The importance of SOC content in the formation of aggregates is well known (Kodesova et al., 2015). In
the study of Liu and Zhou (2017), macro- and micro-aggregation was significantly improved by using
organic amendments. The large aggregates contained the largest pool of C in manure treatments
(Simansky, 2013). Tisdall and Oades (1980) and Six et al. (2004) found higher concentrations of organic
C in macro-aggregates than in micro-aggregates. Decomposition of roots and hyphae occurs within
macro-aggregates. Elliott (1986) suggested that macro-aggregates have elevated C concentrations because
of the organic matter binding micro-aggregates into macro-aggregates and the organic matter is
“qualitatively more labile and less highly processed” than the organics stabilizing micro-aggregates.
Based on Mann-Kendall test, the temporal behavior of SOC in WSA in relation to application of biochar
or biochar with N fertilizer was different during the investigated period (Table 4). A considerable
decrease in SOC with WSAma >5 mm and an increase in SOC with WSAmi when 10 t ha-1 of biochar was
applied. During the investigated period, the application of 20 t ha-1 of biochar as well as 10 and 20 t ha-1
of biochar combined with the second level of N fertilization had no effect on the re-distribution of SOC in
WSA. The SOC in WSAmi gradually increased after applying biochar combined with the first level of N
fertilization during the investigated period. CL in WSA significantly increased in all size fractions of
WSA and in all treatments (Table 4) during the investigated period. The dynamic of C L changes
significantly due to different soil management practices (Benbi et al., 2012). Therefore, the C L is used as a
sensitive indicator of changes in SOM (Benbi et al. 2015) and aggregate stability (Simansky, 2013). As a
result, the decomposition of the organic matter increases CL, eventually enhancing aggregation (Bronick
and Lal, 2005).
2-1
1-0.5
0.5-0.25
B10N2
B20N2
<0.25
Figure 3. Contents of labile carbon in individual size fractions of water-stable aggregates (mean and standard deviation); Different letters (a, b, c, d) between columns (the same color) indicate that treatment means are significantly
different at P<0.05 according to LSD test
4. Conclusions
Elevated doses of biochar with a higher
level of N fertilizer application significantly
increased the index of aggregate stability and
the proportion of water-stable macroaggregates, especially in the size fractions
from 3 to 2 mm. On the other hand, less water-stable macro-aggregates within the fraction from 0.5 to 0.25 mm were observed. Application of N fertilizer at a higher level significantly decreased the proportions of waterstable macro-aggregates within the size fractions of 3-2 mm. On the contrary, increasing
rates of N application increased the proportion
of water-stable aggregates with sizes from 0.5
to 0.25 mm. During the investigated period,
the proportion of larger macro-aggregates increased, while the proportion of smaller macro-aggregates 1-0.5 mm decreased.
Our findings show that the effect of SOM
in the WSA can be significantly enhanced.
Dosing biochar at higher rates resulted in a
higher content of soil organic carbon and labile carbon in the WSA. It can be concluded
that the higher content of SOM delivered
through biochar led to more WSAma and
WSAmi. The temporal dynamics of CL in
WSA is more pronounced than in SOC. The
content of CL measured within all size fractions of the WSA increased in all treatments.
105
Vladimir Simansky, et al./Vietnam Journal of Earth Sciences 40 (2018)
Water-stable aggregates are a significant
pool of SOM. The rising content of CL during
decomposition of biochar enhances the aggregation processes. Our findings confirmed the
fact that biochar is responsible for carbon sequestration within the WSA.
Acknowledgements
This study was partially supported by the
Slovak Research and Development Agency
under the project No. APVV-15-0160, and the
Scientific Grant Agency (VEGA) - project
No. 1/0604/16 and 1/0136/17.
References
Abiven S., Hund A., Martinsen V., Cornelissen G.,
2015. Biochar amendment increases maize root surface areas and branching: a shovelomics study in
Zambia. Plant Soil, 342, 1-11.
Agegnehu G., Bass A.M., Nelson P.N., and Bird M.I.,
2016. Benefits of biochar, compost and biochar–
compost for soil quality, maize yield and greenhouse
gas emissions in a tropical agricultural soil. Sci. Tot.
Environ., 543, 295-306.
Angers D.A., Samson N., Legere A., 1993. Early changes in water-stable aggregation induced by rotation
and tillage in a soil under barley production. Can. J.
Soil Sci., 73, 51-59.
Atkinson Ch.J., Fitzgerald J.D., Hipps N.A., 2010. Potential mechanisms for achieving agricultural benefits from biochar application to temperate soils: a review. Plant Soil, 337, 1-18.
Balashov E., Buchkina N., 2011. Impact of short- and
long-term agricultural use of chernozem on its quality indicators. Int. Agrophys., 25, 1-5.
Barrow C.J., 2012. Biochar: potential for countering
land degradation and for improving agriculture.
Appl. Geogr., 34, 21-28.
Barthes B.G., Kouakoua E.T., Larre-Larrouy M.C., Razafimbelo T.M., De Luca E.F., Azontonde A., Neves
C.S.V.J., De Freitas P.L., Feller C.L., 2008. Texture
and sesquioxide effects on water-stable aggregates
and organic matter in some tropical soils. Geoderma,
143, 14-25.
106
Benbi D.K., Brar K., Toor A.S., Sharma S., 2015. Sensitivity of labile soil organic carbon pools to long-term
fertilizer, straw and manure management in ricewheat system. Pedosphere, 25, 534-545.
Benbi D.K., Brar K., Toor A.S., Singh P., Singh H.,
2012. Soil carbon pools under poplar-based agroforestry, rice-wheat, and maize-wheat cropping systems
in semi-arid India. Nutr. Cycl. Agroecosys., 92,
107-118.
Blanco-Canqui H., Lal L., 2004. Mechanisms of carbon
sequestration in soil aggregates. Crit. Rev. Plant
Sci., 23, 481-504.
Brevik E.C., Cerda A., Mataix-Solera J., Pereg L., Quinton J.N., Six J., Van Oost K., 2015. The interdisciplinary nature of SOIL. SOIL, 1, 117-129.
Brodowski S., John B., Flessa H., Amelung W., 2006.
Aggregate-occluded black carbon in soil. Eur. J. Soil
Sci., 57, 539-546.
Bronick C.J., Lal R., 2005. The soil structure and land
management: a review. Geoderma, 124, 3-22.
Chenu C., Plante A., 2006. Clay-sized organo-mineral
complexes in a cultivation chronosequece: revisiting
the concept of the “primary organo-mineral complex”. Eur. J. Soil Sci., 56, 596-607.
Dziadowiec H., Gonet S.S., 1999. Methodical guidebook for soil organic matter studies. Polish Society
of Soil Science, Warszawa, 65p.
Elliott E.T., 1986. Aggregate structure and carbon, nitrogen, and phosphorus in native and cultivated
soils. Soil Sci. Soc. Am. J., 50, 627-633.
Fischer D., Glaser B., 2012. Synergisms between compost and biochar for sustainable soil amelioration,
In: Kumar S. (ed.): Management of Organic Waste,
In Tech Europe, Rijeka, 167-198.
Glaser B., Lehmann J., Zech W., 2002. Ameliorating
physical and chemical properties of highly weathered soils in the tropics with charcoal - a review.
Biol. Fertil. Soils., 35, 219-230.
Heitkotter J., and Marschner B., 2015. Interactive effects
of biochar ageing in soils related to feedstock, pyrolysis temperature, and historic charcoal production. Geoderma, 245-246, 56-64.
Herath H.M.S.K., Camps-Arbestain M., Hedley M.,
2013. Effect of biochar on soil physical properties in
Vietnam Journal of Earth Sciences, 40(2), 97-108
two contrasting soils: an Alfisol and an Andisol. Geoderma, 209-210, 188-197.
Hillel D., 1982, Introduction to soil physics. Academic
Press, San Diego, CA , 364 p.
Chenu C., Plante A., 2006. Clay-sized organo-mineral
complexes in a cultivation chronosequence: revisiting the concept of the “primary organo-mineral
complex”. Eur. J. Soil Sci., 56, 596-607.
IUSS Working Group WRB., 2014. World reference
base for soil resources 2014. International soil classification system for naming soils and creating legends
for soil maps. World Soil Resources Reports, 106,
FAO, Rome., 112p.
Jeffery S., Verheijen F.G.A., Van der Velde M., Bastos
A.C., 2011. A quantitative review of the effects of
biochar application to soils on crop productivity using meta-analysis. Agr. Ecosys. Environ., 144,
175-187.
Jien S.H., Wang Ch.S., 2013. Effects of biochar on soil
properties and erosion potential in a highly weathered soil. Catena, 110, 225-233.
Kammann C., Linsel S., Goßling J., Koyro H.W., 2011.
Influence of biochar on drought tolerance of Chenopodium quinoa Willd and on soil-plant relations.
Plant Soil, 345, 195-210.
Kodesova R., Nemecek K., Zigova A., Nikodem A., Fer
M., 2015. Using dye tracer for visualizing roots I
pact on soil structure and soil porous
system. Biologia, 70, 1439-1443.
Krol, A., Lipiec, J., Turski, M., J. Kuoe, 2013. Effects
of organic and conventional management on physical properties of soil aggregates. Int. Agrophys., 27,
15-21.
Kurakov A.V., Kharin S.A., 2012. The Formation of
Water-Stable Coprolite Aggregates in SoddyPodzolic Soils and the Participation of Fungi in This
Process. Eur. Soil Sci., 45, 429-434.
Loginow W., Wisniewski W., Gonet S.S., Ciescinska B.,
1987. Fractionation of organic carbon based on susceptibility to oxidation. Pol. J. Soil Sci., 20, 47-52.
Lynch, J.M., and E. Bragg, 1985. Microorganisms and
soil aggregate stability. Adv. Soil Sci., 2, 133-171.
Munkholm L.J., Schjonning P., Debosz K., Jensen H.E.,
Christensen B.T., 2002. Aggregate strength and mechanical behaviour of a sandy loam soil under long-
term fertilization treatments. Eur. J. Soil Sci., 53,
129-137.
Paradelo R., Van Oort F., Chenu C., 2013. Waterdispersible clay in bare fallow soils after 80 years of
continuous fertilizer addition. Geoderma, 200-201,
40-44.
Purakayastha T.J., Kumari S., Pathak H., 2015. Characterisation, stability, and microbial effects of four biochars produced from crop residues. Geoderma,
239-240, 293-303.
Rees F., Germain C., Sterckeman T., Morel J.L., 2015.
Plant growth and metal uptake by a nonhyperaccumulating species (Lolium perenne) and a
Cd-Zn hyperaccumulator (Noccaea caerulescens) in
contaminated soils amended with biochar. Plant
Soil, 395, 57-73.
Saha D., Kukal S.S., Sharma S., 2011. Land use impacts
on SOC fractions and aggregate stability in typic
Ustochrepts of Northwest India. Plant Soil, 339,
457-470.
Six J., Bossuyt H., Degryze S., Denef K., 2004. A history of research on the link between (micro)aggregates, soil biota, and soil organic matter
dynamics. Soil Till. Res., 79, 7-31.
Six J., Elliott E.T., Paustian K., 2000. Soil macroaggregate turnover and microaggregate formation: A
mechanism for C sequestration under no-tillage agriculture. Soil Biol. Biochem., 32, 2099-2103.
Soinne H., Hovi J., Tammeorg P., Turtola E., 2014. Effect of biochar on phosphorus sorption and clay soil
aggregate stability. Geoderma, 219-220, 162-167.
Simansky V., 2013. Soil organic matter in water-stable
aggregates under different soil management practices in a productive vineyard. Arch. Agron. Soil Sci.,
59(9), 1207-1214.
Simansky V., Jonczak J., 2016. Water-stable aggregates
as a key element in the stabilization of soil organic
matter in the Chernozems. Carp. J. Earth Environ.
Sci., 11, 511-517.
Simon T., Javurek M., Mikanova O., Vach M., 2009.
The influence of tillage systems on soil organic matter and soil hydrophobicity. Soil Till, Res., 105,
44-48.
Tiessen H., Stewart J.W.B., 1988. Light and electron
microscopy of stainedmicroaggregates: the role of
107
Vladimir Simansky, et al./Vietnam Journal of Earth Sciences 40 (2018)
organic matter and microbes in soil aggregation. Biogeochemistry, 5, 312-322.
Tisdall J.M., Oades J.M., 1980. The effect of crop rotation on aggregation in a red-brown earth. Austr. J.
Soil Res., 18, 423-433.
Vadjunina A.F., Korchagina Z.A., 1986. Methods of
Study of Soil Physical Properties. Agropromizdat,
Moscow, 415p.
Vaezi A.R., Sadeghi S.H.R., Bahrami H.A., Mahdian
108
M.H., 2008. Modeling the USLE K-factor for calcareous soils in northwestern Iran. Geomorphology,
97, 414-423.
Von Lutzow M., Kogel-Knabner I., Ekschmitt K.,
Matzner E., Guggenberger G., Marschner B., Flessa
H., 2006. Stabilization of organicmatter in temperate
soils:mechanisms and their relevance under different
soil conditions a review. Eur. J. Soil Sci., 57,
426-445.