Land cover mapping in yok don national park, central highlands of viet nam using landsat 8 OLI images VJES 39
Bạn đang xem bản rút gọn của tài liệu. Xem và tải ngay bản đầy đủ của tài liệu tại đây (569.71 KB, 14 trang )
Vietnam Journal of Earth Sciences, 39(4), 393-406, DOI: 10.15625/0866-7187/39/4/10773
Vietnam Academy of Science and Technology
(VAST)
Vietnam Journal of Earth Sciences
/>
Land cover mapping in Yok Don National Park, Central
Highlands of Viet Nam using Landsat 8 OLI images
Nguyen Viet Luong1,2*, Ryutaro Tateishi2 , Akihiko Kondoh 2 , Ngo Duc Anh 4 , Nguyen Thanh
Hoan 3 , Luu The Anh 3
1
Remote Sensing Application Department, Space Technology Institute, Vietnam Academy of Science and
Technology, 18 Hoang Quoc Viet str., Cau Giay dist., Hanoi, Vietnam
2
Center for Environmental Remote Sensing, Chiba University, 1-33 Yayoi-cho, Inage-ku, Chiba 2638522, Japan
3
Institute of Geography, Vietnam Academy of Science and Technology, 18 Hoang Quoc Viet str.,
Cau Giay dist., Hanoi, Vietnam
4
Vietnam National Space Center, Vietnam Academy of Science and Technology, 18 Hoang Quoc Viet str.,
Cau Giay dist., Hanoi, Vietnam
Received 27 September 2016. Accepted 29 September 2017
ABSTRACT
Over the past four decades, remote sensing has more useful and effective contributions in the classification, mapping of land cover, forest cover map. Out of these achievements, there are still limitations in the application, especially in the tropical region, because of the diversity and abundance of land cover objects, of course including tropical
forests, where are the vegetation status varies due to the seasons of the year. In this study, we selected Landsat 8 satellite imagery from both dry and rainy seasons for the purpose of building detailed land cover maps of Yok Don National Park, Central Highlands of Vietnam where has two major forest types (a) deciduous broadleaf forest and (b)
evergreen broadleaf forest. The land cover mapping was based on supervised classification approach. The results of
forest cover area showed that total Evergreen broad-leaved forests (rich, medium and poor) area are 25,578 ha
(22.14%) and total Dry open dipterocarps forests (rich, medium and poor) area are 88,435 ha (76.54%), and another
object is 1,531.86 ha (1.33%). The detailed land cover map with the 15 m resolution provided and is useful for forest
management in the study area. The results of the assessment accuracy of the land cover mapping showed that 88.37%
of overall accuracy, 89.35% of producer accuracy, and 90.60% of user’s accuracy.
Keywords: Landsat 8 OLI; Land cover mapping; Central Highlands; Vietnam.
©2017 Vietnam Academy of Science and Technology
1. Introduction1
Detailed and accurate information of forest
cover is important and necessary for science,
management, conservation, reporting, and
helps the policy makers to understand the en
*
Corresponding author, Email:
vironmental change dynamics to ensure sustainable development of forest resources
(Gómez et al., 2016). The discrimination and
mapping of the forest cover have been advanced with remotely sensed satellite technology from local to the global level (Patenaude
et al., 2005; Annunzio et al., 2010; Tateishi et
393
Nguyen Viet Luong, et al./Vietnam Journal of Earth Sciences 39 (2017)
al., 2014). Forest is a dynamic feature on the
land surface. As true for other land cover, forests to change in time and space. The changes
may be positive as regrowth i.e., medium forest to dense forest, poor forest to medium and
dense forest etc. or negative as deforestation
i.e., logging, shifting cultivation, forest fire,
the construction of buildings, urban expansion
etc. According to FAO report on global forest
resource assessment (FAO, 2015), global forest area fell by 3% from 4128 M ha (1990) to
3999 M ha (2015). The rate of net forest loss
between 2010 and 2015 was half that in the
1990s. Net forest loss was mainly in the tropics; temperate forest area has increased. Rates
of forest loss are highest in low-income countries (Keenan et al., 2015), and deforestation
is continuing everywhere (Busch and Engelmann, 2015; FAO, 2015).
Today, optical remote sensing has become
no stranger to the managers, scientists in areas
such as forests, ecology, natural resources and
the environment. Since 1972, the Landsat
mission was first launched. The Landsat mission measured the Earth reflectance. Satellite
image classification was done using the reflectance statistics for individual pixels. So
far, optical and satellite imagery has proved
its effectiveness in the establishment of resource maps, land use maps, forest cover
maps, from the local to the global level.
Forest management is always required to
obtain a map showing the details, high accuracy, and update information about the forest
cover. Further detailed information on the forest is also well served for in-depth studies on
biodiversity, ecology, habitat (Turner et al.,
2003, Pham Ngoc Thach et al., 2014; Li et al.,
2014). However, at present, the detailed land
cover map is lacking in many where, even
high conservation value forests such as national parks, etc., have caused many difficulties in forest management (Giri et al., 2003;
Ridder, 2007; Verburg et al., 2011; Luong et
al., 2015). The main causes for such a situation are the lack of funds for implementation,
394
the satellite imagery data and the lack of
human resources with remote sensing
knowledge working at forest management
agencies (Luong et al., 2015).
Landsat 8 satellite sensor is part of the
Landsat Data Continuity Mission was successfully launched on February 11, 2013,
from Space Launch Complex-3, Vandenberg
Air Force Base in California and will join
Landsat 7 satellite in orbit. Landsat 8 satellite
has two main sensors: the Operational Land
Imager (OLI) and the Thermal Infrared Sensor
(TIRS). OLI will collect images using nine
spectral bands in different wavelengths of visible, near-infrared, and shortwave light to observe a 185 kilometer (115 miles) wide swath
of the Earth in 15-30 meter resolution covering wide areas of the Earth's landscape while
providing sufficient resolution to distinguish
features like urban centers, farms, forests and
other land uses (NASA, 2017). One thing is
important that satellite imagery data from
Landsat 8 is completely free for users on a
worldwide. There have been several studies
using Landsat 8 for land cover classification
and monitoring land cover and showed has the
good potential (Roy et al., 2014; Jia et al.,
2014; Dinh, 2016; Firoozynejad et al., 2017).
Currently, there is three main methodologies and dissemination in the use of image
classification in remote sensing technology to
classify vegetation as (i) Unsupervised image
classification; (ii) Supervised image classification and (iii) Object-based image analysis.
In this study, we used the supervised image
classification approach. The supervised classification usually gives the best results, and the
steps including select training areas, generate
the signature file and classify.
The objective of this research was to use
image data from the Landsat 8 satellite for developing the more detailed land cover map in
Yok Don National Park, Central Highlands in
Vietnam, where there are two seasons the dry
season and the rainy season, and has two major forest types (a) deciduous broadleaf forest
and (b) evergreen broadleaf forest.
Vietnam Journal of Earth Sciences, 39(4), 393-406
2. Study area and data
2.1. Study area
The Yok Don National Park in the Central
Highlands region lies between 12°45’ 13°10’ north latitude and 107°29’-107°48’
east longitude and it is the largest national
park in Vietnam.
Thai Van Trung, 1998; Phung Ngoc Lan et
al., 2006, Nguyen Nghia Thin et al., 2008
have classified the forest of Yok Don National
Park into two major types of forest: (a) deciduous broadleaf forest, and the dominant tree
species in the deciduous broadleaf forest are
Dipterocarpus tuberculatus, Dipterocarpus
obtusifolius, Terminalia tomentosa, and
Shorea obtuse; (b) evergreen broadleaf forest,
and
the
evergreen
broadleaf
forest
mainly comprises of Michelia mediocris,
Cinamomum iners, Syzygium zeylanicum,
Syzygium wightianum, Garruga pierrei, Gonocaryum lobbianum, Schima superba,
Camellia
assamica,
and
Lithocarpus
fenestratus.
Soil type of the forest inside the park has
diverse types of soils including brown, redyellow, and black soils (MARD, 2010). The
topography of this park contains relatively
plain topography and is located at an altitude
of 200-300 m above sea level (Nguyen Xuan
Canh et al., 2009).
The climate of this region is tropical monsoon type which has a well-defined dry season
between October and April, and typical rainy
season between May and November. The
mean annual rainfall is 1540 mm, and mean
monthly temperature is around 25°C (Nguyen
Xuan Canh et al., 2009).
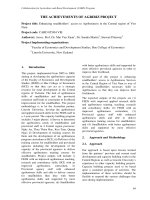
The location map of the Yok Don National
Park is shown in Figure 1.
Figure 1. Location map and sample plot positions based on Landsat 8 composite imagery of the study area (red point
are sample plots for training and yellow points are sample plots for validation).
The boundary of Yok Don National Park is shown in the black polygon in the right image
2.2. Satellite data
The study has used the satellite imagery of
Landsat 8 Operational Land Imager (OLI) in
February 2014 (dry season) and October
2015 (rainy season). The resolution of band 4
(wavelength: 0.65-0.67) and band 5 (wav
395
Nguyen Viet Luong, et al./Vietnam Journal of Earth Sciences 39 (2017)
length: 0.85-0.88) is 30 meters, band
8/Panchromatic (wavelength: 0.5-0.68) is 15
meters. The reason for the choice of two
time-scene image, that, due to the characteristics of the study area includes two types of
forest are Evergreen broad-leaved forest and
Dry open dipterocarps forest. Therefore, I
chose two scenes images at two different
times (dry season in 2014 and rainy season in
2015). The Landsat 8 in the dry season to
distinguish between and evergreen forests of
deciduous forest. Both of Landsat 8 images
used in this study area is cloud free. The
technical details of the satellite data used in
the present study are shown in Table 1 and
Figure 2.
Table 1. Landsat 8 OLI data used in this research
No
ID
Observation date
1
LC81240512015289LGN00
2015-10-16
2
LC81240512014030LGN00
2014-01-30
Path/ Row
124/051
124/051
Band used
B4, B5, B6, B8
B4, B5, B6, B8
Season
Rainy
Dry
Figure 2. Landsat 8 OLI used in this study: (a) Dry season in 2014 (b) Rainy season in 2015
3. Method for land cover mapping
3.1. Land cover classification system
In this study we have applied to the land
cover classification systems of the UNESCO
(1973) and Thai Van Trung (1998) for the
classification into 2 main classes of land cover
and then used the Circular No.34/TT-BNN
issued by Ministry of Agriculture and Rural
Development (MARD) of Vietnamese government (2009) for the detailed classification
into 6 classes of forest cover with the rich forest comprised a forest with a standing wood
volume over 301 m3.ha-1, the medium forest
with 101-300 m3.ha-1 and the poor forest included the forest with 0-100m3.ha-1. Although
according to the Circular 34, there is a very
396
rich forest class with wood volume over
300m3.ha-1, we have not classified it. Because,
this kind of class area is not much, and there is
no appearance in Dipterocarps forest in this
study area, therefore, we have included rich
forest and very rich forest, and called them rich
forest class. The forest in this ecosystem zone
was classified into 6 classes such as (1) Evergreen broad-leaved rich forest (EB rich forest),
(2) Evergreen broad-leaved medium forest (EB
medium forest), (3) Evergreen broad-leaved
poor forest (EB poor forest), (4) Dry open dipterocarps rich forest, (5) Dry open dipterocarps
medium forest (DD medium forest) and (6)
Dry open dipterocarps poor forest (DD poor
forest) (Luong et al., 2015). According to
UNESCO (1973), other land cover categories
Vietnam Journal of Earth Sciences, 39(4), 393-406
may be identified as- (7) Other land cover
(mainly composed of woody tree from 0.5
to 5 m tall); scrubland, (most of the individual shrubs not touching each other, often with
a grass stratum); Thicket (individual shrubs
interlocked and barren land) and (8) Waterbody. The detailed forest cover’s classification
is shown in Table 2 (Luong et al., 2015).
Table 2. Classification of forest cover for the study area (Luong et al., 2015)
UNESCO (1973), Trung (1998) and Luong et al., (2015)
Circular No. 34/TT-BNN issued by MARD (2009)
1. EB Rich forest
Evergreen broad-leaved forest (EB forest)
2. EB Medium forest
3. EB Poor forest
4. DD Rich forest
Dry open dipterocarps forest (DD forest)
5. DD Medium forest
6. DD Poor forest
Other land cover
7. Other land cover
Water body
8. Water body
3.2. Pre-processing satellite data
The method of satellite images processing
in this study includes: Geometric correction,
Image to map rectification by terrain map
sheet on scale 1:50,000, and image fusion, in
there: panchromatic sharpening is an image
fusion method in which high-resolution panchromatic data is fusion with lower resolution
multispectral data to create a colorized highresolution dataset (Laben et al., 2000). The
result of before and after the panchromatic
sharpening of Landsat 8 is shown in Figure 3
below:
Figure 3. An example of panchromatic sharpening: (a) Original color image-30 m resolution,
(b) Panchromatic image-15 m resolution, (c) Pan-sharpened color image-15 m resolution
397
Nguyen Viet Luong, et al./Vietnam Journal of Earth Sciences 39 (2017)
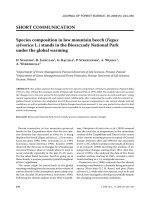
The NDVI image in dry season makes up
from Red band (band 4) and Near Infrared
band (band 5) from Landsat 8 OLI satellite.
From Landsat 8 in dry season can be clearly
distinguished between an evergreen forest of
deciduous forest based on NDVI value, from
the NDVI image (Figure 4), the green color is
evergreen forest with the NDVI value from
0.0 to 1.0, and yellow color is mainly deciduous forest with the NDVI value from -1.0 to 0.
The difference between the two major forest
types within the study area (a) deciduous
broadleaf forest and (b) evergreen broadleaf
forest during the dry season. Photos were
taken in the dry season (April 2015),
Figure 5.
Figure 4. NDVI image of Yok Don National Park in dry season
(a)
(b)
Figure 5. Photos of two major forest types (a) deciduous broadleaf forest and (b) evergreen broadleaf forest
398
Vietnam Journal of Earth Sciences, 39(4), 393-406
3.3. Reflection spectrum analysis
Develop a reflectance spectral value graph
to denote different forest objects (rich, medium
and poor) in the set of surveyed samples. That
is, at each of the sample plot sites, we have
created a square sized according to the sample
plot size. Sample plots were selected into 3
forest categories according to the field calculation: rich forest, medium forest, poor forest.
(a) Rich forest
These squares will then be overlaid on the
Landsat 8 satellite image to calculate the spectral value. For each set of sample plots (rich,
medium, poor), we will create a "mask" class
to calculate the spectral value using the
"Compute statistics" tool on ENVI software.
The spectral value on the histogram is calculated for all sample plot of the same forest
type. See an example in Figure 6.
(b) Medium forest
Figure 6. Spectrum reflected from Landsat 8 satellite image: (a) Rich forest; (b) Medium forest and (c) Poor forest
3.4. Field work
(c) Poor forest
A GPS Garmin-GPSMAP87S instrument
was used to determine the center position of
each sample plot. We carefully have chosen
the sample plot position with a homogenous
area of the forest cover and at least 100 m distant from other features such as trails, roads,
Field survey is important for collecting in
situ data required for accurate analysis of the
satellite based estimates. We organized an intensive field campaign during April 2015 to
collect the ground truth data. In total, there are
110 sample plots were established in the study
area. The size of the sample plots is 1 ha (100 ×
100 m). We measured the diameter at breast
height 1.3 m (D1.3) using Criterion RD 1000
laser instrument and height (H) using Trupulse
360 Laser height instrument.
streams, rivers, water bodies, and other features. The authors also recorded the types of
tree species during the field inventory following the Vietnam Flora book. All species were
recorded and the taxonomy used was the Flora
of Vietnam book (Hoang Pham, 1999-2000).
399
Nguyen Viet Luong, et al./Vietnam Journal of Earth Sciences 39 (2017)
The distribution of sample plot positions are
shown in Figure 1, and the sample plot distribution at each class of forest was used in the
classification as shown in Table 3.
Table 3. The sample plot distribution used in the classification (traing data)
Total sample
No.
Class
plots
1 Rich forest (> 300 m3.ha-1)
18
2 Medium forest (101 - 200 m3.ha-1)
71
3
-1
3 Poor forest (0 - 100 m .ha )
21
Total
110
3.5. Supervised classification (Maximum
likelihood)
Supervised classification can be defined
normally as the process of the sample of
known identity to classify pixels of unknown
identity. Samples of known identity are those
pixels located within training areas. Supervised classification procedures are the essential analytical tools used for the extraction of
quantitative information from remotely sensed
image data. The user closely controls the supervised classification method. An important
assumption in supervised classification usually adopted in remote sensing is that each spectral class can be described by a probability
distribution in multispectral space, it also is
important to have a set of desired classes in
mind, and then create the appropriate signatures from the data. You must also have some
way of recognizing pixels that represent the
classes that you want to extract.
Supervised classification is usually appropriate when we want to identify relatively few
and detailed classes of object, when we have
selected training sites that can be verified with
ground truth data, or when we can identify
distinct, homogeneous regions that represent
each class. On the other hand, if we want the
classes to be determined by spectral distinctions that are inherent in the data so that you
can define the classes later, then the application is better suited to unsupervised training.
Use unsupervised training to define many
400
classes easily, and identify classes that are not
in contiguous, easily recognized regions. The
basic steps involved in typical supervised
classification procedure as; (i) Define signatures, (ii) Evaluate signatures, and (iii) Process a supervised classification.
In this process, we select pixels that represent land cover features that we recognize,
from ground truth data (sample plots system)
in Yok Don National Park with the eight classes are (Luong et al., 2015);
Class1 - Evergreen broad-leaved rich forest (EB rich forest).
Class 2 - Evergreen broad-leaved medium
forest (EB medium forest).
Class 3 - Evergreen broad-leaved poor forest (EB poor forest).
Class 4 - Dry open dipterocarps rich forest
(DD rich forest).
Class 5 - Dry open dipterocarps medium
forest (DD medium forest).
Class 6 - Dry open dipterocarps poor forest
(DD poor forest), and
Class 7 - Other land cover and.
Class 8 - Waterbody.
The software used in this study for maximum likelihood is ERDAS image 2014 and
for editor maps used ArcGIS 10.2 software.
3.6. Accuracy assessment
The accuracy refers to the success of estimating the true value of quality or parameter
and can be obtained when all the units in the
population are measured and when measurements are free of many sorts of biases. The
best way to test the interpretation accuracy is
to select a sample of points and check the
classes as appearing on the map against the
ground.
The independent validation sites as the
second data set and will be used to assess the
classification accuracy. The locations used for
validation will not be the same as those used
for classification training to avoid potential
positive bias in the accuracy assessment. The
Vietnam Journal of Earth Sciences, 39(4), 393-406
report will include an error matrix for all forest cover classes and other class. The error
matrix will be used to derive the producer’s
and user's accuracy and the Kappa statistic for
each class and overall accuracy. The accuracy
report for the final classification is shown the
Table 6, section 4.2 of this paper.
4. Results
4.1. The parameter of structure and biomass
of forest
The results from the sample plots were
used to calculate the parameters of structure
and woody volume of forest cover at Yok Don
National Park for the current state of six forest
cover types including (1) Evergreen broadleaved rich forest (EB rich forest); (2) Evergreen broad-leaved medium forest (EB medium forest); (3) Evergreen broad-leaved poor
forest (EB poor forest); (4) Dry open dipterocarps rich forest (DD rich forest); (5) Dry
open dipterocarps medium forest (DD medium forest) and (6) Dry open dipterocarps poor
forest (DD poor forest). The parameters of the
structure of forest cover including the diameter of breast height at 1.3 m position (D1.3 >5
cm), height at from bottom to top of the wood
tree (H), the density of wood tree/ha (N/ha).
The woody volume (V) of each tree was
calculated by using the Equation (1) (FAOFRA, 2000; Vo Van Hong et al., 2006) which
uses the basal area of a tree at breast height
(G) in square meters (m2), total tree height
(H) in meters (m) and the conversion factor
(F). It is worthful to mention that the wood
volume (V) in Equation (1) (Vo Van Hong et
al., 2006).
V=G×H×F
(1)
In Equations (1):
V is the woody volume (m3)
G is the basal area of tree at breast height
1.3m in squared meters (m2)
H is the total tree height (H) in meters (m),
and
F is the conversion factor (F).
The results are shown in the Table 4.
Table 4. The parameters of the structure and woody volume of forest
H (m)
No.
Class
D1.3 (cm)
1
EB rich forest
29.99
13.78
2
EB medium forest
17.21
10.29
3
EB poor forest
12.51
6.17
4
DD rich forest
26.38
13.78
5
DD medium forest
17.62
11.03
6
DD poor forest
13.18
7.79
4.2. Land cover mapping
The results of the land cover map based on
supervised classification of Landsat 8 OLI,
2015 shown that the EB rich forest 7.79 thousand ha (6.74%), EB medium forest area is
13.48 thousand ha (11.67%), EB poor forest
area is 3.72 thousand ha (3.72%), DD rich
forest area is 16.69 thousand ha (14.45%) DD
medium forest area is 50.09 thousand ha
(46.05%), DD poor forest area is 21.63 thousand ha (18.73%), Other land cover area is
829.82 ha (0.72%) and Water body area is 701
ha (0.61%). The results of land cover mapping are shown in Table 5 and Figure 7.
N/ha (tree.ha-1)
777.63
938.50
580.00
802.46
1048.61
1172.90
V (m3.ha-1)
407.96
129.52
36.27
305.22
151.65
75.21
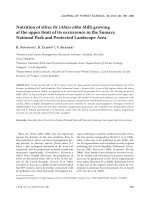
The results from Table 5 and Histogram 1
are shown that total area of evergreen broadleaved forests is 25,578 ha (22.14%) and the
total area of dry open dipterocarps forests are
88,435 ha (76.54%) and another object is
1,531.86 ha (1.33%). In there, medium forest
(both EB and DD forest) occupies the largest
area is > 55.03%, and followed by the poor
forest (both EB and DD forest) is 22.45% and
the rich forest (both EB and DD forest) is
21.19%. The final land cover map with the
15-m resolution provided and is useful for
forest management (Figure 7).
401
Nguyen Viet Luong, et al./Vietnam Journal of Earth Sciences 39 (2017)
We also used the 30 forest sample plots
provided by the Forest Inventory and Planning
Institute (FIPI, 2014) for estimating the accuracy of the classification method. The results
of the assessment accuracy are shown in Table 6 below:
The results of the assessment accuracy of
the land cover mapping in 2015 in Yok Don
National Park are shown 88.37% as overall
accuracy, 89.35% as producer accuracy and
90.60% as user’s accuracy. Although this research used satellite imagery from Landsat 8
OLI, however, the accuracy of the land cover
map was not much different when compared
to previous research also in this research area
and used images 2004, 2010 from SPOT 5
satellite with 10 m × 10 resolution (Luong et
al., 2015). Because, in this research, we used a
quality sample plots and nearly double that in
the previous research.
Table 5. Land cover area of Yok Don National Park in 2015
No.
Class name
Area (ha)
1
EB rich forest
7,790.38
2
EB medium forest
13,485.85
3
EB poor forest
4,301.92
Sub-Total
25,578.15
4
DD rich forest
16,699.52
5
DD medium forest
50,099.39
6
DD poor forest
21,636.60
Sub-Total
88,435.51
7
Other land cover
829.92
8
Water body
701.94
Total
115,545.51
Percent (%)
6.74
11.67
3.72
22.14
14.45
43.36
18.73
76.54
0.72
0.61
100.00
Histogram 1. Land cover area (%) in Yok Don National Park in 2015
We also compared the classification results
of this land cover map in this research with the
results of the biomass map, which was done by
the same author and the same study area
(Luong and et al., 2016). If we put a regulation,
biomass (Rich forest > 351 Mg. ha-1, Medium
402
forest from 151 - 350 Mg. ha-1, Poor forest
from 0-150 Mg.ha-1) and woody volume (Rich
forest > 301m3.ha-1, Medium forest from 101 300m3.ha-1, Poor forest from 0-100m3.ha-1).
The results of the comparison between two
maps about forest cover area/biomass area have
Vietnam Journal of Earth Sciences, 39(3), 393-406
shown that: Rich forest (21.20%/20.82%), Medium forest (55.03%/63.01%) and Poor forest
23.77%/16.17%). This comparison confirms
that: There was not much difference about area
from two maps and these results are
reliable.
Figure 7. Land cover map of Yok Don National Park in Central Highlands of Vietnam
403
Nguyen Viet Luong, et al./Vietnam Journal of Earth Sciences 39 (2017)
Table 6. Confusion matrixes for land cover classification of the Landsat 8 OLI data
Mapped class
EB rich forest
EB medium forest
EB poor forest
DD rich forest
DD medium forest
DD poor forest
Other land cover
Water body
Total
Producer' accuracy
Overall accuracy
EB rich
forest
3
EB medium EB poor
forest
forest
4
1
Ground truth
DD rich DD medium DD poor
forest
forest
forest
4
4
9
1
4
3
5
4
4
10
4
5
2
7
100.00
88.37
80.00
100.00
100.00
90.00
100.00
71.43
5. Conclusions
For developing a detailed forest cover
map, where the region is the tropical monsoon, along of the rainy season and the dry
season is distinctive, with evergreen and deciduous forests. The first: optical satellite data
from the dry season to help us accurately distinguish of evergreen forests and deciduous
forests. The results indicated that total Evergreen broad-leaved forests area are 25,578 ha
(22.14%) and total Dry open dipterocarps forests area are 88,435 ha (76.54%) and another
object is 1,531.86 ha (1.33%). The second: the
combined with optical satellite data from the
rainy season helps a detailed classification of
classes from the evergreen forest and the deciduous forests. The detailed results indicated
that Evergreen broad-leaved rich forest is 7.79
thousand ha (6.74%), Evergreen broad-leaved
medium forest area is 13.48 thousand ha
(11.67%), Evergreen broad-leaved poor forest area is 3.72 thousand ha (3.72%), Dry
open dipterocarps rich forest area is 16.69
thousand ha (14.45%), Dry open dipterocarps
medium forest area is 50.09 thousand ha
(46.05%), Dry open dipterocarps poor forest
area is 21.63 thousand ha (18.73%), another
land cover area is 829.82 ha (0.72%) and Waterbody area is 701 ha (0.61%). The results of
the assessment accuracy of the land cover
mapping showed that 88.37% of overall accu404
Other land Water
cover
body
1
5
6
83.33
Total
3
4
5
4
9
5
6
7
43
User accuracy
100.00
100.00
80.00
100.00
100.00
80.00
83.33
71.43
89.35
90.60
racy, 89.35% as producer accuracy, and
90.60% as user’s accuracy. The detailed land
cover map with the 15-m resolution provided
and is useful for forest management for the
study area. This research concluded that: for
the detailed classification of forest cover,
where there are the rainy season and the dry
season, and forest cover area has included
both evergreen forest and deciduous forest,
the choice of optical satellite data from both
seasons is important and necessary.
Acknowledgements
The authors are grateful to the project No.
VAST 01.03 15/16 from Vietnam Academy
of Science and Technology (VAST) and Japan
Society for the Promotion of Science (JSPS)
for financial support to this research. We
would like to thank USGS for providing
Landsat 8 OLI data for this study.
References
Busch J. and Engelmann J., 2015. The Future of Forests:
Emissions from Tropical Deforestation with and
without a Carbon Price, 2016-2050. CGD Working
p411. Washington, DC: Center for Global
Development, 42p.
/>Circular 34/TT-BNN issued by Ministry of Agriculture
and Rural Development of Vietnam (MARD) in
2009. Quy định tiêu chí xác định và phân loại rừng
(in Vietnamese). Regulation on criteria for identify-
Vietnam Journal of Earth Sciences, 39(3), 393-406
ing and classifying forest (in English) - Translated
by Nguyen Viet Luong.
D’Annunzio R., Lindquist E., MacDicken K.G., 2014.
Global forest land-use change from 1990 to 2010: an
update to a global remote sensing survey of forests.
Food and Agriculture Organization of the United
Nations. Report from FAO and European Commission Joint Research Centre, 6p.
Nguyen Dinh Duong, 2016. Automated Classification of
Land Cover Using Landsat 8 Oli Surface Reflectance Product and Spectral Pattern Analysis Concept-Case Study in Hanoi, Vietnam. International
Archives of the Photogrammetry, Remote Sensing &
Spatial Information Sciences, 41.
FAO, 2015. Global Forest resources assessment 2015.
How are the world’s forests changing? FAO,
Rome, 56p.
Firoozynejad M., Torahi A.A., 2017. Evaluation of
IRS1D-LISS-III and Landsat 8-OLI Images for
Mapping in Maroon Riparian Forest. Iran. J Geogr
Nat Disast, 7(198), 2167-0587.
Giri C., Defourny P., Shrestha S., 2003. Land cover
characterization and mapping of continental Southeast Asia using multi-resolution satellite sensor data.
International Journal of Remote Sensing, 24(21),
4181-4196.
Gómez C., White J.C., Wulder M.A., 2016. Optical remotely sensed time series data for land cover classification: A review. ISPRS Journal of Photogrammetry and Remote Sensing, 116, 55-72.
Jia K., Wei X., Gu X., Yao Y., Xie X., Li B., 2014. Land
cover classification using Landsat 8 operational land
imager data in Beijing, China. Geocarto International., 29(8), 941-951.
Keenan R.J., Reams G.A., Achard F., De Freitas J.V.,
Grainger A., Lindquist E., 2015. Dynamics of global
forest area: results from the FAO global forest resources assessment 2015. Forest Ecology and Management, 352, 9-20.
Laben C.A., Brower B.V., 2000. U.S. Patent No.6, 011,
875. Washington, DC: U.S. Patent and Trademark
Office.
Li C., Wang J., Wang L., Hu L., Gong P., 2014. Comparison of classification algorithms and training
sample sizes in urban land classification with
Landsat thematic mapper imagery. Remote Sensing, 6(2), 964-983.
Nguyen Viet Luong, Tateishi R., Nguyen Thanh Hoan,
To Trong Tu, 2015. Forest Change and Its Effect on
Biomass in Yok Don National Park in Central Highlands of Vietnam Using Ground Data and
Geospatial Techniques. Advances in Remote Sensing, 4(2), 108-118.
Nguyen Viet Luong, Ryutaro Tateishi, Akihiko Kondoh,
Ram C. Sharma, Nguyen Thanh Hoan, To Trong Tu,
and Ho Tong Minh Dinh, 2016. Mapping
tropical forest biomass by combining ALOS-2,
Landsat 8, and field plots data. Land 31, 5(4).
Doi:10.3390/land5040031.
NASA, 2017. />Nguyen Ngoc Thach, et al., 2014. Using NDVI differencing for mapping of depterocarp forest in Savanket province, Lao PDR. ACRS 20-08-2014.
Nguyen Nghia Thin, et al., 2008. Update Information of
Flora and Plant’s Resources of Yok Don National
Park, DakLak Province in 2008. Report.
Nguyen Xuan Canh, et al., 2009. Report on Conservation Planning and Sustainable Development of Yok
Don National Park in 2010-2020. Ministry of Agriculture and Rural Development of Vietnam: Hanoi,
Vietnam.
Patenaude G., Milne R., Dawson T.P., 2005. Synthesis
of remote sensing approaches for forest carbon estimation: reporting to the Kyoto Protocol. Environmental Science & Policy, 8(2), 161-178.
Phung Ngoc Lan, et al., 2006. Natural forest ecosystems
Viet Nam. Ministry of Agriculture and Rural Development of Vietnam (MARD). Technical report, 95p.
Ridder R.M., 2007. Global forest resources assessment
2010. Options and recommendations for a global
remote sensing survey of forests. FAO For. Resour.
Assess. Programme Work. Pap, 141.
Roy D.P., et al., 2014. Landsat-8: Science and product
vision for terrestrial global change research. Remote
sensing of Environment, 145, 154-172.
Tateishi R., Nguyen Thanh Hoan, Kobayashi T., Alsaaideh B., Tana G., D. Xuan Phong, 2014. Production of Global Land Cover Data-GLCNMO2008.
Journal of Geography and Geology, 6(3), 99.
Doi:10.5539/jgg.v6n3p99.
405
Nguyen Viet Luong, et al./Vietnam Journal of Earth Sciences 39 (2017)
Thai Van Trung, 1998. Chapter IV. In The Tropical Forest Ecosystem in Vietnam, Science and Technics
Publishing House, Hanoi, 291p.
Turner W., Spector S., Gardiner N., Fladeland M., Sterling E., Steininger M., 2003. Remote sensing for biodiversity science and conservation. Trends in ecology & evolution, 18(6), 306-314.
UNESCO Paris, 1973. International classification and
mapping of vegetation. Published by the United
406
Nations Educational, Scientific and Cultural Organization. ISBN 92-3-001046-4 LC No. 72-96442, 102,
13-37.
Verburg P.H., Neumann K., Nol L., 2011. Challenges in
using land use and land cover data for global change
studies. Global Change Biology, 17(2), 974-989.
Vo Van Hong, et al., 2006. Handbook for Vietnam forest inventory. Ministry of Agriculture and Rural Development of Vietnam (MARD), 95p.