Utilization of seismic refraction data for the study of structure of bang hot water source, le thuy, quang binh VJES 38
Bạn đang xem bản rút gọn của tài liệu. Xem và tải ngay bản đầy đủ của tài liệu tại đây (1.15 MB, 16 trang )
Vietnam Journal of Earth Sciences Vol.38 (4) 394-409
Vietnam Academy of Science and Technology
Vietnam Journal of Earth Sciences
(VAST)
/>
Utilization of seismic refraction data for the study of
structure of Bang hot-water source, Le Thuy, Quang Binh
Tran Anh Vu*1,2 , Dinh Van Toan 1, Doan Van Tuyen 1, Lai Hop Phong1, Duong Thi Ninh 1,
Nguyen Thi Hong Quang1, Pham Ngoc Dat 1
P
P
P
P
P
P
P
P
P
P
P
P
P
1
Institute of Geological Sciences, Vietnam Academy of Science and Technology
P
P
2
Graduate University of Science and Technology, Vietnam Academy of Science and Technology
P
P
Received 01 June 2016. Accepted 10 December 2016
ABSTRACT
Study of the geological structural elements in the area of geothermal sources is important for identifying the
geothermal reservoir, the object is capable of energy production. This paper presents the preliminary results of the
structural study obtained by the seismic refraction data in the area of hot water spring Bang, Le Thuy, Quang Binh.
The exploration was carried out in 2014 by using 150 wireless Texan instruments produced by Refraction
Technology Company - USA and provided by the Institute of Earth Sciences, Academia Sinica, Taiwan. The data
were collected from 4 profiles, cutting several tectonic faults around the exposed hot water source. The seismic
signals were strong on the records of each instrument, especially the signals of refraction wave. The 2D seismic
tomographic technique is applied for data interpretation to create the velocity structural models from 4 observation
profiles. Based on the velocity structures, the area can be separated into three main structural layers, characterized
generally by three velocity ranges: 3,0-4,1 km/s; 4,2-5,1 km/s and 5,2-6,1 km/s, respectively.
The block separation by the faults of different size with the subsidence tendency from southwest to the northeast
parts of the region is apparently reflected in the seismic data obtained in this study. The narrow lower velocity vertical
structure detected inside the southern well-consolidated rock uplifted block away from the exposed hot water source
more than 2 km, under the sub meridian extension Quaternary structure probably related to the breaking up of the
bedrocks caused by the tectonic activity in the region. Perhaps, the object played a role as the thermal fluid channel in the
geological history time and is closely related to the geothermal reservoir predicted recently by magnetotelluric
investigations in this location.
Keywords: seismic refraction, 2D modeling, structure, geothermal Source Bang.
©2016 Vietnam Academy of Science and Technology
1. Introduction 1
F
0
P
T
3
Up to now the geothermal energy used in t
he World occupies a small portion in compari
T
3
T
3
T
3
T
3
T
3
T
3
T
3
T
3
T
3
T
3
T
3
son with the other types. Since geothermal ene
rgy is the renewable sources, much less affect
ed to the environmental pollution, it became t
he object of interest to develop in many countr
ies. The geothermal systems characterized by
T
3
T
1
7
T
1
7
T
3
T
3
T
3
T
3
T
3
T
3
T
3
T
3
T
3
T
3
T
3
T
3
T
3
T
3
T
3
T
3
T
3
T
3
T
3
T
3
Corresponding author, Email:
394
T
3
T
3
T
3
T
3
T
3
T
3
T
3
T
3
T
3
T
1
7
T
3
T
3
T
3
T
3
T
3
T
3
T
3
T
3
T
3
T
3
T
1
7
T
3
T
3
T
3
T
3
T
3
T
3
T
3
T
3
T
3
T
3
T
3
T
3
T
3
*
T
3
T
3
T
3
T
3
T
1
7
T
1
7
T
3
T
3
T
1
7
T
1
7
T
3
T
3
T
3
T
3
T
3
T
3
T
3
T
3
T
3
T
3
T
3
T
3
T
3
T
3
T
3
T
3
T
3
T
3
T
3
T
3
T
3
T
3
Tran Anh Vu, et al./Vietnam Journal of Earth Sciences 38 (2016)
reservoir structure capable of temperature sto
and
restoration
of
the
rage
geothermal regime can be used for generation
of electric energy. For this reason, the identifi
cation of geothermal reservoir and it’s related
parameters such as it’s distribution and dime
nsion is important (Honjas et. Al., 1997; Uruh
, 2001 ). Up to now most of the detected reser
voirs is located at the depth of
less than 1 km from the surface ( Doan Van T
uyen, et al. 2008), so the deep structures must
be investigated. Just several geophysical meth
ods, such as magnetotelluric and seismic inves
tigations can be used effectively for solving th
is problem. The magnetotelluric measurement
s are often applied for searching both the reser
voir structure and the source of heat supply, s
o the depth needs to be investigated in genera
l is more than 10 km. The seismic exploration
with the use of active source is mainly applied
to study the structures of the expected reservo
ir itself, which is mostly revealed at a depth ra
1
nge
4 km. Though more detail structural feature o
f the study area can be obtained by applying t
he seismic reflection method, but a complexi
ty of the local condition (strong topographical
separation, scattered population points), limit
ed budget and requirement of a dense network
of shot points do not allow us to realize the o
peration of this method. Since the seismic inv
estigations in this study aimed to provide mor
e information regarding the structures and tect
onic faults for fortified confidence of reservoir
existence prediction fulfilled by using the ma
gnetotelluric data, so the refraction method usi
ng wireless Texan instruments chosen for the
exploration is satisfied the requirements and e
asier to realize. In a layered media when the
seismic wave ray strikes an interface marking
the change of seismic impedance Vρ ( product
of density and velocity), the energy of the wa
ve is partitioned to initiate the derivative rays
as a reflected coming back to the surface and t
ransmission entering into the deeper layer. If t
T
3
T
3
T
3
T
3
T
3
T
5
2
T
3
T
3
T
3
T
3
T
3
T
3
T
3
T
3
T
3
T
3
T
3
T
3
T
3
T
3
T
3
T
3
T
3
T
3
T
3
T
3
T
3
T
1
7
T
3
T
3
T
3
T
3
T
3
T
3
T
3
T
3
T
3
T
1
7
T
3
T
3
T
3
T
1
7
T
3
T
3
T
3
T
3
T
3
T
3
T
3
T
3
T
3
T
3
T
3
T
3
T
3
T
3
T
3
T
3
T
3
T
3
T
3
T
3
T
3
T
3
T
3
T
3
T
3
T
3
T
3
T
3
T
3
T
3
T
3
T
3
T
3
T
3
T
3
T
3
T
1
7
T
1
7
T
3
T
3
T
3
T
3
T
3
T
3
T
3
T
3
T
3
T
1
7
T
3
T
3
T
3
T
3
T
3
T
3
T
3
T
1
7
T
3
T
3
T
3
T
3
T
3
T
3
T
3
T
3
T
3
T
3
T
3
T
3
T
3
T
3
T
3
T
3
T
3
T
3
T
1
7
T
3
T
3
T
3
T
3
T
3
T
3
T
3
T
3
T
3
T
3
T
3
T
3
T
3
T
3
T
3
T
3
T
3
T
3
T
3
T
3
T
1
7
T
3
T
3
T
3
T
1
7
T
3
T
3
T
3
T
3
T
3
T
3
T
3
T
3
T
1
7
T
3
T
3
T
3
T
3
T
3
T
3
T
3
T
3
T
3
T
3
T
3
T
3
T
3
T
3
T
3
T
3
T
3
T
3
T
3
T
3
T
3
T
1
7
T
3
T
3
T
3
T
3
T
3
T
3
T
3
T
3
T
3
T
3
T
3
T
3
T
3
T
3
T
3
T
3
T
3
T
3
T
3
T
3
T
3
T
3
T
1
7
T
3
T
3
T
3
T
1
7
T
3
T
3
T
3
T
3
T
3
T
3
T
3
T
3
T
1
7
T
3
T
3
T
1
7
T
3
T
3
T
3
T
3
T
3
T
3
T
3
T
3
T
3
T
3
T
3
T
3
T
3
T
1
7
T
3
T
3
T
3
T
3
T
3
T
3
T
3
T
3
T
3
T
3
T
3
T
3
T
3
T
3
T
3
T
3
T
3
T
3
T
3
T
3
T
3
T
3
T
3
T
3
T
3
T
3
T
3
T
3
T
3
T
3
T
3
T
3
T
3
T
3
T
3
T
3
T
3
T
3
T
3
T
3
T
3
T
3
T
3
T
3
T
3
T
3
T
3
T
3
T
3
T
3
T
3
T
3
T
3
T
3
T
3
T
3
T
3
T
3
T
3
T
1
7
T
3
T
3
T
3
T
1
7
T
3
T
3
T
3
T
3
T
3
T
3
T
3
T
3
T
3
T
3
T
1
7
T
3
T
3
T
3
T
3
T
1
7
T
3
T
3
T
3
T
3
T
3
T
3
T
3
T
3
T
3
T
3
T
3
T
3
T
3
T
1
7
T
3
T
3
T
3
T
3
T
3
T
3
T
3
T
3
T
3
T
3
T
3
T
3
T
3
T
3
T
3
T
3
T
3
T
3
T
3
T
3
T
3
T
3
T
3
T
3
T
3
T
3
T
3
T
3
T
3
T
3
T
3
T
3
T
3
T
3
T
3
T
3
T
3
T
3
T
3
T
3
T
3
T
3
T
3
T
3
T
3
T
3
T
3
T
3
T
3
T
3
T
3
T
3
T
3
T
3
T
3
T
3
T
3
T
3
T
3
T
3
P
T
3
T
3
T
3
T
3
T
3
T
3
T
3
T
3
T
3
T
3
T
3
T
3
T
3
T
3
T
3
T
3
T
3
T
3
T
3
T
3
T
3
T
3
T
3
T
3
T
3
T
3
T
3
T
3
T
3
T
3
T
3
T
3
T
3
T
3
T
3
T
3
T
3
T
3
T
3
T
3
T
3
T
3
T
3
T
3
T
3
T
3
T
3
T
3
T
3
T
3
T
3
T
3
T
3
T
3
T
3
T
3
T
3
T
3
T
3
T
3
T
3
T
3
T
3
T
3
T
3
T
3
T
3
T
3
T
1
7
T
3
T
3
T
3
T
3
T
3
T
3
T
3
T
1
7
T
3
T
3
T
3
T
3
T
3
T
3
T
3
T
3
T
3
T
3
T
3
T
3
T
3
T
3
T
3
T
3
T
3
T
3
T
3
T
3
T
3
T
3
T
3
T
3
T
3
T
3
P
T
3
T
3
T
3
T
3
T
3
T
3
T
3
T
3
T
3
T
3
T
3
T
3
T
3
T
3
T
3
T
3
T
3
T
3
T
3
T
3
T
3
T
3
T
3
T
3
T
3
T
3
T
3
T
3
T
3
T
3
T
3
T
3
T
3
T
3
T
3
T
3
T
3
T
3
T
3
T
3
T
3
T
1
7
T
3
T
3
T
3
T
3
T
3
T
3
T
3
T
1
7
T
3
T
3
T
3
T
3
T
3
T
3
T
3
T
3
T
3
T
3
T
3
T
3
T
3
T
3
T
3
T
3
T
3
T
3
T
3
T
3
T
3
T
3
T
3
T
3
T
3
T
3
T
3
T
3
T
3
T
3
T
3
T
3
T
3
T
3
T
3
T
3
T
3
T
3
T
3
T
3
T
3
T
3
T
3
T
3
T
3
T
3
T
3
T
3
T
3
T
3
T
3
T
3
T
3
T
3
T
3
T
3
T
3
T
3
T
3
T
3
T
3
T
3
T
3
T
3
T
3
T
3
T
3
T
3
T
3
T
3
T
3
T
3
T
3
T
1
7
T
3
T
3
T
3
T
3
T
3
T
3
T
3
T
3
T
3
T
3
T
3
T
3
T
3
T
3
T
3
T
3
T
3
T
3
T
3
T
3
T
3
T
3
T
3
T
3
T
3
T
3
T
3
T
3
T
3
T
3
T
3
T
1
7
T
3
T
3
T
3
T
3
T
3
T
3
T
3
T
3
T
3
T
3
T
3
T
3
T
3
T
3
T
3
T
3
T
3
he velocity in the underlying is greater than th
e overlying ones at a certain distance from the
source, a transmission ray will appear and cre
ate an angle of near 900 with the normal line
of the interface, the horizontally travel of the r
ay is being happened immediately below the i
nterface. The coming back to the surface deriv
ative wave generated by the interaction of hor
izontal movement of the primary ray with ove
rlying environment is called the refraction wa
ve. In such a way of wave generation the refra
ction wave can be recorded from a certain dis
tance from the source (Lay W., 1995; Mai Th
anh Tan, 2011). Since the travel velocity
along the interface is greater than in the
overlying layer, the refraction ray is arrived
more early at the observation points, so it
often called a head wave. If useful signals are
strong enough, the determination of travel
time can be performed with high precision. It
is the basic way to get a more reliable velocity
structural model under observation profiles. If
the velocity of each layer in the horizontal
layered media is assumed to be a constant, the
travel time is described by a straight segment
with the slope to horizon decreasing by
increasing the velocity on the time - distance
graph. In practice the time - distance graph for
each layer is not completely obey the linear
law, since the velocity is increased with depth
in the same layer and strongly changed at the
boundary of two layers (White, 1989;
Berryman, 1991; Zelt, 1999). Based on these
properties the separation of environment into
different layers followed the time - distance
curve can be realized not so difficult. The
same properties can be applied to separate the
velocity structural model into different layers.
In this case instead of the slope change along
the time-distance curve the difference in
velocity gradient of different layer represented
by the density of velocity isolines of the
model is used. The infringement of linear law
of the time - distance graph can happen when
the interface between two layers is inclined or
T
3
T2
1
7
5
T
3
T
3
4
T
3
T
3
T
3
T
3
T4
1
7
3
T
3
T
3
T
3
T
3
T
3
T
3
T
3
T
3
T
3
T
3
T
3
T
3
T
1
7
T
3
T
3
T
3
T
3
T
3
T
1
7
T
3
T
3
T
3
T
3
T
1
7
T
1
7
T
3
T
3
T
3
T
3
T
3
T
3
T
1
7
T
1
7
T
1
7
T
3
T
3
T
1
7
T
1
7
T
3
T
3
T
3
T
3
T
3
T
3
T
1
7
T
3
T
3
T
3
T
1
7
T
3
T
3
T
1
7
T
3
T
3
T
3
T
3
T
3
T
3
T
3
T
3
T
3
T
3
T
3
T
3
T
3
T
3
T
3
T
3
T
3
T
3
T
3
T
1
7
T
1
7
T
3
T
3
T
1
7
T
3
T
3
T
3
T
3
T
3
T
3
T
3
T
3
T
3
T
3
T
1
7
T
3
T
3
T
3
T
3
T
3
T
3
T
3
T
3
T
3
T
3
T
3
T
3
T
3
T
3
T
3
T
1
7
T
3
T
3
T
3
T
3
T
1
7
T
3
T
3
T
3
T
3
T
3
T
1
7
T
3
T
3
T
3
T
3
T
3
T
3
T
3
T
3
T
3
T
3
T
3
T
3
T
3
T
3
T
3
T
3
T
3
T
3
T
3
T
3
T
3
T
3
T
3
T
3
T
3
T
3
T
3
T
3
T
3
T
3
T
3
T
3
T
3
T
3
T
3
T
3
T
3
T
3
T
3
T
3
T
1
7
T
1
7
T
3
T
3
T
3
T
3
T
3
T
3
T
3
T
1
7
T
1
7
T
3
T
3
T
3
T
3
T
3
T
3
T
3
T
3
T
3
T
3
T
3
T
3
T
3
T
3
T
3
395
T
3
T
1
7
Vietnam Journal of Earth Sciences Vol.38 (4) 394-409
represented by the strong uplifted and
subsidence, etc… The above-mentioned
indications need to be taken into account
during the process of data processing and
interpretation.
According
to
practical
experience, a sudden velocity change along
horizontal direction, the strong offset along
vertical axis as well as the existence of narrow
vertical block penetrated deeply into
environment are the indications for
identifying the tectonic faults and tectonic
fracture zones. These objects also can be
defined on seismogram by the strong offset of
the same phase of waves along the time axis,
or the change to hyperbolic shape of the time distance graph caused by wave diffraction.
Related to the petrology, the stratigraphic
of the study area is characterized successively
from the surface to the depth by Quaternary or
weathered soil, the Paleozoic formations:
Long Dai, Dai Giang and Tan Lam with
composition of mainly claystone, sandstone,
siltstone, limestone and dolomite. Though
there aren’t physical properties of the rock
samples obtained from laboratory analysis, the
consolidation degree is increasing with
age was revealed by the investigations at a
number of outcrops. Therefore, the
environment in the study area is expected to
generate refraction waves.
Based on the above - mentioned analysis
and the purpose of this study, in the
framework of the National Scientific Project
(Code KC.08.16/11-15), 4 seismic profiles
were conducted in the area of hot water spring
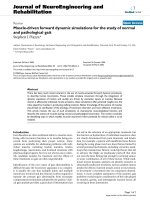
Bang - Le Thuy - Quang Binh (Figure 1). This
paper provides the information about
structures in the area Bang based on the
preliminary results of the refraction data
analysis.
396
East Vietnam Sea
Figure 1. Location of the study area on the map of Vietn
am
T
3
T
3
T
3
T
3
T
3
T
3
T
3
T
3
T
3
T
3
T
3
T
3
T
3
T
3
T
1
7
T
1
7
T
3
T
3
T
3
T
3
T
3
T
3
T
3
2. Tectonic setting
The hot water spring Bang is located in the
southern margin of Quang Binh geotectonic
unit. On the regional scale, the study area
belongs to the eastern part of a large Truong
Son uplifted structure, its geotectonic
evolution is dominantly driven by the activity
of the Khe Giua - Vinh Linh fault. According
to the geological map of scale 1:1.000.000
(Tran Van Tri et al., 2004), this northwest southeast trending fault is stretching from
Nakay plateau (Lao territory), entering into
Vietnam at the south of the mountain Co Ta
Run; the fault section in the territory of
Vietnam is estimated 120 km long with the
first segment paralleled with the upper stream
of Long Dai River; the next segments are
passed successively Khe Giua, Khe Bang (Le
Thuy), North of Ben Quang, South of Ho Xa
(Vinh Linh) and reaches the coastal line at
Cua Tung. Cutting the study area and
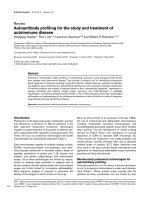
Tran Anh Vu, et al./Vietnam Journal of Earth Sciences 38 (2016)
fault segment named F1 is stretching nearly
along the sub parallel direction and separates
the study area into two main structural blocks:
Le Thuy in the northern and Vinh Linh in the
southern parts, respectively (Figure 2).
experienced a long evolution history, the
activity of this regional fault is profoundly
affected to the neotectonic structural feature
of the region. In the study area, about 15 km
surrounding the hot water spring Bang, the
Figure 2. Geotectonic s cheme of the study area
T
3
T
3
T
3
T
3
T
3
The Le Thuy block occupies the area
belonging to three villages: Son Thuy, Truong
Thuy and Van Thuy. The structure is
developed on the basement of Truong Son
folded uplifted belt, which was consolidated
in the Paleozoic time and consists of
continental, continental carbonate materials
belonging to the Long Dai, Dai Giang
and Tan Lam formations. The strong
differentiation of movement during Cenozoic
time had created a number of higher order
structures, their boundaries are mainly the
T
3
T
3
T
3
T
3
T
3
T
3
T
3
T
3
T
3
T
3
northwest - southeast trending faults. The
subsidence rate is increasing from southwest
to northeast, meanwhile the age of basement
rocks is decreased from Early-Midle
Paleozoic at the vicinity of Khe Giua - Vinh
Linh fault to Middle Paleozoic age in the
northeastern part of the block. The Quaternary
sediment is also spread more popularly and
thicker in this part. It is noted that, the basalt
extrusion outcrop of Late Pliocene - Early
Pleistocene age is distributed along the
northwest - southeast direction fault and
397
Vietnam Journal of Earth Sciences Vol.38 (4) 394-409
located away from the hot water spring Bang
more than 5 km to the Northeast.
The Vinh Linh block occupies the southern
part of the study area in the territory of Vinh
O, Vinh Ha, Ngan Thuy and Vinh Khe
villages. This structure is developed on the
fold basement consolidated in Paleozoi and
consists of continental, continental carbonate
materials of the Long Dai and Tan Lam
formations. In relation with the northern
structural unit, the southern structure can be
fairly accepted in term of the uplifted block.
The strong differentiation of movement
during Cenozoic time had separate the block
into the high order structures, the boundaries
of which are mainly the faults of northwest southeast direction. Though the age of the
basement rocks is the same Early - Middle
Paleozoic, younger tendency is demonstrated
from southwest to northeast. In addition, in
this block the density of sub meridian faults is
higher than in the northern one, especially in
the south of the hot water spring Bang.
Despite of the complexity of structural
feature in the study area, the step subsidence
tendency is apparently reflected in general
from southwest to northeast and the most
strong subsidence is revealed along Khe Giua
- Vinh Linh fault (F1), which is the boundary
between two main blocks. In relation to the
faults, the northwest - southeast trending
system is the most popular system spread in
the study area. The younger sub meridian
faults possibly related to the present day
geothermal activity, including the hot water
spring Bang, which was formed as the
consequence of the Quaternary extension
movement in the region.
3. Field measurements and data interpretation
techniques
surroundings for improving confidence of the
study of geothermal system structures and the
prediction of geothermal reservoir existence
based on the magneto-telluric data. As
mentioned above, the seismic refraction
investigations were selected. According to the
previous studies (Flynn, Hoang Huu Quy,
1997; Hoang Huu Quy, 1998; Doan Van
Tuyen, 2016), the hot water spring Bang is
generated by the activity of the northwest southeast trending fault system, including the
F1, F6 and the smaller size sub meridian
faults. It will be better if the measurement
profiles are designed to cut as much faults as
possible and their prolongation needs to reach
the maximum value to increase investigated
depth. Based on geological survey data (Tran
Van Tri et al., 2004), the maximum thickness
of all Paleozoic sediments may reach 3500 m
in the region. If it will be the desire depth to
investigate, the measurement profiles must be
prolonged from about 4 times greater than that
(Reynolds,
2011). Since the total thickness of Paleozoic s
ediments was roughly estimated by the geolog
ical survey data, the results are bearing mainl
y the regional significance and this parameter
is still not clear for the study area. In addition,
it is not certain to define the total thickness of
all the Paleozoic sediments in this study. The s
trong topographical separation, the scattered dist
ribution
of population points and undeveloped transport
ation system do not allowed us to design the pro
files of desire length. The wireless instruments u
sed for data collection will be easier to realize w
ith the local condition. Among 4 measured profil
es, the longest profile T1 is 11.3 km, profile T2 i
s 10.4 km, the remain profiles T3 and T4 are onl
y
8.05 and 7.65 km long, respectively (Fig. 3).
T
3
T
3
T
3
T
3
T
3
T
3
T
3
T
3
398
T
3
T
3
T
3
T
3
T
3
T
3
T
3
T
3
T
3
T
3
T
3
T
1
7
T
3
T
1
7
T
3
T
1
7
T
3
T
3
T
3
T
3
T
3
T
3
T
3
T
3
T
3
T
3
T
4
T
3
T
3
T
3
T
1
7
T4
1
7
3
T
3
T
3
T
3
T
3
T
3
T
3
T
3
T
3
T
3
T
3
T
3
T
3
T
3
T
3
T
3
T
3
T
3
T
3
T
3
T
3
T
3
T
3
T
3
T
3
T
3
T
3
T
3
T
3
T
3
T
3
T
3
T
3
T
3
T
3
T
3
T
3
T
3
T
3
T
3
T
3
T
3
T
1
7
T
1
7
T7
3
4
1
T
3
T
3
T
3
T
3
T
3
T
3
T
3
T
3
T
3
T
3
T
3
T
3
T
3
T
3
T
3
T
3
T
3
T
3
T
3
T
3
T
3
T
3
T
3
T
3
T
3
T
3
T
3
4
T
3
T
3
T
3
T
3
T
3
T
3
T
3
T
3
T
1
7
T
3
T
1
7
T
3
T
3
T
1
7
T
3
T
1
7
T
3
T
3
T
3
T
3
T
3
T
3
T
3
T
3
T
3
T
3
T
3
T
3
T
3
T
3
T
3
T
3
T
1
7
T
3
T
3
T
3
T
3
T
3
T
3
T
3
T
3
T
3
T
1
7
T
3
T7
4
1
T
3
T
3
T
1
7
T
3
T
3
T
3
T
1
7
T
1
7
T
3
T
1
7
T
3
T
3
4
T
3
T
3
T
3
T
3
T
3
T
3
T
3
T
3
T
3
T
3
T
3
T
3
T
3
T
3
T
3
T
3
T
3
T
3
T
3
T
3
T
3
T
3
T
3
T4
1
7
T
3
T
3
T
3
T
3
T
3
T
3
T
3
T
3
T
3
T
3
T
3
T
1
7
T
3
T
3
T
3
T
3
T
3
T
3
T
3
T
1
7
T
3
T
3
T
3
T
3
The seismic investigations aimed to
provide the information about deep structure
in the area of hot water spring Bang and
T
3
T
1
7
T
3
T
3
T
3
T
3
T
3
T
1
7
T
3
T
3
T
3
T
3
T
3
T
3
T
3
T
3
T
3
T
3
T
3
T
3
T
3
T
3
3.1. Field measurements
T
3
T
4
T
3
T
3
T
3
Tran Anh Vu, et al./Vietnam Journal of Earth Sciences 38 (2016)
T
3
Figure 3. Scheme of the s eismic investigation profiles in the area Bang and its
T
3
T
3
T
3
T
3
T
3
T
3
T
3
T
3
T
3
T
3
T
3
T
3
T
3
T
3
It is not necessary to use much dense
instruments along each profile due to the stud
y is not required to understand much detail of
the subsurface layer, therefore the distances b
etween the instruments selected in a range of
120250 m are appropriated to the practical conditi
on. 150 wireless Texan seismic instruments de
veloped by the Refraction Technology Compa
ny, USA, the same type of instruments used in
the study of deep structures in North Vietnam
in 2008 (Dinh Van Toan et al, 2008, 2010; H
arder, Dinh Van Toan, 2011) and provided by
the Institute of Earth Sciences, Academia Sini
T
3
T
3
T
3
T
3
T
3
T
3
T
3
4
T
3
T
3
T
3
T
3
T
3
T
3
T
3
T
3
T
3
T
3
T
3
T
3
T
3
T
3
T
3
T
3
T
3
T
3
T
3
T
3
T
3
T
3
T
3
T
3
T
3
T
3
T
3
T
3
T
3
T
3
T
3
T
3
T
3
T
3
T
3
T
3
T
3
T
3
T
3
T
3
T
3
T
3
T
3
T
3
T
3
T
3
T
3
T
3
T
3
T
3
T
3
T
3
T
3
T
3
T
3
T
3
T
3
T
3
T
3
T
3
T
3
T
3
T
3
T
3
T
3
T
3
T
3
T
3
T
3
T
3
T
3
T
3
T
3
T
3
T
1
7
T
3
T
3
T
3
T
3
T
3
T
3
T
3
T
3
T
3
T
3
T
3
T
1
7
T
3
T
1
7
T
3
T
3
T
3
T
3
T
3
T
3
T
3
T
3
T
3
T
3
T
3
T
1
7
T
1
7
T
3
T
3
T
3
T
1
7
T
3
T
3
T
1
7
T
3
T
1
7
T
3
T
3
T
3
T
3
T
3
T
3
T
3
T
3
T
3
T
3
T
3
T
1
7
T
3
T
3
T
3
T
3
T
3
T
3
T
3
T
3
T
3
T
3
T
3
T
1
7
T
3
T
3
T
3
T
3
T
3
T
3
T
3
T
3
T
3
T
3
T
3
T
3
T
3
T
1
7
T
3
T
3
T
3
T
3
T
3
T
3
T
3
T
3
T
3
T
3
T
3
T
3
T
3
T
3
T
3
T
3
T
3
T
3
T
3
T
3
T
3
T
3
T
3
T
3
T
3
T
3
T
3
T
3
T
3
T
3
T
3
T
1
7
T
3
T
3
T
3
T
3
T
3
T
3
T
3
T
3
T
3
T
3
T
3
T
3
T
3
T
1
7
T
3
T
3
T
3
T
3
T
3
T
3
T
3
T
3
T
3
T
3
T
3
T
3
T
3
T
3
T
3
T
3
T
3
T
1
7
T
3
T
1
7
T
3
T
1
7
T
3
T
1
7
T
3
T
3
T
3
T
1
7
T
3
T
3
T
3
T
1
7
T
3
T
3
T
3
T
3
T
3
T
3
T
3
T
1
7
T
3
T
1
7
T
3
T
3
T
3
T
3
T
3
T
3
T
3
T
1
7
T
1
7
T
1
7
T
3
T
3
T
3
T
3
T
3
T
1
7
T
3
T
3
T
3
T
3
T
3
T
1
7
T
3
T
3
T
1
7
T
3
T
3
T
3
T
3
T
1
7
T
1
7
T
3
T
3
T
1
7
T
1
7
T
1
7
T
3
T
3
T
3
4
T
1
7
T
3
T
1
7
T
3
T
3
T
3
T
3
T
3
T
3
T
3
T4
1
7
3
T
3
T
3
T
3
T
3
T
3
T
3
T
3
T
3
T
3
T
3
T
3
T
3
T
3
T
3
T
3
T
3
T
3
T
3
T
3
T
3
T
3
T
3
T
3
ca, Taiwan were used in this study. Along the
NorthSouth direction profile T1 were deployed 52 i
nstruments, 3 explosions at points N1, N2, N4
with the explosive mass of 100, 60 and 60 kg
s respectively were realized to generate refract
ion signals. To produce refraction wave for 50
instruments distributed along the profile T2, 4
explosions with the explosive mass 100, 40, 6
0, 100 kgs respectively at 4 points N8, N7, N6
and N9 were conducted. The data collection a
long the profiles T3 and T4 with 36 and 34 ins
truments respectively was carried out by using
3 common explosions at the points N9, N6 an
T
3
T
3
T
3
T
3
T
3
T
3
T
3
T
3
T
3
T
3
T
3
T
3
T
3
T
3
T
3
T
3
T
3
T
3
T
3
T
3
T4
1
7
3
T
3
T
3
T
3
T
1
7
T
3
T
3
T
3
T
3
T
3
T
3
T
3
T
3
T
3
T
3
T
3
T
3
4
T
3
T
3
T
3
T
3
T
1
7
T
3
T
3
T
3
T7
3
4
1
T
3
T
3
T
3
T
3
T
1
7
T
3
T
3
T
3
T
3
T
3
T
3
T
3
T
3
T
3
T
3
T
3
T
3
T
1
7
T
3
T
3
T
3
T
1
7
T
3
T
3
T
3
T
3
T
1
7
T
3
T
3
T
3
T
3
T
3
T
3
T
3
T
3
T
3
T
1
7
T
3
T
3
T
3
T
3
T
3
T
3
T
3
399
Vietnam Journal of Earth Sciences Vol.38 (4) 394-409
d N4 (fig. 3). The field work was successfully
performed in March 2014, the GPS time sync
hronization was applied for every instrument j
ust before their deployment. All the explosions
were conducted in the drilling holes with the d
epths varied from 24 to 32 m. Since the farthest
source
receiver distance along each profile is equal to
their lengths, so explosive mass of 100 kgs we
re chosen for the explosions at the end points o
the
profiles
and
40f
60 kgs for the explosions at their internal points
. The safety guarantee for the civil structures an
d population points as well as the strong enoug
h signals of refraction wave generation from ev
ery explosion are the requirements must be sati
sfied at the same time.
According to the experiments (Ester, 2010
; Tesarik, 2011) and experience (Uruh et al.,
2001; Dinh Van Toan, Harder, 2008; Dinh V
an Toan et al., 2011; Harder, Dinh Van Toan,
2011), the chosen plan for explosion in boreh
oles as mentioned above is satisfied both dem
ands. The data recorded in the format of instru
ments then were transformed into other format
such as Miniseed, Segy for easy reading by di
fferent software used in seismic analysis. By r
eading all the seismograms on the computer s
creen we can see a good quality of the collect
ed data, the first arrival signal of refraction w
T
3
T
3
T
3
T
3
T
3
T
3
T
3
T
3
T
3
T
3
T
3
T
3
T
3
T
3
T
3
T
3
T
3
T
3
T
3
T
3
T
3
T
3
T
3
T
3
T
3
T
3
T
3
T
3
T
3
4
T
3
T
3
T
3
T
3
T
3
T
3
T
3
T
3
T
3
T
3
T
3
T
3
T
3
T
3
T
3
T
3
T
3
T
3
T4
1
7
3
T
3
T
3
T
3
T
3
T
3
T
3
T
3
T
3
T
3
T
3
T
3
T
3
T
3
T
3
T
3
T
3
T
3
T
3
T
3
T
3
T
3
T
3
T
3
T
3
T
3
T
3
T
3
T
3
T
3
T
3
T
3
T
3
T
3
T
1
7
T7
3
4
1
T
1
7
T
1
7
T
1
7
T
3
T
3
T
3
T
3
T
3
T
3
T
3
T
3
T
3
T
3
T
3
T
3
T
3
T
3
T
3
T
3
T
3
T
3
T
3
T
3
T
3
T
3
T
3
T
3
T
3
T
3
T
3
T
3
T
3
T
3
T
3
T
3
T
3
T
3
T
3
T
3
T
3
T
3
4
T
3
T
1
7
T
3
T
3
T
3
T
3
T
3
T
3
T
3
T
3
T
3
T
1
7
T
3
T
1
7
T
3
T
3
T7
3
4
1
T
3
T
3
T
3
4
T
3
T
3
T
3
T
3
T
3
T
3
T
3
T
3
T
1
7
T
3
T
3
T
3
T
3
T
3
T
3
T
3
T
3
T
3
T
3
T
3
T
3
T
3
T
3
T
3
T
3
T
3
T
3
T
3
T
3
T
3
T
3
T
3
T
3
T
3
T
3
T
3
T
3
T
3
T
3
T
3
T
3
T
3
T
3
T
3
T
3
T
3
T
3
T
3
T
3
T
3
T
3
T
3
T
3
T
3
T
3
T
3
T
3
T
3
T
3
T
3
T
3
T
3
T
1
7
T
1
7
T
3
T
3
T
3
T
3
T
3
T
3
T
3
T
3
T
3
T
3
T
3
T
1
7
T
3
T
3
4
T
3
T
3
T
3
T
3
T
3
T
3
T
1
7
T
3
T4
1
7
3
T
3
T
3
T
3
T
3
T
3
T
3
T4
1
7
3
T
3
T
3
T
3
T
3
T
3
T
3
T
3
T
3
T
3
T
3
T
3
T
3
T
3
T
3
T
3
T
3
T
3
T
3
T
3
T
3
T
3
T
3
T
3
T
3
T
3
T
3
T
3
T
3
T
3
T
3
T
3
T
3
T
3
T
3
T
3
T
3
T
3
T
3
T
3
T
3
T
3
T
3
T
3
T
3
T
3
T
1
7
T
3
T
3
T
3
T
1
7
T
3
T
3
T
3
T
3
T
3
T
3
T
3
T
3
T
3
T
3
T
3
T
3
T
3
T
3
T
3
T
3
T
3
T
3
T
3
T
3
T
3
T
3
T
3
T
3
T
3
T
3
T
3
T
3
T
3
T
3
T
3
T
3
T
3
T
3
T
3
T
3
T
3
T
3
T
3
T
3
T
3
T
3
T
3
T
3
T
3
T
3
T
3
T
3
T
3
T
3
T
3
T
3
T
3
T
3
T
3
T
3
T
3
T
3
T
3
T
3
T
3
T
3
4
T
3
T
3
T
3
T
3
T
3
T
3
T
3
T
3
T
3
T7
3
4
1
T
3
T
3
T
3
T
1
7
T
3
T
3
T
3
T
3
T
3
T
3
T
3
T
1
7
T
3
T
3
T
3
T
3
T
1
7
T
3
T
3
T
3
T
3
T
1
7
T
3
T
3
T
3
T
3
T
1
7
T
3
T
3
T
3
T
3
T
3
T
3
T
3
T
3
T
3
T
3
4
T
3
T
3
T
3
T
3
T
3
T
3
T
3
T
1
7
T
3
T
3
T
3
T
3
T
3
T
1
7
T
3
T
3
T
3
T
1
7
T
3
T
3
T
3
T
3
T
3
T
3
T
3
T
3
T
3
T
3
T
3
T
3
T
3
T
3
ave clearly appears on the records of every ins
trument. The seismogram recorded by the inst
rument No. 14239 on March 14, 2014 produce
d by the explosion at point N1, profile T1 (fig.
4) is a good example. The first arrival signal
on the record is reflected by the sudden increa
se of wave amplitude at the time moment 05:2
8:73.0. Thus the arrival time can be precisely
picked by the software named Seismogram2K
during the data analysis process. On the seis
mic section constructed by the data recorded b
y all the instruments along the profile T1 (fig.
5), the connection of all the first arrival times
marked by the strong increase of signal ampl
creates
the
time
itude
distance graph of refraction wave with differe
nt slope to the abscissa from segment to segm
ent. By intuition it is not so clear to see the
separation into different straight segment due
to a small scale of the seismic section,
however 3 distinguished near straight
segments of the different slope to the horizon
corresponded to different refraction interface
with different velocity in the environment
were identified. In this study the seismograms
recorded by individual instrument is used for
picking the first arrival time, since the signal
on it is much more clear than on the
seismogram created by combination of the
data records of all
instruments.
T
3
T
3
T
3
T
3
T
3
T
3
T
3
T
3
T
3
T
3
T
3
T
3
T
3
T
3
T
3
T
3
T
3
T
3
T
3
T
3
T
3
T
3
T
3
T
3
T
3
T
3
T
3
T
3
T
3
T
3
T
3
T
3
T
3
T
3
T
3
T
3
T
3
T
3
T
3
T
3
T
3
T
3
T
3
T
3
T
3
T
3
Figure 4. Quality of the seismic signals recorded b y individual instrument
T
3
400
T
3
T
3
T
3
T
3
T
3
T
3
T
3
T
3
T
3
T
3
T
3
T
3
T
3
T
3
T
3
T
3
T
3
T
3
T
3
T
1
7
T
3
T
3
T
3
T
3
T
3
T
3
T
3
T
3
T
3
T
3
T
3
T
3
T
3
T
3
T
3
T
3
T
3
T
3
T
3
T
3
T
3
T
3
T
3
T
3
T
3
T
3
T
3
T
3
T
3
T
3
T
3
T
3
T
3
T
3
T
3
T
3
T
3
T
3
T
3
T
3
T
3
T
3
T
3
T
3
T
3
T
3
T
3
T
3
T
3
T
3
T
3
T
3
T
3
T
3
T
3
T
3
T
3
T
3
T
3
T
3
T
3
T
3
T
3
T
3
T
3
T
3
T
3
T
3
T
3
T
3
T
3
T
3
T
3
T
3
T
3
T
3
T
3
T
3
T
3
T
3
T
3
T
3
T
3
T
3
T
3
T
3
T
3
T
3
T
3
T
3
T
3
T
3
T
3
T
3
T
3
T
3
T
3
T
3
T
3
T
3
T
3
T
3
T
3
T
3
T
3
T
3
T
3
T
3
T
3
T
3
T
3
T
3
T
3
T
3
T
3
T
3
T
3
T
3
T
3
T
3
T
3
T
3
T
1
7
T
3
T
3
T
3
T
1
7
T
3
T
3
T
3
T
3
T
3
T
3
T
3
T
3
T
1
7
T
3
T
3
T
3
T
3
T
3
T
3
T
3
T
3
T
3
T
3
T
3
T
1
7
T
3
T
3
T
3
T
3
T
3
T
3
T
3
T
3
T
3
T
3
T
3
T
3
T
3
T
3
T
3
T
3
T
3
T
3
T
3
T
3
T
3
T
3
T
3
T
3
T
3
T
3
T
3
T
3
T
3
T
3
T
3
T
3
T
3
T
3
T
3
T
3
T
3
T
3
T
3
T
3
T
3
T
3
T
1
7
T
3
T
3
T
3
T
1
7
T
3
T
3
T
3
T
3
T
3
T
1
7
T
3
T
1
7
T
1
7
T
1
7
T
3
T
3
T
1
7
T
1
7
T
3
T
3
Tran Anh Vu, et al./Vietnam Journal of Earth Sciences 38 (2016)
Figure 5. Seismogram created by the records of all the instruments along profile T1 with the explosion at the point N1
T
3
T
3
T
3
T
3
T
3
T
3
T
3
T
3
T
3
T
3
T
3
T
3
T
3
T
3
T
3
T
3
T
3
T
3
T
3
T
3
T
3
T
3
T
3
T
3
T
3
Figure 6. The seismic ray from source to
receiver in the investigated environment
T
3
T
3
T
3
T
3
T
3
T
3
T
3
T
3
T
3
T
3
T
3
T
3
T
3
T
3
T
3
T
3
T
3
T
3
T
3
T
3
T
3
T
3
3.2. Method of data analysis
T
3
T
3
T
3
T
3
T
3
T
3
T
3
T
3
T
3
T
3
T
3
T
3
T
3
T
3
T
3
T
3
T
3
T
3
T
3
T
3
T
3
T
4
T
3
T
3
T
3
T
3
T
3
T
3
T
3
T
1
7
T7
5
2
1
T
3
T
3
T
3
T
3
T
3
T
3
T
3
T
5
2
T
3
T
3
T
3
T
3
T
3
T
3
T
3
T
3
T
3
T
3
T
3
T
1
7
T
3
T
3
T
3
T
1
7
T
3
T
3
T
3
T
3
T
3
T
3
T
3
T
3
T
3
T
3
T
3
T
3
T
3
T
3
T
3
T
3
T
1
7
T
3
T
3
T
3
T
3
T
3
T
3
T
3
T
1
7
T
3
T
3
T
3
T
3
T
3
T
3
T
1
7
T
1
7
T
3
T
3
T
1
7
T
1
7
T
3
T
3
T
3
T
3
T
1
7
T
3
T
3
T
1
7
T
3
T
3
T
3
T
3
T
3
T
3
T
3
T
1
7
T
3
T
3
T
3
T
3
T
3
T
3
T
3
T
3
T
3
T
3
4
T
3
T
3
T
3
T
3
T
3
T
3
T
3
T
3
T
3
T4
1
7
3
T
3
T
3
T
3
T
3
T
3
T
3
T
3
T
3
T
3
T
3
T
3
T
3
T
3
T7
4
1
T
3
T
3
T
3
T
1
7
T
1
7
T
3
T
3
T
3
T
3
T
3
T
3
T
3
T
1
7
T
3
T
3
T
3
T
3
T
3
T
3
T
3
T
3
T
3
T
3
T
3
T
3
T
3
T
3
T
3
T
1
7
T
3
T
3
T
3
T
3
T
3
T
3
T
3
T
3
T
3
T
1
7
T
3
T
3
T
3
T
3
T
3
T
3
T
3
T
3
T
3
T
3
T
3
T
3
T
1
7
T
3
T
3
T
3
T
1
7
T
1
7
T
3
T
1
7
T
3
T
3
T
3
T
3
T
1
7
T
3
T
1
7
T
3
T
3
T
1
7
T
3
T
3
T
1
7
T
3
T
3
T
3
T
3
T
1
7
T
3
T
3
T
3
T
3
Our problem is seeking the velocity
structural model under the observation
T
3
T
3
T
3
T
3
3.2.1. The algorithm and software used for
data analysis
T
3
T
3
T
3
T
3
T
3
T
1
7
T
3
T
3
T
3
T
1
7
T
3
Construction of seismic velocity model
under observation profile is the purpose of
data analysis. The 2D seismic inversion will
be applied and tomographic technique is used
to construct the velocity model under the
investigation profiles.
T
3
profiles, so that the difference of theoretical
travel time in comparison with the observation
is need to be small enough. This paper just
deals with the first arrival refraction wave
appeared on the seismograms and generated
by underground layered environment. The
first step of inversion is to solve the forward
problem, i.e. the initial structural model must
be constructed by an interpreter and than the
wave travel times from sources to receivers
will be calculated. The comparison between
the theoretical calculated travel time curve
and the observation data is the next
step. If the difference between them is not sm
all enough, the parameters of the model, inclu
ded the depths to different interfaces as well a
s the velocity in each layer will be changed by
using the least square techniques for minimizi
ng the target function. The iterative process o
f calculation is continued until the difference
between the theoretical and observation travel
time
curves became small enough and the paramete
rs, including the velocity and the distribution
of different layers in the last calculation are ac
cepted as the structural model consistent to th
e real environment (White 1989; Berryman, 1
990; Pullammanappallil et al., 1994; Udias, 19
99; Zelt, 1999). At present the ray tracing theo
ry is popularly used for calculation of the theo
retical travel times. In this study the seismic t
T
1
7
T
3
T
3
T
3
T
3
T
3
T
3
T
3
T
3
T
1
7
T
3
T
1
7
T
3
T
3
T
3
T
3
401
Vietnam Journal of Earth Sciences Vol.38 (4) 394-409
omography is realized by using the software n
amed Plotrefa, the product of Geophysical Ins
Company
OYO
trumental
2003. According to the algorithm, the velocit
y distributions under observation profile are di
scretely represented in the nodes of grid by th
e values increased with increasing depth (fig.
6). In this case the calculation of source receiver travel times follows the formula:
T
3
T
3
T
3
T
3
T
3
T
3
T
3
T
3
T
3
T
3
T
3
T
3
T
3
T
3
T
3
T
3
T
3
T
3
T
3
T
3
T
3
T
3
T
3
T
3
T
3
T
1
7
T
1
7
T
3
T
3
T
3
T
3
T
3
T
3
T
3
T
3
T
3
T
3
T
3
T
3
T
3
T
3
T
3
T
3
T
3
T
3
T
3
T
3
T
3
T
3
T
3
T
3
T
3
T
3
T
1
7
T
3
T
1
7
T
3
T
3
T
3
T
3
T
3
T
3
T
3
T
1
7
T
1
7
T
3
T
3
T
3
T
3
T
3
T j = Σ S i L ji
T
3
T
3
T
3
T
3
T
3
T
3
T
3
T
3
T
3
T
3
T
3
T
3
T
3
T
3
T
3
T
3
T
3
T
3
T
3
T
3
T
3
T
3
T
3
T
3
T
3
T
3
T
3
T
3
T
3
T
3
T
3
T
3
T
3
T
3
T
3
T
3
T
3
T
3
T
3
T
3
T
3
T
3
i=N
R
R
A
A
E
R
R
R
j = 1,2,..., M
R
(1)
i=1
Here M - the number of instruments; N the number of segments along the wave ray
passed the environment and separated by the
grid network.
To calculate the theoretical travel time
curve both the initial layered structural model
as well as minimum and maximum velocity
values corresponded to the subsurface and
deepest layers must be given by an interpreter;
the number of layers can be also changed
during the iterative calculation process. In this
study the increasing velocity with depth
obeyed the exponential law will be calculated
and it’s values at each node of the grid
is automatically accepted during the
calculations. As mentioned above, if the
difference between the theoretical and
observation travel time curves T ilt and T iqs is
still not small enough, the iterative calculation
is continued on the basic of least square
techniques to change the model parameters:
R
R
1
Σ [ T ilt - T iqs ]2 = Min
E=
M i=1
R
R
A
E
R
R
R
R
P
P
T
3
T
3
R
T j k+1 = T j k + ∂E/∂m j
RP
P
R
R
402
R
R
R
RP
P
R
R
(3)
T
3
T
3
T
3
T
3
T
3
T
3
T
1
7
T
3
T
3
T
3
T
3
T
3
T
3
T
3
T
3
T
3
T
3
T
3
T
3
T
3
T
3
T
3
T
3
T
3
T
3
T
3
T
3
T
3
T
3
T
3
T
3
T
3
T
3
T
3
T
3
T
3
T
3
T
3
T
1
7
T
1
7
T
3
T
1
7
T
1
7
T
3
T
3
T
3
T
3
T
3
T
3
T
3
T
3
T
1
7
T
3
T
3
T
1
7
T
1
7
T
3
T
3
T
3
T
3
T
3
T
1
7
T
1
7
T
3
T
1
7
T
1
7
T
3
T
3
T
3
T
3
T
3
T
3
T
3
T
3
T
3
T
3
T
3
T
3
T
3
T
3
T
3
T
3
T
3
T
3
T
3
T
3
T
3
T
3
T
3
T
1
7
T
3
T
3
T
3
T
3
T
3
T
3
T
3
T
3
T
3
T
3
T
3
T
3
T
3
T
3
T
3
T
3
T
3
T
3
T
3
T
3
T
3
T
3
T
3
T
3
T
3
T
3
T
3
T
3
T
3
T
3
T
3
T
3
T
3
T
3
T
3
T
3
T
3
T
3
T
3
T
3
T
3
T
3
T
3
T
3
T
3
T
3
T
3
T
3
T
3
T
1
7
T
3
T
3
T
3
T
3
T
3
T
3
T
3
T
3
T
3
T
3
T
1
7
T
3
T
1
7
T
3
T
3
T
3
T
3
T
3
T
3
T
3
T
1
7
T
3
T
3
T
3
T
3
T
3
T
3
T
3
T
3
T
3
T
3
T
3
T
3
T
3
T
3
T
3
T
3
T
1
7
T
1
7
T
3
T
3
T
3
T
1
7
T
3
T
3
T
3
T
3
T
3
T
3
T
3
T
3
T
3
T
3
T
3
T
3
T
3
T
3
T
3
T
3
T
3
T
3
T
3
T
3
T
3
T
3
T
3
T
3
T
3
T
3
T
3
T
1
7
T
3
T
3
T
3
T
3
T
3
T
1
7
T
3
T
3
T
3
T
3
T
3
T
3
T
1
7
T
3
T
3
T
3
T
3
T
3
T
3
T
3
T
3
T
3
T
3
T
3
T
3
T
3
T
1
7
T
3
T
3
T
3
T
3
T
3
T
3
T
3
T
3
T
3
T
3
T
3
T
3
T
3
T
3
T
3
T
3
T
3
T
3
T
3
T
3
T
3
T
3
T
3
T
3
T
3
T
3
T
3
T
1
7
T
3
T
3
T
1
7
T
3
T
3
T
3
Here ∂E/∂m j - partial derivative of the
parameter m j , possibly the velocity or the
depths in the nodes of grid; k - the numerical
order of iteration.
R
T
3
T
1
7
T
3
T
3
R
T
3
T
3
T
3
Since the function E can reach a minimum
when ∂E/∂m j =0, therefore the parameters
need to be changed in the next iteration are
calculated from formula:
T
3
T
3
T
3
T
3
(2)
T
3
T
3
T
3
i=M
A
Thus, to prepare the input data for
modeling, the definition of the source receiver observation travel times for all the
instruments along the profiles is needed to be
performed firstly. Since the instruments used
in this study are wireless, so the travel times
are determined by subtraction of the travel
time at the instrument located in 2 to 4 m
around a shot point from the travel times at
the instruments distributed along the profiles.
The refraction signals are clearly reflected
from the collected data, especially when the
seismograms were read by using the program
Seismogram2K developed by the Antony Lomax company, USA. The frequency,
amplitude filtering and zoom functions can be
operated by this program. Though the first
arrival wave is indicated stronger than the
noise on all the recorded seismograms, the
band pass filtering operation was applied to
increase the resolution in time for the signals.
In consequences the pick of first arrival times
is became more easy and more reliable (fig.
7). All the travel times related to each explosi
on along each profile were used for constructi
of
the
time
on
distance graphs. Due to the analysis program
works just with the equidistance distribution d
the
first
time
ata,
distance graph created from really unique dist
ance collected data were transformed into the
equidistance graph by using the linear interpol
ation technique. The chosen window compris
just
2es
3 points of data, so their connected line is not
much declined from the linear law as the reas
on of the small error of the interpolation in thi
s study (fig 8). An inconsiderable difference
both in values and shape of the time distance curve constructed from the real and i
nterpolation data is reflected in this figure. Th
e largest error for the profile T1 reached 27.9
ms (millisecond) is generated by the interpolat
of
the
time
ion
distance curve obtained from the explosion at
the
point N4; the value 20.55 ms is the largest err
or corresponded to the explosion at the
point N9 for profile T2 and the values of 11.8
and 29.24 ms are the largest interpolation err
ors related to the common explosion at the
T
3
T
3
T
3
T
3
T
3
T2
1
7
5
T
5
2
T
3
T
3
T
3
T
3
T
3
T
3
T
3
T
3
T
3
T
5
2
T
3
T
3
T
3
T
3
T
3
T
3
T
3
T
3
T
3
T
3
T
3
T
3
T
3
T
3
T
3
T
3
T
3
T
3
T
3
T
3
T
3
T
3
T
3
T
3
T
3
T
3
T
3
T
3
T
3
T
3
T
3
T
3
T
3
T
3
T
3
T
1
7
T
1
7
T
3
T
3
T
3
T
3
T
1
7
T
1
7
T
3
T
3
T
3
T
3
T
3
T
3
T
3
T
3
T
3
T
3
T
3
T
3
T
3
T
3
T
3
T
3
T
1
7
T
3
T
3
T
3
T
3
T7
5
2
1
T
3
T
3
T
1
7
T7
5
2
1
Tran Anh Vu, et al./Vietnam Journal of Earth Sciences 38 (2016)
point N9 for the profiles T3 and T4, respectiv
T
5
2
T
3
T
3
T
3
T
3
T
3
T
3
T
3
T
3
T
3
T
3
T
3
T
3
T
3
T
3
ely.
T
3
T
3
Figure 7. Picking the first arrival time on the seismogram recorded b y individual instrument
T
3
T
3
T
3
T
3
T
3
T
3
T
3
T
3
T
3
T
3
T
3
T
3
T
3
T
3
T
3
T
3
T
3
T
3
T
3
T
3
T
3
T
3
T
3
T
3
T
3
T
3
T
1
7
403
Vietnam Journal of Earth Sciences Vol.38 (4) 394-409
Figure 8. The equal distance time - distance graph obtained b y the interpolation of the observation data
T
3
T
3
T
3
T
3
T
3
T
3
T
3
T
3
T
3
T
3
T
3
T
3
T
3
T
3
T
3
T
3
T
3
T
3
3.2.2. The seismic modeling
T
3
T
3
T
3
T
3
T
3
T
3
T
3
T
3
T
3
T
3
T
3
T
3
T
3
T
3
T
3
T
3
T
3
T
3
T
3
T
3
T
3
T
1
7
T
3
T
3
T
3
T
3
T
1
7
T
3
T
3
T
3
T
3
T
3
T
3
T
1
7
T
3
T
3
T
3
T
3
T
3
T
3
T
3
T
3
T
3
T
3
T
3
T
3
T
3
T
3
T
3
T
3
T
3
T
3
T
3
T
3
T
3
T
3
T
3
T
3
T
3
T
1
7
T
3
T
3
T
1
7
T
3
T
3
T
3
T
3
T
3
T
3
T
3
T
3
T
3
T
3
T
3
T
3
T
3
T
3
T
3
T
3
T
3
T
3
T
3
T
3
T
3
T
3
T
3
T
3
T
3
T
3
T
3
T
3
T
3
T
3
T
3
T
3
T
3
T
3
T
3
T
3
T
1
7
T
1
7
T
3
T
3
T
3
T
3
T
3
T
3
T
1
7
T
3
T
3
T
1
7
T
1
7
T
3
T
3
T
3
T
3
T
3
T
3
T
3
T
3
T
3
T
3
T
3
T
3
T
3
T
3
T
3
T
3
T
3
T
3
T
3
T
3
404
T
3
T
3
T
3
T
3
T
3
T
3
T
3
T
3
T
3
T
3
T
3
T
3
T
3
T2
1
7
5
T
3
T
3
T
3
T
3
T
3
T
3
T
3
T
3
T
3
T
3
T
3
T
3
T
3
T
3
T
3
T
3
T
3
T
3
T
3
T
3
T
3
T
3
T
3
T
3
T
3
T
3
T
3
T
3
T
1
7
T
3
T
3
T
3
T
3
T
3
T
3
T
3
T
3
T
3
T
1
7
T
3
T
3
T
3
T
1
7
T
3
T
3
T
3
T
3
T
3
T
3
T
1
7
T
3
T
3
T
3
T
3
T
3
T
3
T
3
T
3
T
3
T
3
T
3
T
1
7
T
3
T
3
T
3
T
3
T
3
T
3
T
3
T
3
T
3
T
3
T
3
T
3
T
3
T
3
T
1
7
T
1
7
T
3
T
3
T
3
T
3
T
3
T
3
T
3
T
3
T
3
T
3
T
3
T
3
T
3
T
3
T
3
T
3
T
3
T
3
T
3
T
3
T
3
T
3
T
3
T
3
T
3
T
3
T
3
T
3
T
3
T
3
T
3
T
3
T
3
T
3
T
3
T
3
T
3
T
3
T
3
T
3
T
3
T
3
T
1
7
T
3
T
3
T
3
T
1
7
T
3
T
3
T
3
T
3
T
3
T
3
T
3
T
3
T
3
T
3
T
3
T
3
T
3
T
3
T
3
T
3
T
3
T
3
T
3
T
3
T
3
T
3
T
3
T
3
T
3
T
3
T
3
T
3
T
3
T
3
T
3
T
3
T
3
T
3
T
3
T
3
T
3
T
3
T
3
T
3
T
3
T
3
T
3
T
3
T
3
T
3
T
3
T
3
T
3
T
3
T
3
T
3
T
3
T
3
T
3
T
3
T
3
T
3
T
3
T
1
7
T
3
T
3
T
3
T
3
T
3
T
3
T
3
T
3
T
1
7
T
3
T
3
T
3
T
3
T
3
T
3
T
3
T
3
T
1
7
T
3
T
3
T
3
T
3
T
3
T
1
7
T
3
T
3
T
3
T
3
T
3
T
3
T
3
T
3
T
3
T
3
T
3
T
3
T
3
T
3
T
3
T
3
T
3
T
3
T
3
T
3
T
3
T
3
T
3
T
3
T
3
T
3
T
3
T
3
T
3
T
3
T
3
T
3
T
3
T
3
T
3
T
3
T
3
T
3
T
3
T
3
T
3
T
3
T
1
7
T
3
T
3
T
3
T
3
T
3
T
3
T
3
T
3
T
3
T
3
T
3
T
3
T
3
T
3
T
3
T
3
T
3
T
3
T
3
T
3
T
3
T
3
T
3
T
3
T
3
T
3
T
3
T
3
T
3
T
3
T
3
T
3
T
3
T
3
T
3
T
3
T
3
T
3
T
3
T
3
T
3
T
3
T
3
T
3
T
3
T
3
T
3
T
3
T
3
T
3
T
3
T
3
T
3
T
3
T
3
T
3
T
3
T
3
T
3
T
3
T
3
T
3
T
3
T
1
7
T
3
T
3
T
3
T
3
T
3
T
3
T
3
T
3
T
3
T
3
T
3
T
3
T
3
T
3
T
3
T
3
T
1
7
T
3
T
3
T
3
T
3
T
3
T
3
T
3
T
3
T
3
T
3
T
3
T
3
T
3
T
3
T
3
T
3
T
3
T
3
T
3
T
3
T
3
T
3
T
3
T
3
T
3
T
3
T
3
4. Results and discussion
The velocity structural model along the
profile T1
T
3
T
3
T
3
T
3
T
3
T
3
T
3
T
3
T
1
7
T
3
T
3
T
3
T
3
T
3
T
3
T
3
T
3
T
3
T
3
T
3
T
3
T
3
T
3
T
3
T
3
T
3
T
3
T
3
T
3
T
1
7
T
3
T
3
T
3
T
3
T
3
T
3
T
3
T
3
T
3
T
3
T
3
T
3
T
3
T2
1
7
5
T
3
T
3
T
3
T
3
T
3
T
1
7
T
3
T
3
T
3
T
3
T
3
T
3
T
3
T
1
7
T
3
T
3
T
3
T
3
T
3
T
3
T
3
T
3
T
3
T
3
T
1
7
T
3
T
3
T
3
T
3
T
3
T
3
T
3
T
3
T
3
T
3
T
1
7
T
3
T
3
T
3
T
3
T
3
T
1
7
T
3
T
3
T
3
T
3
T
3
T
3
T
3
T
3
T
3
T
3
T
3
T
3
T
3
T
3
T
3
T
3
T
3
T
3
T
3
T
3
T
3
T
3
T
3
T
3
T
3
T
3
T
3
T
3
T
3
T
3
T
3
T
3
T
3
T
3
T
3
T
3
T
3
T
3
T
3
T
3
T
3
T
3
T
3
T
3
T
3
T
3
T
3
T
1
7
T
3
T
3
T
3
T
3
T
3
T
1
7
T
3
T
3
T
3
T
3
T
3
T
3
T
3
T
3
T
3
T
3
T
3
T
3
T
3
T
3
T
3
T
3
T
1
7
T
3
T
3
T
3
T
3
T
3
T
3
T
3
T
3
T
3
T
3
T
3
T
3
T
3
T
3
T
3
T
3
T
3
T
3
T
3
T
3
T
3
T
3
T
3
T
3
T
3
T
3
T
3
T
3
T
3
T
3
T
3
T
3
T
3
T
3
T
3
T
3
T
1
7
T
3
T
3
T
3
T
3
T
3
T
3
T
3
T
3
T
3
T
3
T
3
T
3
T
3
T
3
T
3
T
1
7
T
1
7
T
3
T
3
T
3
T
3
T
3
T
3
T
1
7
T
3
T
1
7
T
3
T
3
T
3
T
1
7
T
3
T
3
T
3
T
3
T
3
T
3
T
3
T
3
T7
3
1
T
3
T
3
T
3
T
3
T
3
T
3
T
3
T
3
T
3
T
3
T
3
T
3
T
3
T
3
T
3
T
3
T
3
T
3
T
3
T
3
T
3
T
3
T
3
T
3
T
3
T
3
T
3
T
3
T
3
T
3
T
3
T
3
T
3
T
3
T
3
T
5
2
T
3
T
3
T
3
T
3
T
3
T
3
T
3
T
3
T
3
T
3
T
3
T
3
T
3
T
3
T
3
T
3
T
3
T
3
T
3
T
3
T
3
T
3
T
3
T
3
T
3
T
3
T
3
T
3
T
3
T
3
T
3
T
3
T
3
T
3
T
3
T
3
T
3
T
3
T
3
T
3
T
3
T
3
T
3
T
3
T
3
T
3
T
3
T
3
T
3
T
3
T
3
T
3
T
3
T
3
T
3
T
3
T
3
T
3
T
3
T
3
T
3
T
3
T
3
T
3
T
3
T
3
T
3
T
3
T
3
T
3
T
3
T
3
T
3
T
1
7
T
3
T
3
T
3
T
3
T
3
T
3
T
3
T
3
T
3
T
3
T
1
7
T
3
T
3
T
1
7
T
3
T
3
T
3
T
3
T
3
T
3
T
3
T
3
T
3
T
3
T
3
T
3
T
3
T
3
T
3
T
3
T
3
T
3
T
1
7
T
3
T
3
T
3
T
3
T
1
7
T
3
T
3
T
3
T
3
T
3
T
3
T
3
T
3
T
3
T
3
T
3
T
1
7
T
3
T
3
T
3
T
1
7
T
3
T
3
T
3
T
3
T
3
T
3
T
3
T
3
T
3
T
3
T
3
T
3
T
3
T
1
7
T
3
T
3
T
3
T
3
T
3
T
3
T
3
T
3
T
3
T
3
T
3
T
3
T
3
T
3
T
3
T
3
T
3
T
3
T
3
T
3
T
3
T
3
T
3
T
3
T
3
T
3
T
3
T
3
T
3
T
3
It may become the reason for the algorithm to
work unstably. In brief, to find the model ch
aracterized by a small deviation between the t
heoretical and observation travel times as well
as better consistent with the real environment,
the alteration of a number of layers and the ve
locities is needed. With the abovementioned purpose, the calculations were perf
ormed by the combination of the automatic mi
and
the
computer
nimization
interpreter conversation during the analysis.
The experiences showed that, the iterative cal
culations can be terminated when the deviatio
n between the theoretical and observation trav
el times is small enough, or it approaches a m
ostly constant value in the next several iteratio
ns. Using the results from the calculations in t
his study, the velocity structural models under
4 profiles were constructed. The tectonic char
acteristics of the study area are reflected in the
se models. An average square error generated
during the calculations is ranged from 11.2 to
21.2 ms. Since the longest source receiver travel times along the profiles ranges
from 1500 to 1851 ms, the error derived from
the calculations in this study is small enough
and can be accepted.
T
5
2
After entering the travel time data into the
program
Plotrefa
the
time
distance graph is generated. The modeling is
carried
out
in
two
stages.
A
simple three layered model is constructed in t
he first stage with the velocity determination f
or each layer based on the slope of near straig
segments
on
the
time
ht
distance graph. If the environment is reflected
by more than three layers on the graph, the co
uplement of several near straight segments wit
a
h
small difference in their slope is applied to ge
nerate a common segment. In such a
way we can roughly estimate the velocity cha
nge with depths, including the smallest and g
reatest values referred to the velocity of subsu
rface and an average velocity of the deepest la
yers of the environment. The derived paramet
ers are now accepted as the input data for mo
deling by using the seismic tomographic techn
ique in the second stage. In this case, an arbitr
ary multilayered model can be applied to gene
rate the initial model with the minimum, maxi
mum velocities and the values of the depth to
the deepest interface accepted from the first st
age. Now the modelling can be solved by the
finiteelement algorithm in combination with the lea
st square technique. In this study, multitime iterative calculation was carried out with
the number of layers changed within a range 1
5
30 layers; the parameters such as the smalles
t and greatest velocities were also changed in
different iterative calculations. Since the algor
ithm accepted a constant velocity for each lay
er, so increase of a number of layers allows cr
eating a model, better consistent with the real
environment. However, an increase of a numb
er of layers is involved the increase of the par
ameters participated in the minimizing proces
s.
T
3
T
3
T
3
Along the north - south direction, the
profile T1 started from the northern flank of
the sub parallel fault distributed more than
4 km to the north of the Khe Giua - Vinh Linh
fault (F1), then passed the hot water spring
Bang and continued to the south more than
5 km. The largest source - receiver travel time
recorded by the instrument at the south end
point of the profile reached 1851 ms with the
explosion at northern end. The deviation
between the theoretical and observation travel
times in term of an average square error
corresponded to the resulted model is
Tran Anh Vu, et al./Vietnam Journal of Earth Sciences 38 (2016)
19.5 ms (fig. 9a). According to the velocity
distributions (fig. 9b), a large subsidence
structure occupied the section mostly from
northern end to the position >7000 m along
the profile is detected. The remain southern
section of the profile is an uplifted block with
the basement consist of hard rocks which
reflected by the high value of velocity of
about 6.4 km/s. Based on the velocity
distribution in the seismic section, the
structural model can be divided into layers as
follows:
The first or subsurface layer is
characterized by very rapidly increase of the
velocity with increasing depth in the
subsidence block. In a thin layer with the
thickness estimated of 200 m at the northern,
60 - 70 m at the middle and approximately
400 m at the southern segments of the profile
the velocity varies from 3.0 - 4.1 km/s. The
above-mentioned velocity range is probably
related to the well weathered product in the
shallower depth and not completely weathered
soil in the deeper section.
Figure 9A. Deviation between the theoretical and observation time - distance curves of profile T1
T
3
T
3
T
3
T
3
T
3
T
3
T
3
T
3
T
3
T
3
T
3
T
3
T
3
T
3
T
3
T
3
T
3
T
3
T
3
T
3
T
3
T
3
T
3
T
3
T
3
T
3
T
3
Figure 9B. Seismic velocity structural model under profile T1
T
3
T
3
T
3
T
3
T
3
T
3
T
3
T
3
T
3
Much slowly increase of the velocity with
depth is the indication of the separation of the
second layer from the others. It’s values vary
from 4.1 km/s to 5.1 - 5.2 km/s in a layer
with thickness of up to 1600 m (from the
depths of 200 m to 1800 m) in the subsidence
block. The layer became much thinner with
200 - 300 m in thickness in the uplifted block
T
3
T
3
T
3
T
3
T
3
T
3
T
3
T
3
at the remained southern section. Thus the
basement of the uplift is revealed at shallow
depths from 500 m to 650 m. According to
the recent magneto-telluric data, at the
horizon of 1500 - 1600 m deep in the
subsidence block is revealed the boundary
which separates the overlying high resistivity
405
Vietnam Journal of Earth Sciences Vol.38 (4) 394-409
from the underlying low resistivity layers
(Doan Van Tuyen et al., 2015; 2016).
The higher velocity gradient in comparison
with the second layer is demonstrated again in
the third layer. With less than 1 km in
thickness, inside the subsidence structure, the
layer is characterized by the velocity about 5.2
km/s at the depth of 1800 m and increased up
to 6.0 km/s at the depth 2700 m along the
bottom of the layer. In the uplifted block
along the southern segment, the thickness of
the layer is strongly decreased to 200 - 300 m.
The deepest layer that can be seen in the se
ismic section is reflected by the velocity range
of
6.0
6.2 km/s in the area of subsidence block. Ho
wever a more complicated feature is indicated
by the velocity distribution in the basement of
the southern uplifted structural block. Here, i
nside the well consolidated rocks in the basem
ent which reflected by the velocity of more th
an 6.4 km/s, a narrow vertical structure with 1
.3 km wide appeared and represented by lower
velocity
of
6.0
6.2 km/s. This phenomenon may be related to
the fracture zone developed inside the basem
ent and possibly contained some water content
. The area with the low velocity structure is lo
cated in the south of the northwest southeast trending fault F6 as well as between
two
sub
meridian faults F8 and F9. According to the e
xperiences from the studies of geothermal sou
rces (Honjas et. Al., 1997; Uruh, 2001) and th
results
of
recent
magnetoe
telluric investigations (Doan Van Tuyen et al.,
2015) the section occupied by the lower velo
city structure is directly above the geothermal
reservoir predicted from the depth >2 km.
From the correlation between the seismic and
tectonic data we can see the clearest vertical
boundary detected by the seismic data is the F
6 fault. It also plays a role of a boundary whic
h separates the southern strong uplifted from t
he northern subsidence blocks along the profil
T
3
T
3
T
3
T
3
T
3
T
3
T
3
T
3
T
3
T
3
T
3
T
3
T
3
T
3
T
3
T
3
T
3
T
3
T
3
T
3
T
3
T
3
T
3
T
3
T
3
T
3
T
3
T
3
T
3
T
3
T
3
T
3
T
3
T
3
T
3
T
3
T
3
T
3
T
3
T
3
T
3
T
3
T
3
T
3
T
3
T
3
T
1
7
T
1
7
T
3
T
3
T
3
T
3
T
3
T
1
7
T
3
T
1
7
T
3
T
3
T
3
T
3
T
3
T
3
T
3
T
3
T
3
T
3
T
3
T
3
T
3
T
1
7
T
1
7
T
3
T
3
T
3
T
3
T
3
T
3
T
3
T
3
T
1
7
T
3
T
3
T
3
T
3
T
3
T
3
T
3
T
3
T
3
T
3
T
3
T
3
T
3
T
3
T
3
T
1
7
T
1
7
T
3
T
3
T
1
7
T
3
T
3
T
3
T
3
T
3
T
3
T
3
T
3
T
3
T
1
7
406
T
3
T
3
T
3
T
3
T
3
T
3
T
3
T
3
T
3
T
3
T
3
T
3
T
3
T
3
T
3
T
3
T
3
T
3
T
3
T
1
7
T
3
T
3
T
3
T
3
T
3
T
3
T
3
T
3
T
3
T
3
T
3
T
3
T
3
T
3
T
3
T
3
T
3
T
3
T
3
T
1
7
T
3
T
3
T
3
T
1
7
T
3
T
3
T
3
T
3
T
3
T
3
T
3
T
3
T
3
T
1
7
T
3
T
3
T
1
7
T
3
T
3
T
3
T
3
T
3
T
3
T
3
T
1
7
T
3
T
3
T
3
T
3
T
3
T
3
T
3
T
3
T
3
T
3
T
3
T
1
7
T
1
7
T
3
T
3
T
3
T
3
T
1
7
T
1
7
T
1
7
T
3
T
1
7
T
1
7
T
1
7
T
3
T
3
T
3
T
3
T
3
T
3
T
3
T
1
7
T
3
T
3
T
3
T
3
T
3
T
3
T
3
T
3
T
3
T
3
T
3
T
3
T
3
T
3
T
3
T
3
T
3
T
1
7
T
3
T
3
T
3
T
3
T
3
T
3
T
3
T
3
T
3
T
3
T
3
T
3
T
3
T
3
T
3
T
3
T
3
T
3
T
3
T
3
T
3
T
3
T
1
7
T
3
T
1
7
T
3
T
3
T
3
T
3
T
3
T
1
7
T
1
7
T
3
T
3
T
3
T4
1
7
3
T
1
7
T
3
4
T
1
7
T
3
T
3
T
3
T
3
T
3
T
3
T
3
T
3
T
3
T
3
T
3
T
3
T
3
T
3
T
3
T
3
T
3
T
3
T
3
T
3
T
3
T
3
T
3
T
3
T
3
T
3
T
3
T
3
T
3
T
3
T
3
T
3
T
3
T
3
T
3
T
3
T
3
T
3
T
3
T
3
T
3
T
3
T
3
T
3
T
3
T
3
T
3
T
3
T
3
T
3
T
3
T
3
T
3
T
3
T
3
T
3
T
3
T
3
T
3
T
1
7
T
3
T
3
T
3
T
3
T
3
T
3
T
3
T
3
T
3
T
3
T
3
T
3
T
3
T
3
T
3
T
3
T
3
T
3
T
3
T
3
T
3
T
3
T
3
T
3
T
3
T
3
T
3
T
3
T
3
T
3
T
3
T
3
T
3
T
3
T
3
T
3
T
3
T
3
T
3
T
3
T
3
T
3
T
3
T
3
T
3
T
3
T
1
7
T
3
T
1
7
T
3
T
3
T
1
7
T
3
T
1
7
T
3
T
1
7
T
3
T
3
T
3
T
3
T
1
7
T
3
T
3
T
3
T
3
T
1
7
T
3
T
3
T
3
T
3
T
3
T
3
T
3
T
1
7
T
3
T
3
T
3
T
1
7
T
3
T
3
T
3
T
1
7
T
3
T
3
T
3
T
1
7
T
3
T
3
4
T
3
T
3
T
3
T
3
T4
1
7
3
T
3
T
3
T
3
T
3
T
3
T
3
T
1
7
T
3
T
3
T
1
7
T
3
T
3
T
3
T
3
T
3
T
3
T
3
T
3
T
3
T
3
T
3
T
1
7
T
3
T
3
T
3
T
3
T
1
7
T
3
T
3
T
1
7
T
3
T
3
T
3
T
3
T
3
T
1
7
T
3
T
3
T
3
T
3
T
3
T
1
7
T
3
T
3
T
3
T
1
7
T
3
T
3
T
3
T
1
7
T
3
T
3
T
3
T
3
T
1
7
T
1
7
T
1
7
T
3
T
3
T
3
T
3
T
3
T
3
T
3
T
3
T
3
T
3
T
1
7
T
3
T
1
7
T
3
T
3
T
3
T
3
T
3
T
3
T
3
T
3
T
3
T
1
7
T
3
T
3
T
3
T
3
T
3
T
3
T
3
T
3
T
3
T
3
T
3
T
3
4
T
1
7
T
3
T
3
T
3
T7
3
4
1
T
3
T
3
T
3
T
3
T
3
T
1
7
T
3
T
3
T
3
T
3
T
3
T
1
7
T
3
T
3
T
3
T
3
T
3
T
3
T
3
T
3
T
3
T
3
T
3
T
3
T
3
T
3
T
3
T
3
T
3
T
3
T
3
T
3
T
3
T
3
T
3
The velocity structural model along the
profile T2
T
1
7
T
3
T
3
T
3
T
3
T
3
T
3
T
3
T
3
T
3
T
3
T
3
T
3
T
3
T
3
T
3
T
3
T
3
T
3
T
3
T
3
T
3
T
3
T
3
T
3
T
3
T
3
T
3
T
3
T
3
T
3
T
3
T
3
T
3
T
3
T
3
T
3
T
3
T
3
T
3
T
3
T
3
T
3
T
3
T
3
T
3
T
3
T
3
T
3
T
3
T
3
T
3
T
3
T
3
T
3
T
3
T
3
3
T
T
3
T
3
T
3
T
3
T
3
T
3
T
3
T
3
T
3
T
3
T
3
T
3
T
3
T
3
T
3
T
3
T
3
T
3
T
3
T
3
T
3
T
3
T
3
T
3
T
3
T
3
T
3
T
3
T
3
T
3
T
3
T
3
T
3
T
3
T
3
T
3
T
3
T
3
T
3
T
3
T
3
T
3
T
3
T
3
T
3
T
3
T
3
T
3
T
3
T
3
T
3
T
3
T
3
T
3
T
3
T
3
T
3
T
3
T
3
T
1
7
T
3
T
3
e T1. The strong subsidence cliff revealed by t
he seismic data in the near northern end of the
profile indicates an unnamed fault located to
the North and paralleled the Khe Giua Vinh Linh fault F1. It is noted that, in the seis
mic section the fault F1 is reflected by the sub
sidence wall developed just in the shallow lay
ers from surface to the depth of 1.3 km at the
position
4500
5000 m along the profile, meanwhile the auxi
liary fault also paralleled the F1 but located in
it’s south is revealed in the only deeper sectio
n at the position >4600m along the profile T1.
The southwest - northeast direction profile
T2 is cutting the profile T1 at the point 5400
m accounted from its southwest end, then
passing the location distributed to the North of
the Bang spring about 1500 m. The velocity in
the seismic section varies from less than 3.0
km/s to 6.4 km/s (fig. 10). According to the
velocity structures, in the section stretching
from the southwest end to the position 3500 4000 m along the profile T2 a strong uplifted
block which consists of well consolidated
rocks in the basement and clearly reflected by
the high velocity is revealed. Closed to the
southwest end of the profile the hard rock
estimated by the velocity 6.4 km/s is
distributed at the depth of approximately
500 m. The uplift tendency continues up to
200 m depth in the next segment and
terminated by the tectonic fault F6. From this
point to the position 7000 m along the profile
the subsidence structure is detected by the
refraction boundary distributed at the depth of
2.1 km with the velocity reaching 6.0 km/s.
The stronger subsidence revealed at the last
northeast segment of the profile with the
refraction interface distributed at the depth of
2 km, which is reflected by the low velocity
values of 5.1-5.2 km/s. Here the boundary of
velocity higher than 6.0 km/s is revealed in
Tran Anh Vu, et al./Vietnam Journal of Earth Sciences 38 (2016)
the central section, then sank deeper and can
not be detected by the seismic investigations
in this study. The transition zone
characterized by the change of velocity from
5.6-5.7 km/s to lower than 5.3-5.4 km/s,
detected at the position 7000-7500 m along
the profile, is the place occupied by the Khe
Giua - Vinh Linh fault (F1). Based on the
velocity distributions under profile T2, the
structures can be divided into three main
blocks with relatively strong subsidence
tendency from southwest to northeast. The
thickness of every layer is also increased
along this direction, meanwhile the
consolidation degree of the rocks is inversely
decreased. The similar features are
demonstrated by the velocity structures in the
seismic sections of profiles T3 and T4. The
direction of these profiles is mostly the same
with profile T2, but their shorter length is the
reason to limit the investigation depth. The
velocity range appeared in the seismic
sections under the profiles T3 and T4 is
mostly corresponding with the two upper
layers under the other profiles and the third
layer can not be reached by the seismic
investigations along these profiles.
Figure 10. Seismic velocity structural model under profile T2
T
3
T
3
T
3
T
3
T
3
T
3
T
3
T
3
T
3
5. Conclusions
A good quality seismic data was recorded
by all the deployed instruments in the area of
the hot water spring Bang - Quang Binh. The
limitation in length of the measurement
profiles caused by the complexity of the local
condition is restricted the investigation depth
in a range of 2 - 3 km.
The velocity structural models under 4
profiles constructed by the results of data
analysis are consistent with the structural
feature of the study area. According to these
models, the strong uplifted block constituted
from hard rocks in their basement is spread
from the fault F6 southwestward. The
T
3
T
3
T
3
T
3
T
3
T
3
T
3
T
3
relatively subsidence structure is revealed in
the area located between the faults F6 and
Khe giua - Vinh Linh (F1); The subsidence
tendency continues to the northeast creating
the most subsidence block in the northeastern
part of the study area.
At the southwestern margin of the fault F6
or the south of the hot water spring Bang in
more than 2 km, a narrow lower velocity
structure is found inside the hard rock block
with 1.3 km wide. Its properties reasonably
referred to the fracture zone and may be
related to the geothermal fluid conducted in
the past geological time. The extension
activity in the Quaternary time is indicated by
407
Vietnam Journal of Earth Sciences Vol.38 (4) 394-409
the restriction of the block bounded by two
sub-meridian faults in this area. This sign
fortifies confidence about the existence of the
geothermal reservoir from depth >2 km
predicted by the recent magneto-telluric.
The results of seismic data analysis in this
study can be accepted as a first product, since
the software used for data analysis indicates
some limitations, such as the program is just
working with the data collected in an equidist
ance network of points. In addition, the use of
nonstraight lines of the investigation profiles is th
e reason to obtain the higher velocity in comp
arison with the real value. A more improveme
nt of the data analysis can be done if the corre
ction of the travel times will be applied to red
the
effect
of
the
nonuce
straight profiles as well as use of more approp
riate software, including the program for 3D i
nversion.
T
3
T
3
T
3
T
3
T
3
T
3
T
3
T
3
T
3
T
3
T
3
T
3
T
3
T
3
T
3
T
3
T
3
T
3
T
3
T
3
T
3
T
3
T
3
T
3
T
3
T
3
T
3
T
3
T
3
T
3
T
3
T
3
T
3
T
3
T
3
T
3
T
3
T
3
T
3
T
3
T
3
T
3
T
3
T
3
T
3
T
3
T
3
T
3
T
3
T
3
T
3
T
3
T
3
T
3
T
3
T
3
T
3
T
3
T
3
T
3
T
3
T
3
T
3
T
3
T
3
T
3
T
3
T
3
T
3
T
3
T
3
T
3
T
3
T
3
T
1
7
T
3
T
3
T
3
T
3
T
3
T
3
T
3
T
3
T
3
T
3
T
3
T
3
T
3
T
3
T
3
T2
1
7
5
T
3
T
3
T
3
T
3
T
3
T
3
T
3
T
3
T
3
Acknowledgements
This work is supported by the Vietnam
National project (KC08.16/11-15).
The
authors would like to express the gratefulness
for this support. We also sincerely thank
Huang Bor-Shouh and his colleagues: Liu.
Yang, Lin
from the Institute of Earth
Sciences, Academia Sinica, Taiwan for
providing the seismic instruments as well as
their active participation in the field work
during the investigations.
T
3
T
3
T
1
7
T
1
7
T
9
5
T
9
5
Dinh van Toan, Steven Harder, Pham Nang Vu, Trinh
References
Viet Bac, Doan Van Tuyen, Lai Hop Phong, Tran
Berryman J. G., 1991, Lecture Notes on nonlinear
inversion and tomography. Earth Resources
Laboratory, Massachusetts Institute of Technology,
USA, pp. 164.
Ester Z., Darko V., 2010, A careful blasting technique
during construction of underground opening
for
nuclear
waste
repository.
Pub.
of
University
of
Zagreb,
Croatia,
s/collectionStor
e/public/29/064/29064418.pdf, 384-390.
T
9
5
T
9
5
408
T
3
T
3
T
3
T
3
T
3
T
3
T
3
T
3
T
3
T
3
T
3
T
3
T
3
T
3
T
3
T
3
T
3
T
3
T
3
T
3
T
3
T
3
T
3
T
3
T
3
T
3
T
1
7
T
3
T
3
T
3
T
3
T
1
7
T
3
T
3
T
3
T
3
T
3
T
3
T
3
T
3
T
3
T
3
T
3
T
3
T
3
T
3
T
3
T
1
7
T
3
T
3
T
3
T
3
T
3
T
3
T
3
T
3
T
3
T
3
T
3
T
3
T
3
T
3
T
3
T
3
T
3
T
3
T
3
T
3
T
3
T
3
T
3
T
3
T
3
T
3
T
3
T
1
7
T
3
T
3
T
3
T
3
T
3
T
3
T
5
2
T
3
T
3
T
3
T
3
T
3
T
3
T
3
T
3
T
3
T
3
T
3
T
3
T
3
T
3
T
3
T
3
T
3
T
3
T
3
T
3
T
3
T
3
T
3
T
3
T
3
T
3
T
3
T
3
T
3
T
3
T
3
T
3
T
3
Flynn T., Quy H. H., 1997. Assessment of the
geothermal resources of Socialist Republic of
Vietnam.
Geothermal
resources
Council
Transactions, vol.21, 341-345.
Hoang Huu Quy, 1998. Overview of the Geothermal
potential of Vietnam. Geothermics, Vol.27, n.1,
109-115.
Honjas W., Pullammanappallil S. K., Lettis W. R., Plank
G. L., Louie J. N., and Dchweichert R., 1997,
Predicting subsurface structure within the Dixie
Valley geothermal field, Dixie Valley, Nevada,
using
a
non-linear
optimization
scheme:
Geothermal Resource Council Bullentin, v. 26, p.
45-52.
Pullammanappallil S. K., and Louie J. N., 1994,
Generalized simulated-annealing optimization for
inversion of first arrival times. Bullentin of the
seismological society of America, v.84, 1397-1409.
Harder Steven, Van Toan Dinh, 2011. Collecting Deep
Seismic Data in Densely Populated Vietnam. EOS,
Transaction; American Geophysical Union, Vol. 92,
No 3, 21-22, 18/1/2011.
Thorne Lay, Terry C. Wallace, 1995. Modern global
Seismology. Academic Press. Inc., San Diego,
California 521 pp.
Mai Thanh Tan, 2011. Seismic Prospecting.
Transportation publishing house, Hanoi, 524pages
(in Vietnamese).
Tesarik D. R., W. A. Hustrulid, and U. Nyberg,
2010, Assessment and application of a single-charge
blast
test
at
the
Kurina
mine,
Sweden,
sh/minning/user
files/works/aaaoa.pdf.
Anh Vu, Nguyen Thi Hong Quang, 2008. The first
deep seismic investigations in North Vietnam.
Vietnam J. of Geology, series B, N31-32, 213-219.
Dinh Van Toan, Steven Harder, 2008, Near-vertical
Moho reflections under Hanoi Basin, Vietnam. EOS
Trans. 89(53), AGU Fall meeting Supplement
abstract S13D-03.
Dinh Van Toan (project manager), et al., 2010. Study on
deep crustal structures of Northern Vietnam with the
purpose to obtain a more confidence in the
Tran Anh Vu, et al./Vietnam Journal of Earth Sciences 38 (2016)
geological hazard prediction by using deep seismic
and magneto-telluric investigations. Final report of
National project (Code KC.08.16/11-15), 228 pages,
Hanoi, Institute of Geological Sciences.
Dinh van Toan, Steven Harder, Trinh Viet Bac, Doan
Van Tuyen, Lai Hop Phong, Tran Anh Vu, Nguyen
Thi Hong Quang, 2011. Study on the Earth crustal
structure by the seismic refraction data collected
along two profiles in Northern Vietnam. Vietnam
Journal of Earth Sciences, T33(3), 538 - 548.
Tran Van Tri (Project manager), et al., 2004. Map of
geology and mineral resources of Vietnam on scale
1:1,000,000. Publication of the Department of
Geology and mineral recources of Vietnam, Hanoi
(in Vietnamese).
Doan Van Tuyen, Dinh Van Toan, Trinh Viet Bac,
2008. The study of geothermal resources to develop
clean energy in Vietnam. Vietnam Journal of Earth
Sciences, 30(2), 153-160.
Doan Van Tuyen, Tran Anh Vu, Lai Hop Phong, Le Van
Si, Pham Ngoc Dat, Duong Thi Ninh, Dinh Van
Toan, Nguyen Thi Hong Quang, 2015. Results of
magneto-telluric survey for studying geothermal
system in area Bang - Quang Binh province Vietnam
Journal of Earth Sciences 37(1), 48-56.
Doan Van Tuyen, Tran Anh Vu, Lai Hop Phong, Dinh
Van Toan, Le Van Si, 2015. Structural Features of
Geothermal Field from Magneto-telluric Survey in
Northern Central Region of Vietnam. Proceedings of
World Geothermal Congress 2015, Melbourne,
Australia,
1-25
April
2015,
Online />.
Doan Van Tuyen ( project manager),et al. 2016. A study
of the potential geothermal resources for energy
development in Vietnam. National project (Code
KC.08.16/11-15), final report, 228 pages, Hanoi,
Institute of Geological Sciences ( in Vietnamese).
Reynods J. M., 2011, An introduction to applied and
environmental geophysics. John Wiley & Son, Ltd.,
Chichester, 2nd ed., 712 pp.
Udias Agustin, 1999. Principles of Seismology.
Cambridge University Press, 475 pp.
Uruh J. R., Pullammanappallil S. K., and Honjas W.,
2001. New seismic imaging of the geothermal field,
eastern California: Proceedings of the 26th workshop
on Geothermal Reservoir Engineering, Standford
University, CA, January 29-30.
White D. J., 1989. Two dimensional seismic refraction
tomography. Geophys. J. Int., 97, 223- 245.
Zelt Colin A., 1999. Modelling strategies and model
assessment for wide-angle seismic traveltime data.
Geophys. J. Int., 139, 183-204.
T
9
5
T
9
5
P
P
P
P
409