Density and nitrifying potential of indigenous bacterial community in mangrove and seagrass in the north of vietnam
Bạn đang xem bản rút gọn của tài liệu. Xem và tải ngay bản đầy đủ của tài liệu tại đây (581.01 KB, 9 trang )
Vietnam Journal of Marine Science and Technology; Vol. 20, No. 4; 2020: 437–445
DOI: /> />
Density and nitrifying potential of indigenous bacterial community
in mangrove and seagrass in the north of Vietnam
Le Thanh Huyen1, Dao Thi Anh Tuyet2, Le Minh Hiep2, Nguyen Tien Dat2, Ha Thi Binh2, Do
Trung Sy3, Do Manh Hao1,2,*
1
Graduate University of Science and Technology, VAST, Vietnam
Institute of Marine Environment and Resources, VAST, Vietnam
3
Institute of Chemistry, VAST, Vietnam
*
E-mail:
2
Received: 23 June 2020; Accepted: 19 August 2020
©2020 Vietnam Academy of Science and Technology (VAST)
Abstract
Density and nitrification potential of indigenous microorganism in mangroves (Tien Yen - Quang Ninh and
Bang La - Hai Phong) and seagrass (Ha Coi, Dam Ha - Quang Ninh and Tam Giang - Thua Thien Hue) in
the north of Vietnam were evaluated through 4 sampling times in the dry and rainy seasons in the years of
2017-2019. The analytical results showed that the average density of nitrifying bacteria was 4.6 ± 1.8 × 10²
MPN/ml, in which the density in mangroves tended to be higher than that in the seagrass beds (P < 0.05) in
both the rainy and dry seasons. The average nitrifying rate was 2.7 ± 0.6 µgN/g wet soil/hour, in which the
rate in mangroves tended to be higher than that in seagrass beds in the rainy season (P < 0.05). Nitrifying
density and rate are not only correlated with substrate concentration but also with other environmental
factors such as P-PO4, BOD5, total phosphate in sediment and total bacterial density.
Keywords: Nitrifying bacteria, density, speed, mangrove forest, seagrass beds, north of Vietnam.
Citation: Le Thanh Huyen, Dao Thi Anh Tuyet, Le Minh Hiep, Nguyen Tien Dat, Ha Thi Binh, Do Trung Sy, Do Manh
Hao, 2020. Density and nitrifying potential of indigenous bacterial community in mangrove and seagrass in the north of
Vietnam. Vietnam Journal of Marine Science and Technology, 20(4), 437–445.
437
Le Thanh Huyen et al.
INTRODUCTION
The concentration of inorganic nitrogen
substances in estuary and coastal areas has been
increasing in recent years due to increasing
discharge of wastewater from agriculture,
aquaculture and residential areas from the
domestic activities [1]. High concentrations of
the pollutants lead to eutrophication in many
estuarine areas and can even be directly toxic to
organisms [2]. High concentrations of
ammonium and nitrite can disrupt metabolic
processes and inhibit oxygen transport in the
body, thus greatly affecting the survival, growth
and resistance of the organism [3, 4].
Nitrification is a two-stage oxidization
process from ammonium to nitrate and plays an
important role in the nitrogen cycle and natural
ecosystems. In the first stage, ammonium is
oxidized to nitrite by ammonium oxidizing
bacteria, mainly bacteria species belonging to
the genus Nitrosomonas. In the second stage,
nitrite is oxidized to nitrate by nitrite oxidizing
bacteria, mainly bacteria group belonging to the
genus Nitrobacter [5]. Through nitrification,
inorganic nitrogen contaminants are partially
removed (self-cleaning process). Although
there have been some studies evaluating the
nitrification potential in some marine areas
such as Kim et al., (1997) in Hiroshima Bay,
Japan [5], Magalhães et al., (2005) in the Douro
estuary, Portugal [2], but there are not any
studies on evaluating the nitrifying potential in
the mangrove and seagrass ecosystems.
Therefore, the study on evaluating the density,
self-cleaning potential of ammonium and nitrite
pollutants and evaluating the effects of
environmental factors on the density and
self-cleaning potential of the indigenous
microorganism in coastal areas in general, in
mangroves and seagrass in particular has high
scientific and practical significance. The
research results will be the scientific basis for
proposing solutions to improve self-cleaning
capacity for coastal ecosystems.
MATERIALS AND METHODS
Site and sampling time
Samples were collected at five areas
representing the mangrove ecosystems (Tien
Yen - Quang Ninh and Bang La - Hai Phong)
438
and seagrass ecosystems (Ha Coi, Dam Ha Quang Ninh and Tam Giang - Thua Thien-Hue)
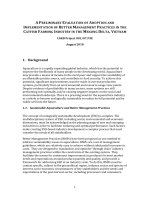
along the northern coast of Vietnam (fig. 1). At
each area, the samples were collected at 9
points on 3 different transects (3 points/transect)
in 4 sampling times over a period of 3 years
(2017–2019) in dry season (April) and rainy
season (August).
Sampling methods
Bottom layer water samples were collected
in Bathomet and stored in 1 liter sterilized glass
bottles. Sediment samples were collected by a
Van Veen grab sampler, then a sterile stainless
steel spoon was used to collect surface layer of
sediment into a nylon bag. The collected
samples were stored in cold conditions (4oC)
and transferred to the laboratory for further
treatment.
Environmental variables
Water sample
Concentration of total ammonium nitrogen
(TAN) was measured by the modified
indophenol method, NO2- + NO3- was measured
by the cadmium reduction method. PO43- was
measured
by
ascorbic
acid
method.
Spectrophotometer AP1101 (Apel, Japan) was
used to read results [6].
Biological oxygen demand (BOD5) was
analyzed by the iodometric titration method
according to TCVN 6001-2:2008 [7]. Chemical
oxygen demand (COD) was analyzed by
oxidation method with K2Cr2O7 in acidic
environment according to TCVN 6491-1999 [8].
Total bacteria density was determined by
colony count method, the sample was
cultured on heterotrophic medium at 37 oC for
24 hours [9].
Sediment sample
Total nitrogen (Nts) was analyzed
according to TCVN 6643:2000 [10], total
phosphorus (Pts) was analyzed by colorimetric
method according to TCVN 8940:2011 [11].
Nitrifying bacteria
Density of nitrifying bacteria was analyzed
by most possible number (MPN). Medium
tubes containing diluted samples at different
concentrations are grown on 120 rpm shaker at
30oC. The presence of nitrifying bacteria was
Density and nitrifying potential of indigenous
checked with diphenilamine dye [9]. Bacterial
density was calculated using Mac Crady
statistics table [12].
The culture flask (prepared above) was
divided into 2 groups: the positive group was
supplemented with 20% acetylene gas
(according to the volume ratio v/v), the
negative group did not add acetylene gas. The
experimental vials were grown on a shaker at
120 rpm at 30oC for 4 hours. Nitrification rate
is determined by the difference in TAN content
between positive and negative groups. TAN
concentration was analyzed by modified
indophenol method as described by Aminot et
al., (1996) [13].
Nitrifying potential
Nitrification rate was analyzed by the
acetylene inhibition method as described by Kim
et al., (1997) [5]. Each water sample is filtered
through a 0.2 µm membrane and divided into
150 ml flask each. To prepare for the nitrification
rate analysis experiment, NH4Cl solution was
added to the flasks to give the final concentration
the increase by 0.1 mgN/l and 1.0 mgN/l from
the original concentration of samples [2, 5].
0.3 g of wet soil was weighed into each 50
ml peni vials, a volumetric tube was used to
measure 30 ml of the pre-made incubation
water into the peni vials, which were covered
with a rubber stopper and aluminum mount.
Each experiment was repeated 3 times [2, 5].
Data analysis
Changes
in
environmental
and
microbiological indicators were spatially and
temporally evaluated by T-test method.
Correlation between studied factors was
evaluated by correlation coefficient (Pearson,
R) on Microsoft Excel 2010 software.
CHINA
VIETNAM
Northern
Vietnam
LAOS
THAILAND
Hoang Sa archipelago
Central
Vietnam
CAMBODIA
Southern
Vietnam
Southwest
Vietnam
Truong Sa archipelago
Figure 1. Diagram of the study sites,
mangrove forest,
seagrass
439
Le Thanh Huyen et al.
RESULTS
Environmental quality of water
TAN ranged from 0–110 µgN/l, averaging
45.1 ± 28.9 µgN/l (fig. 2a). There was not
significant difference between rainy and dry
seasons and between mangrove and seagrass
beds (P < 0.05).
Nitrite ranges from 0–30 µgN/l, with an
average of 7.8 ± 8.2 µgN/l (fig. 2b). N-NO2has no seasonal variation, but there is variation
according to the ecosystems, the concentration
of N-NO2- in the seagrass is higher than that in
mangrove in both rainy and dry seasons (P <
0.05).
Nitrates ranged from 1.0 to 80.0 µgN/l,
averaging 11.3 ± 8.2 µgN/l (fig. 2c). NO3varies by season and ecosystem, except in the
rainy season, the NO3- content between
mangroves and seagrass does not differ
significantly (P < 0.05). Seasonally, the
concentration of NO3- in the dry season is
higher than that in the rainy season in both
mangroves and seagrass. According to the
ecosystem, the concentration of NO3- in the
seagrass is higher than that in the mangroves in
the dry season.
Phosphates ranged from 10–50 µgP/l,
averaging 24.8 ± 9.9 µgP/l (figure 2d). The
P-PO43- content fluctuated according to season
and ecosystem (P < 0.05). Seasonally, the
concentration of P-PO43- in the rainy season
was higher than that in the dry season.
Meanwhile, according to the ecosystem, the
P-PO43- concentration in mangrove is higher
than that in seagrass.
Nitrite (mg.l-1)
TAN (mg.l-1)
ASEAN (GTGH ≤ 70 μg.l-1)
ASEAN (GTGH ≤ 55 μg.l-1)
Phosphate (mg.l-1)
Nitrate (mg.l-1)
ASEAN (GTGH ≤ 60 μg.l-1)
ASEAN (GTGH ≤ 60 μg.l-1)
Figure 2. Water quality: (a): TAN, (b): Nitrite, (c): Nitrate, (d): Phosphate
BOD5 ranged from 0.8 mg/l to 2.6 mg/l, with
an average of 1.6 ± 0.4 mg/l (fig. 3a). BOD5 in
mangrove in rainy season is higher than that in
dry season. In dry season, BOD5 in mangrove is
higher than that in seagrass (P < 0.05).
COD ranged from 0.3 mg/l to 7.2 mg/l,
averaging 2.9 ± 1.3 mg/l (fig. 3b). COD
fluctuated according to seasons and ecosystems,
440
except in the dry season between mangrove and
seagrass (P < 0.05). Seasonally, COD in rainy
season in seagrass is higher than in mangrove.
According to the ecosystem, the COD
concentration in mangroves in the dry season is
higher than that in the rainy season, but in
seagrass, the COD in the rainy season is higher
than that in the dry season.
Density and nitrifying potential of indigenous
Assessment of water quality according to
the standard values specified in the standards
for the purpose of aquaculture and aquatic
conservation (figs. 2, 3) shows that the values
of BOD5 COD, nitrite, nitrate in all
monitoring stations satisfy the standard
values while TAN is higher than the standard
limit values in Ha Coi seagrass and the
average phosphate at most monitoring points
is above the standard limit values. However,
according to QCVN 10-MT:2015/BTNMT,
TAN and phosphate are both lower than the
standard limit values (100 µgN/l for TAN and
200 µgP/l for phosphate).
COD (mg.l -1)
BOD5 (mg.l -1)
08-MT:2015/BTNMT (GTGH ≤ 10 mg/l)
08-MT:2015/BTNMT (GTGH ≤ 4 mg/l)
Figure 3. Environmental quality of water: (a): BOD5, (b): COD
Total bacteria density
The total bacteria density ranged from 6.0 ×
104 CFU/ml to 8.0 × 10⁶ CFU/ml, averaging
1.4 ± 0.9 × 10⁶ CFU/ml (fig. 4). In which, the
average density of the total bacteria group in
the mangrove is 1.9 ± 1.1 × 10⁶ CFU/ml, the
average density of the total bacteria in the
seagrass is 1.0 ± 0.7 × 10⁶ CFU/ml.
Total bacteria density (CFU/ml)
Figure 4. Total bacteria density
Over time, the total density of bacteria in
the rainy season was higher than that in the dry
season in both ecosystems (P < 0.05).
According to the space, the total density of
bacteria in the mangrove is higher than that in
seagrass in both seasons (P < 0.05).
441
Le Thanh Huyen et al.
Environmental quality of sediment
Nts ranged from 0.4–1.8 g/dry soil kg,
averaging 1.1 ± 0.4 g/dry soil kg (fig. 5a). Nts
in mangrove has no difference between rainy
season and dry season; but in seagrass Nts in
dry season is greater than that in rainy season.
According to the ecosystem, Nts in dry season
in seagrass is higher than that in mangrove,
meanwhile there is no difference between
seagrass and mangrove in rainy season.
Pts ranged from 0.1–0.5 g/dry soil kg,
averaging 0.25 ± 0.1 g/dry soil kg (fig. 5b). Pts
value was not different between rainy and dry
seasons and between two ecosystems (P < 0.05).
Nts (mg.l-1)
Pts (mg.l-1)
Figure 5. Environment quality of sediment. (a): Nts, (b): Pts
average density of nitrifying bacteria in
mangroves is 5.5 ± 1.8 × 10² MPN/ml and in
seagrass is 3.7 ± 1.9 × 10² MPN/ml.
MPN.ml-1
Nitrifying bacteria density
The density of nitrifying bacteria ranged
from 0–1.5 × 10³ MPN/ml, the average was 4.6
± 1.8 × 10² MPN/ml (fig. 6). In which, the
Figure 6. Density of nitrifying bacteria
According to time, the average density of
nitrifying bacteria in seagrass in rainy seasons
is higher than in dry season, but there is not
significant difference in mangrove between dry
442
and rainy seasons (P < 0.05). According to
space, the average density of nitrifying bacteria
in mangrove is higher than that in seagrass in
both seasons (P < 0.05).
Density and nitrifying potential of indigenous
significantly different (P < 0.05) in both the
mangroves and the seagrass. According to
space, the average nitrification rate in mangrove
is higher than that in the seagrass in the rainy
season, but there is no significant difference in
the dry season (P < 0.05).
The average nitrification rate at substrate
concentration supplemented with 0.1 mg/l and
1.0 mg/l did not differ significantly (P < 0.05).
The results of this study showed that the
nitrification rate did not increase when substrate
was added at a high concentration (fig. 7).
µgN/g wet soil/hour
Nitrifying potential
Nitrification rates in the areas ranged from
0.6 µgN/g to 9.9 µgN/g wet soil/hour.
Nitrification rate reached the lowest value in
Tam Giang area and the highest value in Bang
La area. The average rate during the study
period was 2.7 ± 0.6 µgN/g wet soil/hour. In
which, the average rate in the rainy season is
2.7 ± 0.7 µgN/g wet soil/hour, while that in the
dry season is 2.5 ± 0.5 µgN/g wet soil/hour.
Over time, the average rate of nitrification
between the rainy and dry seasons is not
0,1 mg/l
1,0 mg/l
Figure 7. Nitrification potential of microorganisms in mangrove and seagrass
Correlation between environmental factors
and nitrifying bacteria
Correlation between environmental factors
and nitrifying bacteria is presented in table 1.
From this table, it can be seen that the density
of nitrifying bacteria in water has significant
correlation with most environmental factors
with the exception of Pts. Correlation
coefficient between the density of nitrifying
bacteria with P-PO43- is highest, followed by
TAN, N-NO2-, BOD5, Nts and the lowest is
with N-NO3-.
Nitrification rate at supplemental substrate
concentration of 0.1 mg/l was significantly
correlated with most of the environmental
factors with the exception of N-NO3-. In which,
nitrification rate has the highest correlation
with total bacteria, followed by TAN, N-PO43-,
Nts, density of nitrifying bacteria, rate of
nitrification
at
additional
substrate
concentration of 1.0 mg/l, BOD5, COD, Pts and
the lowest with N-NO2-.
The nitrification rate at the supplemental
substrate concentration of 1.0 mg/l was only
significantly correlated with 6/12 survey
parameters. Nitrification rate had no significant
correlation with the total bacteria density,
N-NO2, N-NO3, P-PO4 and BOD5 (R < 0.1; n =
80). Among the correlated parameters, the
nitrification rate was most correlated with Pts,
followed by Nts, the nitrification rate at the
supplemental substrate concentration 0.1 mg/l,
443
Le Thanh Huyen et al.
COD, density of nitrifying bacteria and the
lowest with TAN.
The results of this study showed that the
nitrifying bacterial density and their rate related
to substrate concentrations such as TAN,
N-NO2-, Nts. Other factors can also stimulate
the growth of nitrifying bacteria such as
P-PO43-, BOD5 and total bacteria.
Table 1. Correlation coefficient between the density and activity of nitrifying bacteria
and the environmental factors
No.
1
2
3
4
5
6
7
8
9
10
11
12
Parameter
Nts (mg/kg dry soil)
Pts (mg/ kg dry soil)
TAN (µgN/l)
N-NO2 (µgN/l)
N-NO3 (µgN/l)
P-PO4 (µgP/l)
BOD5 (mg/l)
COD (mg/l)
Total bacteria density
(CFU/ml)
Density of nitrifying
bacteria (MPN/ml)
Nitrification rate when
0.1 mgN/l is added
Nitrification rate when
1.0 mgN/l is added
Nitrifying bacteria
density (MPN/ml)
-0.20 (n = 80)
0.54 (n = 180)
0.41 (n = 180)
0.11 (n = 180)
0.65 (n = 180)
0.37 (n = 180)
-0.18 (n = 180)
0.51 (n = 60)
0.21 (n = 60)
-0.20 (n = 60)
Nitrification rate upon
addition of 1.0 mgN/l
0.33 (n = 60)
0.46 (n = 60)
0.13 (n = 60)
-0.17 (n = 60)
0.40 (n = 180)
0.54 (n = 60)
1.00 (n = 180)
0.29 (n = 60)
0.14 (n = 60)
0.29 (n = 60)
1.00 (n = 60)
0.24 (n = 60)
0.14 (n = 60)
0.24 (n = 60)
1.00 (n = 60)
CONCLUSION
The average density of nitrifying bacteria
was 4.6 ± 1.8 × 10² MPN/ml. In which, the
average density of the bacteria in the mangrove
(5.5 ± 1.8 × 10² MPN/ml) tended to be higher
than in the seagrass (3.7 ± 1.9 × 10² MPN/ml)
in both seasons (P < 0.05). The average
nitrification rate was 2.7 ± 0.6 µgN/g wet
soil/hour, and in the mangrove (3.3 ± 1.1 µgN/g
wet soil/hour) it tended to be higher than in the
seagrass (2.4 ± 0.3 µgN/g wet soil/hour) in the
wet season (P < 0.05).
Nitrifying bacterial density and rate are not
only correlated with substrate concentration
factors but also with other environmental
factors such as P-PO4, BOD5, Pts and total
bacterial density.
Acknowledgments: This article is part of the
research results of the Ph.D. thesis topic of PhD
student Le Thanh Huyen and of sub-component
task
5
under
project
47,
code
VAST.DA47.12/16–19. The authors would like
to express their sincere gratitude to the Vietnam
Academy of Science and Technology (VAST)
and their colleagues’ collaboration at the
444
Nitrification rate upon
addition of 0.1 mgN/l
0.36 (n = 60)
0.15 (n = 60)
0.52 (n = 60)
0.12 (n = 60)
Institute of Marine Resources and Environment
(IMER).
REFERENCES
[1] de Jonge, V. N., Elliott, M., and Orive, E.,
2002. Causes, historical development,
effects and future challenges of a common
environmental problem: eutrophication. In
Nutrients and eutrophication in estuaries
and coastal waters (pp. 1–19). Springer,
Dordrecht. />-017-2464-7_1.
[2] Magalhães, C. M., Joye, S. B., Moreira, R.
M., Wiebe, W. J., and Bordalo, A. A.,
2005. Effect of salinity and inorganic
nitrogen concentrations on nitrification
and denitrification rates in intertidal
sediments and rocky biofilms of the Douro
river estuary, Portugal. Water Research,
39(9), 1783–1794. />j.watres.2005.03.008.
[3] Gross, A., Abutbul, S., and Zilberg, D.,
2004. Acute and Chronic Effects of Nitrite
on white shrimp, Litopenaeus vannamei,
cultured in low‐salinity brackish water.
Journal of the World Aquaculture Society,
Density and nitrifying potential of indigenous
[4]
[5]
[6]
[7]
[8]
[9]
35(3), 315–321. />j.1749-7345.2004.tb00095.x.
Schuler, D. J., 2008. Acute toxicity of
ammonia and nitrite to white shrimp (L.
vannamei) at low salinities. Master thesis,
Virginia Polytechnic Institute and State
University. 53 p.
Kim, D. H., Matsuda, O., and Yamamoto,
T., 1997. Nitrification, denitrification and
nitrate reduction rates in the sediment of
Hiroshima Bay, Japan. Journal of
Oceanography, 53, 317–324.
Doan Bo, 2001. Marine chemistry: Methods
of analyzing sea water chemistry. Hanoi
National University Publisher, 131 p.
TCVN 6001-2:2008. Water quality Determination of biochemical oxygen
demand after n days (BODn) - Part 2:
Method for undiluted samples.
TCVN 6491-1999. Water quality Determination of chemical oxygen demand.
Nguyen Lan Dung, Doan Xuan Loan,
Nguyen Phung Tien, Dang Duc Trach and
Pham Van Ty, 1972. Some research
methods of microbiology - Volume 2.
Science and Technics Publishing House,
Hanoi. 430 p.
[10] TCVN 6643:2000. Soil quality Determination of nitrate nitrogen ,
ammonium nitrogen and total soluble
nitrogen in air-dry soils using calcium
chloride solution as extractant.
[11] TCVN 8940:2011. Soil quality Determination of total phosphorus Colorimetry method.
[12] TCVN 9716:2013. Water quality General guidance on the enumeration of
microorganisms by culture.
[13] Aminot, A., Kirkwood, D. S., and Kerouel,
R., 1997. Determination of ammonia in
seawater by the indophenol-blue method:
Evaluation of the ICES NUTS I/C 5
questionnaire. Marine Chemistry, 56(1–2),
59–75.
/>
445