Pattern of Economic Growth and its Implication for Employment
Bạn đang xem bản rút gọn của tài liệu. Xem và tải ngay bản đầy đủ của tài liệu tại đây (498.11 KB, 26 trang )
Draft for comments
Pattern of Economic Growth and its Implication for Employment
By
Rizwanul Islam1
1. Introduction
While a number of countries of the developing world have witnessed significant
progress in reducing poverty, the stubborn persistence of poverty remains a major
challenge in many countries. Progress in poverty reduction has been quite impressive
in certain parts of Asia, e.g., in the countries of East and South East Asia (ESEA). But
even in some of those countries, it has not been possible to sustain the rate of poverty
reduction when they were hit by shocks like the economic crisis of 1997-98, the food
crisis of 2008 and the global economic crisis that is currently (i.e., during 2008-09)
unfolding. On the other hand, in countries of South Asia, the rate of poverty reduction
has been generally lower than that in countries of ESEA. Countries of sub-Saharan
Africa fare much worse in terms of poverty reduction, and are less likely than others
to achieve the Millennium Development Goal of poverty reduction (viz., one of
cutting poverty by half in 2015 compared to the level in 1990).
Based on some projections (e.g., those by World Bank, 2003), it seems that the MDG
of poverty reduction would be attained at the global level; but doubts remain about
certain regions and countries. If China is excluded from the global calculations, the
percentage below the official poverty line of US$1 per capita per day for the rest of
the world is projected to decline from 28.5 per cent in 1990 to 15.7 per cent in 2015 –
1
The author is Special Adviser on Growth, Employment and Poverty Reduction in the Employment
Sector, International Labour Office, Geneva. The views expressed in the paper do not necessarily
reflect those of the organization with which he is associated. Assistance provided by Irmine Iroko in
compiling the data presented in this paper is gratefully acknowledged. The usual disclaimer applies.
1
thus remaining over half of the 1990 level. And if one broadens the definition of
poverty beyond income poverty to accommodate the multidimensional concept, the
situation looks even less rosy.
The above background has led development practitioners and policy makers at various
levels to look for all possible mechanisms for speeding up the rate of poverty
reduction. And productive employment is recognized as critical in that respect. The
experience of countries that succeeded in reducing poverty significantly and at high
rates indicates the importance of sustained high rates of economic growth in achieving
the result. However, some recent studies (Islam, 2006b; Khan, 2001, and 2007) have
come up with an equally important finding that high growth is not enough; the pattern
and sources of growth and the manner in which its benefits are distributed are
extremely important from the point of view of achieving the goal of poverty
reduction. There are country experiences demonstrating that there is no invariant
relationship between economic growth and poverty reduction, and that variables
relating to employment and labour markets are critical in determining the poverty
reducing outcome of growth2. Empirical exercise based on cross-country data (Islam,
2006a) demonstrates that the employment intensity of economic growth has a
significant influence on the rate of poverty reduction.
One important question in the context of the nexus (mentioned above) between
economic growth, employment and poverty reduction is what is really meant by
employment-intensive growth and whether such growth implies any compromise on
productivity and efficiency through the adoption of primitive/outmoded technology.
Of course, technology is an important element influencing the quantity of
2
See, for example, the country studies in Islam (2006b) and the chapter in that book summarising those
experiences.
2
employment associated with a given amount of output, but not the only one. The
sector composition of output is also important in determining the employment
outcome of growth. Higher growth of sectors that are labour-intensive could lead to
an increase in the employment intensity of growth.
Conceptually, employment intensity of economic growth (as measured by the
elasticity of employment with respect to output) is inversely related to labour
productivity. However, if employment-intensive growth is achieved through higher
growth of labour-intensive sectors, it would not necessarily imply sacrificing labour
productivity altogether. Indeed, it is possible to combine high elasticity of
employment with some increase in labour productivity.
The basic objective of the present paper is to empirically test the proposition that
countries where the pattern of growth was characterized by high growth of labourintensive sectors were the ones that achieved more employment-intensive growth.
Conversely, the countries where the pattern of growth does not exhibit such a
character demonstrate lower employment intensity of growth.
The mirror image of the above relationship between the pattern and employment
intensity of growth is the relative contribution of labour productivity and quantity of
labour in output growth. The countries which exhibit a lower contribution of labour
productivity to output growth are the ones that are characterized by higher
employment intensity of growth. In quest of a pattern of growth that is conducive to a
high rate of employment growth, the present paper would examine whether there are
countries that exhibited high share of employment in output growth and yet were able
to combine employment growth with growth in labour productivity.
3
The paper is organized as follows. Section 2 attempts to clarify some of the
conceptual issues involved in the empirical exercises presented in the paper. Section 3
is devoted to an examination of the sector composition output in selected developing
countries. That would be done at broad sector levels as well as at the sub-sector level
for the manufacturing sector. The basic purpose of the empirical analysis of that
section would be to examine if the experience of employment-intensive growth has a
systematic relationship with the pattern of growth. Section 4 is devoted to an
examination of the relative contribution of labour productivity and quantity of labour
input to output growth. The attempt there would be to see how countries with different
degrees of employment intensity of growth have performed in terms of combining
labour productivity and employment in achieving output growth. Section 5 of the
paper presents a few concluding observations based on its empirical findings.
2. The Conceptual and Analytical Issues Involved
2.1. Measuring employment intensity of output growth through employment elasticity
In order to measure the employment outcome of economic growth, a summary
indicator is needed of the degree of employment growth that is associated with a
given output growth. The term employment intensity of growth is increasingly being
used in that context. A measure of the employment intensity of growth can be
provided by the elasticity of employment with respect to output growth (which is
often referred to as employment elasticity). Quantitative estimates of employment
elasticity are based on the assumption that employment is primarily a function of
output. Based on this assumption, employment elasticity can be measured either
4
arithmetically (i.e., by dividing the proportionate change in employment by the
proportionate change in output during a given period) or by applying the econometric
method of regression analysis where a functional relationship between employment
and output is postulated and estimated.
But in many developing countries, available data on employment, especially for the
informal segment of the economy, often does not reflect the real demand for labour. In
such economies, estimates of employment elasticity for the economy as a whole may
not be very meaningful because a high figure may simply reflect the labour force
taking refuge into low productivity employment of a residual character in the absence
of unemployment benefits. For such countries, the concept and its empirical estimates
may be more meaningful with respect to formal sectors where the assumption of
employment data reflecting the demand for labour labour may be more valid.
When defined in the manner described above, it can be shown that employment
elasticity is inversely related to labour productivity, and an employment elasticity of
greater than one implies a decline in labour productivity (Islam, 2006a; Kapsos,
2005). In order to allow for growth in labour productivity, employment growth must
be lower than output growth, which in turn implies that employment elasticity has to
be lower than unity.
Employment elasticity of a sector reflects two different elements: (i) the composition
of the sector, and (ii) technology used in various lines of production within the sector3.
So, even if there is no change in technology, employment elasticity may change if the
composition of the sector changes because employment elasticity of a sector is the
3
Osmani (2009) develops a methodology to decompose employment elasticity into the effects of these
two factors.
5
weighted average of elasticities of the component sub-sectors (Khan, 2001). Take the
case of the manufacturing sector. If the more labour intensive components have a
greater weight in the sector, the overall elasticity would be correspondingly higher
than in a situation where more capital-intensive components dominate the
manufacturing sector. The same argument would apply for an economy as a whole. If,
for example, manufacturing and service sectors of the economy exhibit higher
employment elasticity compared to agriculture, an increase in the weights of the
former in the GDP would lead to a rise in the overall employment elasticity.
2.2. The sectoral pattern of growth
It follows from the above that if a country’s policy environment is such that its labourintensive industries (or sectors) have a greater incentive to grow at faster rates, it is
quite possible for such industries (or sectors) to assume a greater weight in the
manufacturing sector (or the economy as a whole). And hence, the overall
employment elasticity for the manufacturing sector (or the economy) may rise without
requiring any individual sub-sector (or sector) to adopt more labour-intensive
technology than it is employing at present. All that would be needed to achieve such a
result would be to ensure that the policy environment is conducive to (or at least does
not discriminate against) the growth of the relatively more labour-intensive subsectors.
The above discussion brings one to the issue of the sectoral pattern of economic
growth and development strategies pursued by developing countries. A couple of
points may be made in this regard. First, the historical experience of the present-day
developed countries would show that in the course of their development they
6
generally went through a particular pattern of structural change in their economies,
viz., diminishing share of agriculture in GDP associated with, first, increasing share of
industries followed by an increasing share of services. Some of the late developers,
especially some countries of ESEA (e.g., the Republic of Korea, Malaysia, Thailand,
etc.), also followed very similar pattern.
Different economists have offered different explanations for the observed pattern of
structural changes in an economy as mentioned above; notable amongst them are
Fisher (1939), Clark (1951), Kuznets (1966, 1971) and Kaldor (1966, 1967). The
major differences in their explanations lie in their relative emphasis on demand and
supply side factors. Fisher, Clark and Kuznets focus mainly on the demand side and
base their arguments on changes in the income elasticity of demand for products and
services of different categories. They refer to the famous Engel’s law that income
elasticity of demand for agricultural products is lower than that for manufactured
goods. Likewise, the income elasticity of demand for services is higher than that for
manufactured goods. Hence, with increases in incomes, demand for agricultural goods
would decline and that for manufactured goods would increase. When production
responds to this pattern of changes in demand, the share of agriculture in GDP starts
declining and that of industry starts increasing. At some level of income, the income
elasticity fo demand for services would exceed that for industrial goods, leading to
rapid increases in the share of services in GDP. At that point, the share of industry in
GDP starts declining.
Kaldor brings in some supply side arguments in addition to the above mentioned
demand factor. According to him, agriculture is subject to diminishing returns to land
(which is the major factor of production in that sector), and is thus unable to sustain
7
its growth beyond a point. Industry, on the other hand, is not subject to diminishing
returns to its major factor, and does not face the same constraint as agriculture. This,
coupled with higher income elasticity of demand for industrial products, enables the
industrial sector to act as the engine of growth. And growth in that sector pulls overall
GDP growth through linkage effects. Moreover, as productivity, especially of labour,
is usually higher in manufacturing, higher growth of that sector leads to higher
productivity in the economy as a whole. And unless the pattern of growth in that
sector is very capital-intensive, it would absorb labour transferred from agriculture
which normally has lower productivity. Thus a process of growth starts which is
associated with a gradual transfer of labour from low productivity sectors to higher
productivity sectors4. Critical to the success of this process is the rate of growth of the
manufacturing sector relative to that of agriculture and to that of the overall economy.
It is of course possible to criticise the demand-based explanation of structural change
by bringing in the possibility of trade. In an open economy, demand for manufactured
goods could be met, at least partly, through imports. Hence the manufacturing sector
does not need to grow at the same rate as implied by the growth of demand for such
goods. However, when trade is introduced into the system, one has to also consider
the possibility of exports. And that would bring one to the second point concerning
structural changes that could be envisaged for developing economies. The nature of
the trade regime can actually influence the pattern of industrialization in terms of its
sector composition.
One prediction which follows from the standard theory of international trade is that
greater trade openness should lead labour-abundant countries to specialize in the
4
Islam (2006a) considers such transfer as the first stage in what he calls a “virtuous circle of growth”,
and a major characteristic of pro-poor growth.
8
production and export of goods which intensively utilize their abundant factor, viz.,
labour5. Thus, greater openness should lead to high growth of labour-intensive
industries; and as the weight of such industries in the overall sector increases, there
should be a rise in the employment intensity of output in the manufacturing sector as a
whole. This process should continue until surplus labour gets exhausted and wage
rates start rising, at which point employment elasticity may also start declining.
Neither Kaldor nor the earlier economists (e.g., Clark and Fisher) theorizing about
structural changes in an economy mentioned anything about the composition of the
manufacturing sector and its possible implication for employment. But from the point
of engendering a process of quick transfer of labour from low productivity agriculture
to industry, it is important not only to have high growth of manufacturing but also to
have high growth of employment in that sector. That would be possible when labour
intensive industries have a higher weight in the growth of the manufacturing sector.
Such a pattern of industrialization would, of course, depend on a variety of factors,
e.g., the pattern of demand in the domestic as well as external market, the policy
environment prevailing in an economy, etc.
2.3. Employment-intensive growth and labour productivity6
Mention has already been made above of the inverse relationship between
employment elasticity and labour productivity which implies the possibility of a tradeoff between employment growth and labour productivity. In reality, however, this
5
Data on India and Indonesia presented in Auer and Islam (2006) show the wide range of employment
elasticity for various sub-sectors of manufacturing. Various country studies in Islam (2006b) also show
this.
6
The term labour productivity has been distinguished by A.R. Khan (2002) from output per worker. In
the present paper, the term is used in the sense of output per worker.
9
trade-off does not have to be very serious. One can see this easily if one remembers
that in an accounting framework, both the quantity of labour input and labour
productivity contribute to output growth. Depending on the policies pursued, a
country may be able to achieve a balanced contribution of both these elements
towards output growth. This proposition is explained further below.
For an economy as a whole, output is equal to the product of the labour force
employed and labour productivity. This can be expressed through the following
identity:
Y ≡ L × Y/L,
(1)
where Y and L stand respectively for output and employment.
For small changes, one can write the above as
ΔY = ΔL + ΔY/L,
(2)
where Δ indicates growth rate.
Expression (2) implies that growth in output is the sum of the growth of employed
labour force and growth of labour productivity. Thus, both employment in quantitative
terms and labour productivity can potentially contribute to output growth. Indeed, if
output growth is sufficiently high, there could be scope for substantial increases in
both employment and productivity growth. And that has been the experience of East
and South East Asian economies like those of Rep of Korea, Taiwan, China, Malaysia,
10
and to a lesser extent in Indonesia and Thailand (especially before they were hit by the
East Asian economic crisis in 1997-98).
3. Employment Intensity and Sectoral Pattern of Economic Growth: The Asian
Experience
Recent studies (e.g., Islam, 2002, 2008; Khan, 2001, 2007) have shown that in general
the countries of ESEA region achieved more employment-intensive growth
(demonstrated by higher employment elasticity _both at the aggregate level and for
manufacturing) compared to countries of South Asia. Not only was the degree of
employment intensity lower, but there has been a tendency for that to decline in the
latter set of countries (Islam, 2008). How does this experience look in relation to their
experience with regard to the sectoral pattern of growth? Data presented in Table 1 are
intended to contribute towards an answer to this question. Following up on the
discussion in section 2.2, data on growth of GDP and of manufacturing output for
selected countries of Asia are presented in Table 1.
What comes out clearly from Table 1 is the higher growth of manufacturing output in
relation to GDP growth achieved by the countries of ESEA compared to those of
South Asia. In the Rep of Korea, for example, the elasticity of growth of
manufacturing output with respect to GDP growth was over 2 in the 1960s and
dropped to just below 2 in the 1970s. The figure dropped below 1.5 only during the
1980s. In Malaysia, the figure was between 1.5 and 2 for almost three decades (197096). Indonesia and Thailand also had a similar experience. In contrast, this figure has
been in the range of 1.3 to 1.4 in India, and lower in Pakistan. In Bangladesh and Sri
Lanka, there has been a considerable degree of fluctuation in the elasticity of
11
manufacturing growth with respect to GDP growth. On the whole, not only has
overall economic growth been higher in the countries of ESEA (except Philippines)
than in South Asia, the manufacturing sector has been the major driver of growth in
the former. It thus appears that only those countries were able to achieve a sectoral
pattern of growth outlined by Kaldor (and others like Clark, Fisher and Kuznets as
mentioned in section 2.2). Not surprisingly, they are also the countries that were able
to achieve more employment intensive growth and Lewis type transformation of their
labour markets _ albeit at varying speed7.
In order to get further insight into the sectoral pattern of economic growth, it would be
useful to look at the composition of the manufacturing sector. Using UNIDO data
(Indstat 3, 2005)8, an attempt has been made to rank sub-sectors of manufacturing
industries (at the three-digit level) of various countries according to their capitallabour ratios. Based on such rankings, five most labour-intensive and five most
capital-intensive industries for each country were identified for 1980, 1990 and 2002.
The shares of the five most labour-intensive and five most capital-intensive industries
in total manufacturing value added were then calculated. These shares are presented in
Table 2. The idea behind this exercise is to see whether there has been a systematic
change in the sector composition of the manufacturing sector in either direction.
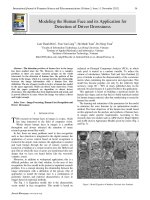
Data presented in Table 2 point out a few interesting aspects of the sectoral pattern of
industrialization in the selected countries of Asia. First, both Rep of Korea and
Malaysia show an increase in the share of labour intensive industries up to 1990 and a
decline thereafter. Korea also experienced a fall in the share of capital-intensive
industries till 1990 and a rise thereafter. In Malaysia, on the other hand, the share of
7
8
See Islam (2008) for an analysis of that aspect.
A brief description of this data has been put in the appendix to this paper.
12
such industries in 1990 was already higher than in 1980, although there was a slight
decline after that. The above figures indicate that while Korea provides a classic
example of labour-intensive industrialization in its early phase of development,
Malaysia comes close to that. Thailand also witnessed a rise in the share of labour
intensive industries between 1990 and 2002. In contrast, India witnessed a gradual
decline in the share of labour intensive industries and a rise in the share of capitalintensive industries. Pakistan and Sri Lanka also show similar trends, although not so
clearly.
The figures for Bangladesh presented in Table 2 need to be interpreted with caution.
They indicate a substantial rise in the shares of both top five labour-intensive and top
five capital-intensive industries. These figures themselves are not implausible, and
might indicate growth taking place at two ends of the spectrum. Indeed, there has
been very rapid growth of one labour-intensive industry, viz., ready made garments,
which may be reflected in the sharp increase in the share of the top five labourintensive industries. It should, however, be noted that apart from this single industry,
there has not been a similar growth in any other labour-intensive industry. In fact, the
performance of another major labour-intensive industry of the country, viz., leather
and leather products has been rather disappointing, resulting in a decline in its share in
total manufacturing value added (Ahmed, et al., 2008).
In the case of India, data from national sources (viz., the Annual Survey of Industries)
corroborate the findings based on UNIDO data. Using the ASI data, one recent study
(Palit, 2008) concludes that the composition of Indian manufacturing has not
undergone very substantive changes during the 1990s. That study actually shows that
the overall share of the labour-intensive industries in total manufacturing output has
13
declined significantly between 1990-91 and 2003-04. In 1990-91, the top five labourintensive industries (viz. food and other food products, beverages and tobacco, wood
products and furniture, other textiles, leather and fur products) accounted for nearly
41% of manufacturing output. In 2003-04, the share of the top five (which in that year
were other textiles, leather and fur, beverages and tobacco, food products, and other
manufacturing) dropped to 28.32% (Palit, 2008).
On the whole, data on the sector composition of the manufacturing sector clearly
demonstrates that it is the countries of ESEA (with the exceptions of Indonesia and
the Philippines) that were able to achieve a structural change towards labour-intensive
industries during the early phases of their development when they had surplus labour.
Countries of South Asia have not been able to achieve that. This is quite striking as far
as India is concerned because that country marked a significant change in the strategy
of development since 1991 when far-reaching reforms were introduced in the areas of
both domestic economic policies and trade policies. And that implies that trade
liberalization alone does not automatically enable a country to attain labour-intensive
industrialization. There are other factors that influence the policy environment and
hence the pattern of industrialization of a particular country that need to be addressed
if a country intends to embark on a process of development that would rapidly absorb
its surplus labour in productive employment9.
4. Contribution of Labour Productivity and Employment to Output Growth
The pattern of economic development that unfolded in the countries of ESEA has
been widely debated. But that debate focused mainly on the relative contribution of
9
For example, on India, Chandrasekhar (2008) finds that various elements in the policy environment in
India which made capital artificially cheaper and encouraged capital deepening as well as the growth
of capital-intensive industries. On Bangladesh, Ahmed, et al. (2008) pointed out a number of sectorspecific factors that are responsible for slow growth of labour-intensive industries.
14
capital accumulation and total factor productivity (the latter being used as an indicator
disembodied technological progress) in explaining the impressive growth
performance of those countries. While the well-known World Bank study of 1993
(World Bank, 1993) argued that East Asia’s superior economic performance was
mainly caused by rapid technological progress, there are many (especially, Kim and
Lau, 1994, Krugman, 1994, and Young, 1995) who challenged this view and argued
(on the basis of alternative empirical analysis) that the contribution of total factor
productivity (TFP) growth to East Asia’s labour productivity growth has been
relatively small10.
From the point of view of the impact of the pattern of growth on employment and the
possibility of a trade-off between productivity and employment, it is important to
identify the relative contribution of labour productivity and the quantity of labour
input to output growth. Storm and Naastepad (2005) did that for some countries of the
ESEA region and came to the conclusion that “labour productivity growth has been
the major source of East Asian per capita income growth” (p.1062). However, in an
empirical analysis (using cross-country data on 24 developing countries) of the
relationship between labour productivity growth and employment growth, they find
East Asian countries to be “outliers”. And on the basis of that, they conclude that
“East Asia managed to escape the trade-off between labour productivity growth and
employment growth”. The apparent contradiction between these two sets of findings
could probably be explained by the employment creating effect of labour productivity
growth exceeding the employment displacing effect. Be that as it may, it appears from
Storm and Naastepad (2005) that the pattern of growth in East Asia enabled them to
10
Khan (2002) appears to take the view that TFP was an important source of growth for the countries of
East Asia.
15
combine high growth of employment and productivity. How do the countries of South
Asia compare with those of ESEA in this respect?
In order to address the above question, decomposition of output growth (both total
GDP and manufacturing output) into contributions by employment and productivity
growth has been carried out using the methodology outlined in section 2.3, and the
results are presented in Tables 3a, 3b, and 4. Although these results do not indicate
any clear pattern, a number of interesting conclusions can be drawn, at least
tentatively. The first observation (and an important one from the point of view of
trade-off between employment and labour productivity growth) that can be made on
the basis of Tables 3a and 3b is that during the 1980s and 1990s, the contribution of
labour productivity growth to GDP growth in Korea, Malaysia, Taiwan, and Thailand
left sufficient scope for employment to increase. That, combined with the high rates of
GDP growth achieved by them, meant that they were able to combine fairly high rates
of employment growth with substantial growth in labour productivity. In other words,
it was not only employment growth but growth of productive employment that was
achieved by those countries.
Second, when one compares the countries of South and South East Asia, one does not
find a systematic difference (although one would expect the contribution of labour
productivity growth to be lower in the former). The figures for India, for example,
especially for 1990-96 and 2000-06, are not much different from those of Korea _
although given the levels of development and the labour market situation in the two
countries, one would expect the figures for Korea to be substantially higher. Likewise,
during the 1980s, the contribution of productivity growth in Pakistan and Sri Lanka
was higher than in countries like Malaysia and Thailand. Quite naturally, growth in
the latter countries was more employment-intensive than in the former.
16
Third, when one looks at the trend over time, some figures do not appear to be
consistent with what one would expect. For example, the contribution of labour
productivity growth to GDP growth increased over time in Bangladesh, China, India,
Indonesia and Malaysia but not in Korea. The increase in the contribution of labour
productivity growth in Bangladesh, China and India is rather unexpected, given that
those countries are still far away from experiencing a tight labour market. That, in
turn, indicates that the pattern of industrial growth in these countries has not been
conducive to generation of productive employment for the large amount of surplus
labour that is available in those countries.
5. Concluding Observations
The present paper argues that the pattern of economic growth in terms of the sector
and sub-sector composition of output is important in determining the employment
outcome of growth. Extending Kaldor’s analysis of economic growth where sustained
economic growth requires a high rate of growth of manufacturing in relation to overall
GDP growth and growth of other sectors, the present paper argues that such growth
may also be conducive to a high rate of employment growth. High rate of growth of
manufacturing at the initial stage of development is necessary for creating conditions
for Lewis-type transfer of surplus labour from sectors characterized by low labour
productivity to those with higher productivity. However, for that process to succeed, it
is also important for more labour-intensive sub-sectors of manufacturing to grow at
high rates _ at least at the initial stages of development.
It is empirically demonstrated that a few countries of East and South East Asia
(especially, Rep of Korea and Malaysia, and Indonesia and Thailand, to some extent)
17
were able to achieve the kind of growth pattern mentioned above. In general, the
countries of ESEA not only had higher growth manufacturing in relation to overall
GDP growth, the sector composition of the manufacturing sector was also more
labour-intensive (at least during the initial stages of their growth) than in countries of
South Asia. As a result, the employment intensity of growth during the initial stages of
their development was also higher than in the latter.
The paper also addresses the issue of possible trade-off between employment growth
and labour productivity. Even from the point of view of growth accounting, it is
pointed out that depending on the pattern of growth, it should be possible to achieve a
balance between employment and productivity growth. By undertaking a
decomposition exercise for overall GDP growth and manufacturing output growth, it
is demonstrated that the countries of ESEA have been able to achieve a more balanced
growth of employment and labour productivity than those of South Asia. The
difference in this result can also be ascribed to differences in the pattern of economic
growth. In that respect, it is argued that trade liberalization by itself is not adequate for
bringing about a change in the pattern of growth that is in line with the comparative
advantage of a country. Other policies, by distorting the incentive structure in an
economy may militate against the outcome that is expected from the pursuit of an
open economy regime.
18
Table 1: Growth rate of overall GDP and manufacturing output (annual compound rate of growth in percentage)
Notes:
Sources:
Man: Manufacturing output
Em: Elasticity of manufacturing growth with respect to GDP growth
World Bank, WDI 1998, 2004, 2007, WDR 1978, 1995
19
Table 2: Share of the Five Most Labour-Intensive and Five Most Capital-Intensive Industries in Total Manufacturing Value
Added in Asia
Countries
Bangladesh
India
Indonesia
Share of the labour-intensive
1980
1990
2002
1.78
12.36
22.54(2)
9.47
4.01
5.21(4)
30.90
18.34
3.91
Share of the Capital-intensive
1980
1990
2002
3.09
8.74
32.35(2)
21.76
25.01
26.48(4)
14.61
18.02
17.21
Korea, Republic of
8.26
9.53
4.21(4)
22.64
10.10
28.18(4)
Malaysia
Pakistan
Philippines
Sri Lanka
Thailand
4.09
15.79
7.20
22.99
n.a.
12.21
4.14(1)
8.80
4.42
4.77
5.27(4)
3.62(5)
7.89(2)
23.25(3)
14.34(6)
9.37
21.69
23.58
5.28
n.a.
18.25
11.61(1)
21.50
10.96
17.06
20.93(4)
24.51(5)
23.01(2)
12.57(3)
20.07(6)
Notes:
(1)
1991
(2)
1997
(3)
2000
(4)
2001
(5)
1996
(6)
1994
Source: Calculated from UNIDO, Indstat3, 2005
20
Table 3 a: Decomposition of GDP Growth into Productivity and Employment Growth (South Asia)
Countries
Growth rate of GDP
GDP growth due to employment
growth
GDP growth due to
productivity growth
1980199020001980-1990 1990-2000 2000-2006 1980-1990 1990-2000 2000-2006
1990
2000
2006
Bangladesh
3.84
4.80
5.65
2.69
2.09
2.27
1.15
2.71
3.37
India
5.59
5.46
7.35
2.60
1.87
2.52
3.00
3.59
4.83
Pakistan
6.29
4.43
5.45
2.25
2.01
4.10
4.04
2.42
1.35
Sri Lanka
4.33
5.24
4.50
1.53
2.29
2.02
2.80
2.96
2.48
Source: Author's calculations by using data available from />
Contribution of productivity
growth to GDP growth (%)
1980199020001990
2000
2006
29.97
56.40
59.77
53.60
65.82
65.75
64.19
54.64
24.82
64.60
56.39
55.15
Table 3b: Decomposition of GDP Growth into Productivity and Employment Growth (East and
South East Asia)
Growth rate of GDP
Countries
GDP growth due to employment
growth
GDP growth due to
productivity growth
19801980-90
1990-96
2000-06
1980-90
1990-96
2000-06
90
1990-96
2000-06
China
7.39
8.79
11.56
2.85
1.11
1.00
4.54
7.68
10.56
Indonesia
5.04
7.83
4.86
3.97
2.09
0.97
1.07
5.74
3.88
Malaysia
5.96
9.56
4.91
3.34
3.96
1.75
2.62
5.60
3.16
Philippines
1.69
2.77
4.63
2.99
3.40
3.13
-1.30
-0.63
1.51
South Korea
9.05
7.68
4.63
2.88
2.44
1.53
6.17
5.23
3.10
Taiwan
6.71
7.08
3.49
2.42
1.54
1.07
4.29
5.54
2.42
Thailand
7.85
8.16
5.09
2.94
0.56
2.24
4.90
7.60
2.85
Source: Author's calculations by using data available from />Access to that website is through
Contribution of Productivity
Growth to GDP Growth
1980-90
61.48
21.20
43.95
-77.19
68.16
63.97
62.48
1990-96
87.37
73.34
58.55
-22.67
68.19
78.27
93.11
21
2000-06
91.35
79.94
64.34
32.53
66.99
69.42
55.96
Table 4: Decomposition of Manufacturing Value Added Growth into Productivity and Employment
Growth
Countries
Value Added Growth
Value added growth due
to employment growth
1980-1989
1990-2002
1980-1989
Bangladesh
8.21
14.57
5.51
India
7.10
6.36
-0.09
Indonesia
16.57
4.17
10.18
Korea,
10.20
7.12
5.52
Republic of
Malaysia
9.23
10.00
1.96
Pakistan
8.54
2.20
2.14
Philippines
-1.20
4.64
-1.95
Sri Lanka
5.45
6.05
1.80
Thailand
5.30
-0.13
1.92
Source: Calculated from UNIDO, Indstat 3, 2005
Value added growth due
to productivity growth
Contribution of
Productivity Growth to
value added Growth (%)
1980-1989
9.38
0.57
2.95
1990-2002
2.70
7.19
6.39
1990-2002
5.19
5.79
1.21
1980-1989
32.88
101.32
38.55
1990-2002
35.59
91.00
29.13
-1.62
4.68
8.74
45.91
122.81
4.58
-1.10
-0.61
5.27
8.54
7.27
6.41
0.74
3.65
3.38
5.43
3.30
5.26
0.78
-8.67
78.79
74.99
-61.90
67.01
63.72
54.24
149.81
113.23
12.95
6495.95
22
Appendix: A Brief Description of the Data Used
1. UNIDO data
UNIDO brings out industrial statistics on a periodic basis; “Indstat 3 rev 2” brought
out in 2005 is the latest available in that series. Data pertaining to manufacturing
industries classified at the three-digit level of ISIC are presented by country, industry
and year. Following items are covered by this data set: number of establishments,
employment, wages and salaries, output, value added, gross fixed capital formation,
number of female employees, and index number of industrial production.
The data cover 28 industries. The period covered ends in 2003, but the latest year for
most of the data is 2002. Moreover, the coverage differs across countries and
variables; and there are important gaps for a number of countries.
While data from the OECD member countries are first collected by OECD and then
provided to the UNIDO, data for non-OECD countries are collected by the UNIDO
directly from the national statistical offices of the respective countries.
The data are originally stored national currency values at current prices. The system
allows conversion of values from national currency into US Dollars using the average
period exchange rates as given in the International Financial Statistics. For purposes
of the present paper, all values (both value added and values of fixed assets have been
converted into constant prices by using a deflator for the manufacturing sector
calculated from data available in World Development Indicators (online).
23
2.Data used for decomposition of GDP
Data used in Tables 3a and 3b for decomposing GDP growth into productivity and
employment growth has been obtained from the database provided by the Groningen
Growth and Development Centre and the Conference Board. That database which
covers 125 countries of the world is available online at . The data
included in that database are compiled from a variety of well-known international
sources, e.g., the World Bank, the regional development banks (like the Asian
Development Bank), and the International Labour Organization.
24
References
ADB (2005): Labour Markets in Asia: Promoting Full, Productive and Decent
Employment. Asian Development Bank, Manila, 2005.
Ahmed, Nazneen, Mohammad Yunus and Harunur Rashid Bhuyan (2008):
“Promoting Employment-Intensive Growth in Bangladesh: Policy Analysis of the
Manufacturing and service Sectors”. Unpublished paper, ILO, Geneva.
Auer, Peter and Rizwanul Islam (2006): “Economic Growth, Employment,
Competitiveness and Labour Market Institutions” in World Economic Forum: The
Global Competitiveness Report 2006-07, WEF, Geneva.
Clark, C. (1951): The Conditions of Economic Progress. Macmillan, London.
Chandrasekhar, C.P. (2008): “Re-visiting the Policy Environment for Engendering
Employment Intensive Economic Growth”. Draft paper, International Labour Office,
Geneva.
Fisher, A.G.B.(1939): “Production, Primary, Secondary and Tertiary”, The Economic
Journal, Vol. XV.
Islam, Rizwanul (2002): “Poverty Alleviation, Employment, and the Labour Markets:
Lessons from Asian Experiences and Policies”, in Christopher Edmonds and Sara
Medina (eds.): Defining an Agenda for Poverty Reduction: Proceedings of the first
Asia and Pacific Forum on Poverty; Asian Development Bank, Manila, 2002.
___ (2006a): “The nexus of economic growth, employment and poverty reduction: An
empirical analysis”, in Islam (2006b.
___ (ed.) (2006b): Fighting poverty: The development-employment link. Lynn
Rienner, Boulder, and London.
___ (2008): “Has Development and Employment through Labour-intensive
Induistrialization Become History?” in Basu, Kaushik and Ravi Kanbur (eds):
Arguments for a Better World: Essays in Honour of Amartya Sen (Vol.II, Society,
Institutions, and Development). Oxford University Press.
Kaldor, N. (1966): Causes of Slow Growth in the United Kingdom. Cambridge
University Press, Cambridge.
___ (1967): Strategic Factors in Economic Development. Cornell University Press,
Ithaca.
Kapsos, Steve (2005): “The Employment Intensity of Growth: Trends and
Macroeconomic Determinants”. Employment Strategy Papers, 2005/12. International
Labour Office, Geneva.
25