Accumulation of polychlorinated biphenyls and polycyclic aromatic hydrocarbons in the snowpack of minnesota and lake superior
Bạn đang xem bản rút gọn của tài liệu. Xem và tải ngay bản đầy đủ của tài liệu tại đây (150.45 KB, 15 trang )
J. Great Lakes Res. 26(2):220–234
Internat. Assoc. Great Lakes Res., 2000
Accumulation of Polychlorinated Biphenyls and Polycyclic Aromatic
Hydrocarbons in the Snowpack of Minnesota and Lake Superior
Thomas P. Franz† and Steven J. Eisenreich*
Department of Environmental Sciences
Rutgers University
14 College Farm Rd.
New Brunswick, New Jersey 08901
ABSTRACT. The winter snowpack is a significant reservoir of polychlorinated biphenyls (PCBs) and
polycyclic aromatic hydrocarbons (PAHs), and may be utilized as a surrogate receptor for assessing net
atmospheric deposition. Seasonal snow cores were collected in late winter before snowmelt in northern
and central Minnesota and at Eagle Harbor, Michigan on Lake Superior between 1982 and 1992. Snowpack concentrations of Σ-PCBs ranged from 1 to 14 ng/L with no significant decrease in concentrations
from 1986 through 1992. Σ21-PAH concentrations in 1989 and 1992 ranged from 35 to 3280 ng/L with
significantly higher concentrations nearer urban areas. Similarities between chemical accumulations in
the snowpack and collection of integrated snowfall at Eagle Harbor support the hypothesis that dry deposition to accumulated snow is negligible at these remote locations. Tributary discharges from spring
snowmelt to Lake Superior in 1992 contributed 7 to 11 kg of Σ-PCBs and 220 to 350 kg of Σ21-PAHs.
INDEX WORDS:
PCBs, PAHs, snow, Lake Superior.
INTRODUCTION
Atmospheric transport and deposition distributes
chemical emissions from source regions to remote
environments causing toxicological concern for the
health of their biotic communities (Norstrom et al.
1988; Muir et al. 1988, 1990; Bidleman et al. 1989;
Hargrave et al. 1992; Wania and Mackay 1993).
Methods for assessing atmospheric loadings include
mass balance modeling, the use of surrogate receptors, such as lake sediment, peat and snow cores, as
well as direct measurements of precipitation and
dry deposition.
Snow is an excellent tool for assessing atmospheric deposition. Snowpacks in northern temperate
and polar regions are a reservoir of accumulated
chemicals that have been deposited by wet and dry
processes over the winter. Snow can account for 5
to 40% of annual precipitation within the Great
Lakes region (NCDC 1992) and about 75% of Arctic precipitation (Gregor 1990). Research on organic chemicals in snow has confirmed the long
range transport of semivolatile organic compounds
(SOCs) to polar regions (Peel 1975, Risebrough et
al. 1976, Tanabe et al. 1983, McNeely and Gummer
1984, Hargrave et al. 1988, Gregor and Gummer
1989, Patton et al. 1989, Gregor 1990). However,
few studies have determined concentrations of
SOCs in snow from the upper Great Lakes region
(Murphy and Rzeszutko 1977, Swain 1978, Strachan and Huneault 1979, Murphy and Schinsky
1983, Rapaport et al. 1985, Boom and Marsalek
1988) and its relative contribution compared to
other inputs.
Snow has been considered in mass balance models for PAHs and PCBs at Siskiwit Lake, Isle
Royale, in Lake Superior (McVeety and Hites 1988,
Swackhamer et al. 1988). In Green Bay, the annual
wet flux (snow + rain) of PCBs was included in atmospheric input calculations (Franz and Eisenreich
1993, Bierman et al. 1993). However, in other mass
balance efforts, annual wet deposition fluxes are
based on rain concentrations (Strachan and Eisenreich 1988, Eisenreich and Strachan 1992). Omission
of snow as a separate input pathway to the Great
Lakes is because of a lack of information on SOC
concentrations in snow within the region.
Snowpacks integrate various transport, scaveng-
*Corresponding author: E-mail:
†Present address: Metropolitan Council Environmental Services, Research and Development, 2400 Childs Rd., St. Paul, MN 55105
220
PCBs and PAHs in the Snowpack of Minnesota
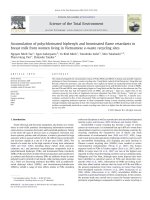
FIG. 1.
Map illustrating location of sampling sites.
ing, and deposition phenomena in addition to various post-depositional diagenetic processes. The
concentrations observed are the net result of precipitation, dry particle deposition, gas exchange, and
percolation. Thus, the snowpack concentration
CSnow is given by:
Csnow =
221
Mass Wet + Mass dry + Mass Adsorption − Mass Volatilization − Mass Percolation
Volume Precipitation − Volume Evaporation − Volume Percolation
(1)
Wet and dry (gas + particle) depositional
processes, gaseous volatilization, and water percolation are the principal pathways whereby SOCs become first entrained and potentially lost in the
snowpack. A complete description of the important
diagenetic procceses influencing accumulation is
given in Franz et al. (1997).
This study was initially conducted to assess the
similarities between atmospheric deposition and accumulations of PCBs and chlorinated pesticides in
rural/remote peat bogs of North America (Rapaport
et al. 1985, Rapaport and Eisenreich 1988). Snow
cores were collected from 1982 to 1985 in northern
Minnesota during this phase of the study. In 1986
and 1989, samples were taken to continue the
chronological record and to compare PCB concentrations in snow to those in rain (Franz et al. 1991,
Franz and Eisenreich 1993). Field investigations in
1992 evaluated diagenetic processes within the
snowpack (Franz 1994) and determined snow scavenging of atmospheric SOCs (Franz and Eisenreich
1998). The objective of this paper is to summarize
the 1982 to 1992 snow data and to report the concentrations and regional variability of PCBs and
PAHs in annual snowpacks. Precipitation data from
the Integrated Atmospheric Deposition Network
(IADN) site at Eagle Harbor (Gatz et al. 1994, Hoff
et al. 1996) are compared to snowpack concentrations to evaluate the importance of dry deposition.
And finally, snowmelt contributions to tributary
loadings to Lake Superior during the spring
snowmelt are estimated.
EXPERIMENTAL
Site Description
Snow was collected at four sites in Minnesota
and at Eagle Harbor, Michigan (Fig. 1) near the end
of winter before snowmelt. Table 1 lists the loca-
222
TABLE 1.
Location
Franz and Eisenreich
Location of sampling sites and snow core characteristics.
Number #
Cores
Marcell State
Forest, MN
(Lat. 47° 32′ N,
Long. 93° 28′ W)
Year
Water
Equivalent
Surface Area Snow Depth
Depth
(m2)
(cm)
(cm)
Snow
Density
(g/cm3)
Number of
Accumulation
Days
until Sampled
Precipitation
during
Accumulation
(cm)
Percent of
Precipitation
Sampled
NA
112
12.3
92
5.35
NA
11.9
NA
5.55
NA
14.0
NA
16.7 ± 0.8 0.25 ± 0.02
11.3 ± 0.7 0.24 ± 0.01
76
86
67 ?
135
131
114
5.5
12.2
6.5
14.4
18.6
10.8
98
97
85
97
90 ± 4
105 ± 6
1
1981–82
0.5
NA
2
2
2
2
3
2
1982–83
1983–84
1984–85
1985–86
1988–89
1991–92
1.38
0.62
1.55
0.63
0.75
1.05
NA
NA
NA
NA
66.5
47.5
1985–86
1.25
41
13.6 ± 0.3
0.34 ± 0.2
114
13.1
104 ± 2
1988–89
1.25
14.5–23.5a
6.8 ± 1.4
0.36 ± 0.01
102
10.5
109 ± 30
2
1988–89
0.5
67
10.5 ± 1.0 0.16 ± 0.01
57
11.8
89 ± 9
GFBI, MN
(Lat. 44° 57′ N,
Long. 93° 39′ W)
2
1991–92
1.75
18.6
6.35 ± 1.5
0.34 ± 0.1
91
9.6
67 ± 2
Eagle Harbor, MI
(Lat. 47° 28′ N,
Long. 87° 52′ W)
2
1991–92
(1/7/92)
(3/21/92)
1.38
32.9
10.8
0.33 ± 0.1
46
12.1
89
0.6
1.5
30
17
11.0
5.4
0.37
0.32
74
46
120
12.8
12.1
24.9
86
45
66
Cedar Creek Natural
History Area, MN 3
(Lat. 45° 19′ N,
Long. 93° 17′ W) 2
Lake Itasca State
Forest, MN
(Lat. 47° 13′ N,
Long. 95° 12′ W)
2
Topb
Bottomc
Total
11.3
aSamples
taken in meadow with small hillocks and depressions, some drifting snow. Depths highly irregular and listed for each sample.
section of snowpack represents snowfall accumulation from 7 Jan to 21 March 92.
cBottom section is replicate sample of January snowpack that accumulated snow 23 Nov 91 to 7 Jan 92.
bTop
tions of the sites and characteristics of the snow
cores. Within the Marcell Experimental Forest in
northern Minnesota, snow was collected in an open
meadow of 0.4 hectare surrounded by forest and
maintained as a National Atmospheric Deposition
Network (NADP) site. At the Lake Itasca State Forest, sampling occurred in a meadow located near
the shore of Lake Itasca, headwaters of the Mississippi River. The Cedar Creek Natural History Area
is located about 50 km NW of Minneapolis/St. Paul
in an agricultural region. Sampling occurred in a
grassy field used as an atmospheric monitoring site.
The Gray Freshwater Biological Institute (GFBI) is
located approximately 35 km west of Minneapolis/St. Paul in a suburban setting. The IADN Eagle
Harbor, Michigan site is near the northwest tip of
the Keweenaw Peninsula. Samples were taken
within 50 m of Lake Superior.
Sampling Protocol
All equipment was washed with Alconox and
rinsed with tap water, Milli-Q® water (Millipore),
acetone and hexane, or methanol and dichloromethane and wrapped in aluminum foil prior to
transport to the field. In the autumn of each year
(1982 to 1986 samples), 1-m2 sheets of 3 mil plastic
were secured on the ground at each sampling location. In subsequent years, no plastic sheeting was
used because it was deemed unnecessary. In late
winter, a one-square-meter area was inscribed on
PCBs and PAHs in the Snowpack of Minnesota
the snow surface, quartered, and the snow on two
sides removed to ground level to allow access to the
entire core. Duplicate snow cores were collected in
0.25 m 2 quadrants in 110 L anodized aluminum
cans and covered with an aluminum foil-lined lid.
Samples for dissolved organic carbon (DOC) and
suspended particulate matter (SPM) were collected
using a 6.5 cm i.d. plexiglass tube and kept frozen
in plastic bags. Monthly IADN wet-only precipitation samples were taken at Eagle Harbor as described by Sweet et al. (1993), Hoff et al. (1996),
and Hillery et al. (1998).
In the laboratory, the snow containers were
weighed to determine water volumes. Between
1982 and 1989, the snow was allowed to melt for 2
to 5 days within a walk-in refrigerator at 4°C.
Melted snow was then passed through an XAD-2
resin (Sigma Chemical Co.) column (glass cartridge
2.5 cm i.d. × 20 cm) using a peristaltic pump at
flow rates of 100 to 200 mL/min. Particulate matter
was trapped on glass wool plugs holding the resin
within the column. The empty snow container was
rinsed with either acetone (1982 to 1986), or
methanol and dichloromethane (1989) to collect adhered particles and compounds sorbed to the container walls. These rinses were later added to the
extract.
In 1992, the snowmelt was maintained at 4°C and
filtered using a submersible pump, a stainless steel
filter head, and precleaned 293 mm diameter glass
fiber filters (GFFs) (Schleicher and Schuell No.
25). The filtrate, collected in precleaned 65 L stainless steel tanks, was passed through a XAD-2 resin
column as described. The snow cans were rinsed
with 2 L of Milli-Q water and filtered with the remaining sample. No solvent rinse of the cans was
performed. This method allowed the determination
of both dissolved (XAD-2) and particulate (GFF)
fractions within the snowmelt.
Subsamples for DOC and SPM were transfered to
2 L glass beakers and allowed to thaw at room temperature while covered with aluminum foil. Approximately 250 to 750 mL of the melt water was
filtered through a 0.4 µm Nuclepore filter for suspended particulate matter (SPM) analysis. The remainder was filtered through 47 mm GFFs with the
filtrate collected in polyethylene bottles for DOC
analysis.
Analytical Procedure
Although sampling and analysis occurred over a
decade, similar analytical procedures were em-
223
ployed with minor variations. Basically, the procedure consisted of 24 hr sequential Soxhlet extractions of the XAD resin and GFFs using acetone and
hexane, or methanol and dichloromethane. Surrogate standards of mirex (1982 through 1986), or
PCB congener #166 (2,3,4,4′,5,6-hexachlorobiphenyl) and d12 -chrysene (1989 and 1992 samples) were added to the resin in the Soxhlet prior to
extraction to evaluate analytical recoveries. The extracts and rinses were back-extracted with Milli-Q
water to remove water soluble solvents, concentrated in a Kuderna-Danish apparatus with a solvent
switch to hexane, cleaned and fractionated using a
Florisil or alumina/silica column, concentrated in a
Kuderna-Danish apparatus, and reduced with N 2
gas to final volume. Internal quantification standards (2,4,6-trichlorobiphenyl, IUPAC #30 and
2,2′3,4,4′,5,6,6′-octachlorobiphenyl, IUPAC #204;
and deuterated PAHs d 10 anthracene, d 12
benzo(a)anthracene, d 12 benzo(a)pyrene and d 12
benzo(g,h,i)perylene) were added prior to final volume reduction in 1989 and 1992 samples. The concentrated extracts were analyzed on either an
Hewlett-Packard (HP) 5840A or HP-5890 GC with
63Ni electron capture detector (PCBs) or HP-5890
GC with an HP-5970 mass selective detector
(PAHs). Selective ion monitoring and retention
times were used to identify the PAH compounds
using a 30m DB-5 (J & W Scientific), 0.32 mm i.d.,
0.25 µm film thick glass capillary column. Helium
was the carrier gas with a linear velocity of about
33 cm/sec. Injection was splitless with an initial
column temperature of 50°C held for 1 minute, then
ramped at 25°C/min to 125°C and then at 10°C/min
to 290°C and held for 10 min. Injection port and
GC-MS interface temperatures were 290°C and
300°C, respectively. Electron multiplier voltage
was either 1,800 or 2,000 emv. Compounds were
quantified using either external (1982 to 1986) or
internal standards (1989 and 1992). Details of analytical methods and GC-ECD instrumental conditions for PCBs are described in Rapaport et al.
(1985); Rapaport and Eisenreich (1988) (1982
through 1985 samples); Franz et al. (1991) (1986
samples); and Franz and Eisenreich (1993) (1989
and 1992 samples).
Nuclepore filters (SPM) were dried overnight at
50°C and placed in a dessicator prior to weighing
on a Perkin Elmer Model AD-2 microbalance. Dissolved organic carbon (DOC) was measured by IR
following either persulfate-enhanced UV digestion
in a Dohrmann DC-80 Carbon Analyzer or combus-
224
TABLE 2.
Franz and Eisenreich
Summary of total PCB concentrations (ng/L) in snow.
Location
Marcell, MN
Cedar Creek, MN
Lake Itasca, MN
GFBI, MN
Eagle Harbor, MI
Number of
Cores
1
2
2
2
2
3
2
3
2
2
2
1/7/92 (2)
3/21/92 Top (1)
3/21/92 Bottom (1)
VWM (c)
VWM (d)
Total PCB
Concentration
Year
1981–82
1982–83
1983–84
1984–85
1985–86
1988–89
1991–92
1985–86
1988–89
1988–89
1991–92
1991–92
1.4
6.8 ± 2.7
8.5 ± 6.8
13.6 ± 5.0
1.9 ± 0.8
0.76 ± 0.44
1.3 ± 0.2
1.3 ± 1.0
1.4 ± 0.7
2.8 ± 0.8
2.3 ± 0.3
1.8 ± 0.5
2.02
1.45
1.84
1.70
SPM (a)
(mg/L)
DOC (b)
(mg C/L)
6.1 ± 0.3
3.0 ± 0.5
0.96 ± 0.03
0.9 ± 0.2
18.6 ± 5.4
5.6 ± 1.4
2.1 ± 0.9
3.3 ± 0.1
8.8 ± 0.6
1.5 ± 0.3
2.7 ± 0.5
51 ± 14
(a) Suspended particulate matter in snow.
(b) Dissolved organic carbon in snow.
(c) Volume weighted mean of January and March top snow cores.
(d) Volume weighted mean of March top and bottom snow cores.
tion at 750°C in an Ionics Model 555 Total Organic
Carbon Analyzer.
Quality Control/Quality Assurance
Quality control and assurance (QA/QC) details
are described elsewhere (Rapaport et al. 1985, Rapaport 1985, Rapaport and Eisenreich 1988, Franz
et al. 1991, Franz and Eisenreich 1993, Franz
1994). Briefly, instrument detection limits (defined
as 3x signal:noise ratio) ranged from 0.001 to 0.2
ng for PCB congeners (0.7 to 10 ng for Σ-PCBs)
and from 0.01 to 0.1 ng for individual PAHs. Matrix blanks accounted for ~10 to 20% of the sample
mass for PCBs and ~5 to 10% for PAHs. Breakthrough of dissolved SOCs was evaluated by two
XAD columns in series. The primary column recovered an average of 82 ± 12% (n = 5) of Σ-PCBs and
97 ± 3% of individual PAHs. Annual average surrogate recoveries ranged from 71 to 108% for mirex
or PCB congener #166 and from 74 to 89% for the
PAH surrogate d12-chrysene.
Data for 1982 to 1985 are not corrected for surrogate recoveries or blanks. Samples in 1986 were
corrected for the recovery of mirex and the average
mass from XAD Blanks. Similarly, all PCB results
in 1989 and 1992 were blank corrected after being
adjusted for the recovery of surrogate PCB congener #166. The PAH results (1989 and 1992) are
blank corrected but not adjusted for surrogate
recovery.
RESULTS AND DISCUSSION
Table 1 lists the location of the snow cores and
their characteristics. Snow events at Cedar Creek
and Itasca in 1989 and at Marcell and GFBI in
1992, had densities of 0.12 to 0.18 g/cm3 (Franz
1994). Seasonal snow cores exhibited densities
ranging from 0.16 to 0.37 g/cm3. Cores from northern Minnesota, which experience few days with
above-freezing temperatures during winter, had
densities of 0.16 to 0.25 g/cm3, compared to central
Minnesota cores with densities of 0.34 to 0.36
g/cm3 which experienced some melting. These densities are similar to the 0.38 ± 0.03 g/cm3 density in
cores from Canada (Strachan and Huneault 1979);
0.3 to 0.4 g/cm 3 in Canadian Arctic snow cores
(McNeely and Gummer 1984) and the 0.25 to 0.41
g/cm 3 in cores from Sault Ste. Marie, Ontario
(Boom and Marsalek 1988). The Eagle Harbor
cores exhibited densities of 0.32 to 0.37 g/cm3, similar to central Minnesota.
Based on daily precipitation records at nearby
PCBs and PAHs in the Snowpack of Minnesota
National Weather Service sites (NCDC 1992), the
water retention efficiency of the snowpack relative
to the amount of precipitation that occurred during
the accumulation period was calculated. The percent of precipitation sampled in the snow core
(Table 1) is defined as the water equivalent snow
depth relative to the amount of recorded precipitation. Deviations from unity are attributable to sublimation, percolation of water to the ground surface,
snow drifting, and snowfall variability between the
snowpack sampling site and the snowfall recording
site. Water loss by sublimation was not significant
during the winter. Snow cores retained an average
of 91 ± 10% of the precipitation that occurred during snowpack accumulation. Obvious exceptions
occurred in suburban MN (GFBI) and Eagle
Harbor.
The seasonal snow core at GFBI exhibited low
water recovery (67 ± 2%) that was attributed to significant snow melt. Melting may not significantly
increase the density of a snowpack if some water
percolates out of the core. The measured density
then reflects the packing density of the remaining
snow cover.
Cores at Eagle Harbor were obtained on 7 January and 21 March 1992 to examine temporal
changes in the snowpack. Low water recovery
(45%) was noted in the bottom section of the March
core, a replicate sample of the January core. This
section had the same density as in January (0.33 ±
0.1 g/cm3), but half the water content. The January
and March cores were taken within 5 m of each
other and were visually similar with no obvious indication of melting.
PCB Snow Concentrations
The concentration of total PCBs (Σ-PCBs) in seasonal snow cores from 1982 to 1992 ranged from
0.8 to 14 ng/L (Table 2). The coefficient of variation (RSD) amongst several sets of replicate cores
averaged 41 ± 22%. With the exception of Σ-PCB
concentrations of ~10 ng/L in 1983 to 1985, concentrations were about 1 to 2 ng/L, similar to the
values in Great Lakes rain (Hoff et al. 1996). Winter deposition in terms of concentrations of atmospheric PCBs has not diminished significantly since
1986, a behavior reminiscent of atmospheric PCBs
(Hillery et al. 1997). It is now known that atmospheric PCBs measured at some IADN sites are decreasing with a half-life of about 3 to 6 years
(Hillery et al. 1997; Simcik et al. 1999). Interestingly, IADN Lake Superior data at Eagle Harbor do
225
not show any statistical decrease. This agrees with
measurements of atmospheric PCBs over and near
Lake Superior which have not decreased appreciably (Baker and Eisenreich 1990, Hornbuckle et al.
1994, Hillery et al. 1997). Also, with the exception
of Marcell in 1983 to 1985, there is no clear spatial
variation among the sites suggesting a well-mixed
atmospheric source signal. The mean Σ-PCB concentrations are equivalent among the sites during
any one year (p < 0.05). Samples collected within
50 km of the Minneapolis/St. Paul metropolitan
area at Cedar Creek and at suburban GFBI have approximately the same concentrations as those from
remote northern Minnesota (Marcell and Lake
Itasca) and at Eagle Harbor on Lake Superior. The
range of PCB concentrations in snow are similar to
other values within the Great Lakes region (Table
3) and are similar to rain concentrations (Strachan
1990, Franz and Eisenreich 1993, Gatz et al. 1994,
Hoff et al. 1996, Hillery et al. 1998). The volumeweighted mean (VWM) concentration of Σ-PCBs in
snowpack at Eagle Harbor in March was 1.7 ng/L.
The wet-only VWM Σ-PCB concentration from December through mid-March in IADN precipitation
samples was 2.0 ng/L (Gatz et al. 1994). In the
1992 snowpack, 47 to 80% of Σ-PCBs were in the
particulate phase. The di- and tri-chlorinated congeners were primarily in the dissolved phase
(< 50% particulate), while the higher chlorinated
congeners were predominantly in the particle phase.
PCB Snow Accumulations
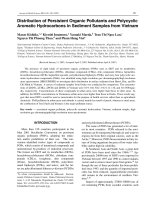
The mean concentration of PCBs in the snowpack and the water equivalent depth were used to
calculate the winter accumulation (Fig. 2). Winter
accumulation of Σ-PCBs ranged from 0.13 to 1.0
µg/m2. No significant differences (p < 0.05) were
found among the sampling sites in the snowpack
deposition in 1982 and 1983 and from 1986 through
1992. Thus, no temporal or spatial differences in
the regional deposition of PCBs is evident even at
suburban sites (Cedar Creek and GFBI) within 50
km of Minneapolis/St. Paul. This suggests a nearly
uniform atmospheric source signal throughout the
region in winter with the accumulation of PCBs
ranging from 0.2 to 0.4 µg/m2 since 1986.
The apparent deposition of Σ-PCB reflected in
snow accumulations are generally less than other
snow deposition estimates from the Great Lakes
region—range: ~0.4 to 3.5 µg/m 2 (Murphy and
Schinsky 1983, Swackhamer et al. 1988, Franz and
Eisenreich 1993). Snow accumulation in 1992 is
226
TABLE 3.
Franz and Eisenreich
Concentrations of PCBs in snow in Great Lakes region.
PCB Concentration
Year
Location
mean (range), ng/L Type of Snow Sample
Reference
1974–76 Duluth, MN
50
Snow Events
Swain (1978)
″
Isle Royale, Lake Superior
230
Snow Events
″
1975–76 Ontario, Canada
18–43a
Snowpack
Strachan and Huneault (1979)
1975–76 Chicago, IL
212 ± 97
Snow Events
Murphy and Rzeszutko (1977)
1982–83 Isle Royale, Lake Superior
17
Snowpack
Swackhamer et al. (1988)
1982–85 Marcell, MN
7.6 ± 4.4 (1.4–13.6) Snowpack
This Study
1986
Madison, WI
12.4b
Snow Events
Murray and Andren (1992)
1985–86 Minnesota
1.6 ± 0.3 (1.3–1.9) Snowpack
This Study
1988–89 Minnesota
1.7 ± 0.8 (0.8–2.8) Snowpack
This Study
1988–89 Minnesota
2.0 – 6.5
Snow Events
Franz 1994
1989–90 Green Bay region, WI
(1.4 – 5.1)
Integrated Snow Events Franz and Eisenreich (1993)
1991–92 Eagle Harbor, MI
2.0 (1.3 – 2.6)c
Integrated Snow Events Gatz et al. 1994
1991–92 Minnesota & Michigan
1.8 ± 0.4 (1.3–2.3) Snowpacks
This Study
1991–92 Minnesota
0.7 – 7.9
Snow Events
Franz 1994
aRange of means within various regions.
bEvent began as rain, then turned to snow, half of the precipitation amount in each form.
cVolume-weighted mean and range of wet-only precipitation between 12/3/91 to 3/17/92 for total PCBs for same congeners as analyzed in this study.
FIG. 2. Mean ⌺-PCB accumulation (µg/m2 ± one standard deviation) in snowpack from winter 1981 to
1993. The values given are the averages of two snow cores each.
similar to the upper range for Arctic winter accumulation of 0.01 to 0.3 µg/m2 (Gregor 1991).
A direct comparison between rain and snow loadings can be made from precipitation studies at
Cedar Creek in 1986 (Franz et al. 1991) and Green
Bay in 1989 and 1990 (Franz and Eisenreich 1993).
The PCB flux from rain at Cedar Creek was 1.4 ±
0.3 µg/m2/yr. Snowfall during the 1985–86 winter
accounted for about 20% of annual precipitation at
this site while contributing 0.18 ± 0.14 µg/m2/yr of
PCBs. Thus, snow contributed ~12% of the annual
PCB flux. At three sites near Green Bay, Lake
Michigan, the mean Σ-PCB flux ranged from 1.0 to
2.0 µg/m2/yr for rain and 0.36 to 0.54 µg/m2/yr for
snow (Franz and Eisenreich 1993). Thus snow was
responsible for 22 to 27% of annual PCB loadings
PCBs and PAHs in the Snowpack of Minnesota
from wet deposition to Green Bay while accounting
for 20 to 30% of annual precipitation in the region.
Dry deposition of PCBs to the snowpack was
evaluated by comparing cumulative snowfall deposition versus accumulation in the snowpack at
Eagle Harbor. Cumulative wet deposition was calculated from the measured monthly IADN Σ-PCB
concentrations and snowfall (water equivalent) during the 1991-92 winter (Gatz et al. 1994). Cumulative snowpack accumulation is the sum of measured
Σ-PCB deposition in the Eagle Harbor snow core
taken in January and the top section of the March
core that integrated atmospheric inputs from 23 November 1991 to 7 January 1992 and from 7 January
to 21 March 1992, respectively. Cumulative snow
deposition is the sum of the integrated snowfall
measurements at the IADN site collected monthly
from 3 December 1991 through 19 March 1992. No
significant difference (p < 0.05) was observed between the cumulative snow deposition of PCBs
(0.32 ± 0.05 µg/m2) and accumulation within the
snowpack (0.40 ± 0.11 µg/m2). This suggests that
falling snowfall is the dominant source of PCBs in
snowpacks. Thus if gaseous PCBs are sorbed to
ice/snow crystals, it likely happens during snowfall.
Atmospheric concentrations of S-PCBs seldom exceeeds 60 pg/m3 in the cold of winter.
Comparison of Σ-PCB annual snow accumulation
of ~ 0.4 µg/m2 to other fluxes in Lake Superior is
informative. The surface sediment accumulation
rate of Σ-PCBs is ~1 to 2 µg/m 2 /y (Jeremiason
et al. 1994), and the atmospheric loading is
~1 µg/m2/y from wet and dry particle deposition
and ~5 µg/m2/y if PCB gas absorption is included
(Hoff et al. 1996). Σ-PCB fluxes on settling particles in Lake Superior for this time period were
about 18 µg/m2/y (Jeremiason et al. 1998). However benthic recycling ratios of ~20 lead to observed sediment accumulation rates (Baker et al.
1991, Jeremiason et al. 1998). Thus Σ-PCB snow
accumulation rates are comparable to assessed atmospheric deposition and surficial sediment accumulation rates.
PAH Snow Concentrations
Total PAHs (Σ21-PAHs) as the sum of 21 individual PAHs ranged from 35 to 3,300 ng/L among
1989 and 1992 seasonal snow cores (Table 4).
Replicate variability of all individual PAHs averaged 17 ± 13%. Relatively low concentrations of
Σ 21 -PAHs (35 to 120 ng/L) were found at the
rural/remote sites. Higher concentrations (Σ21-PAHs
227
230 to 3,280 ng/L) were found nearer the urban
areas at Cedar Creek and GFBI.
Table 5 compares the concentrations of PAHs in
winter precipitation at a number of remote and
urban locations. Snowpack concentrations in Sault
Ste. Marie, Ontario at the eastern shore of Lake Superior (Boom and Marsalek 1988) are significantly
higher than observed elsewhere and are attributable
to nearby steel manufacturing. In Portland, Oregon
(Ligocki et al. 1985a,b), PAH concentrations of the
lower molecular weight species (< Pyr) in winter
rain are higher than Lake Superior snow concentrations, while the higher molecular weight PAHs are
in close agreement. All other samples taken in the
Lake Superior region are similar, although high
concentrations of low molecular weight PAHs
(< Pyr) were observed on Isle Royale (McVeety and
Hites 1988).
Filtration of 1992 snow samples determined that
28 to 100% of PAHs were associated with particulate matter. Only the low MW PAHs acenaphthylene (Acy), acenaphthene (Ace), and fluorene (Flr)
were found primarily in the snow filtrate. The dominance of the particulate fraction of medium and
high molecular weight PAHs in winter snowpack
suggests that snow scavenging of soot particles is
likely the primary atmospheric removal mechanism.
However, Schmitt (1982) suggested that the importance of particle scavenging diminishes with distance from urban sources as particulate emissions
are efficiently washed out close to the source. The
data in Table 4 supports this observation such that
the proportion of particulate PAHs in rural snowpacks (~80%) is somewhat less than found in suburban snow (~98%).
PAH Snow Accumulations
The winter accumulation of Σ 21 -PAHs ranged
from 4.7 to 13 µg/m2 at the remote sites in 1989 and
1992 and from 20 to 210 µg/m 2 at the suburban
sites. Urban sources contribute significantly to the
suburban snowpack. Deposition is much less than
estimated annual emissions of PAHs in the Great
Lakes region which range from approximately 400
to 6,400 µg/m2/yr (Johnson et al. 1992). At Eagle
Harbor, the deposition of PAHs in the January 1992
snowpack was similar to that calculated from the
VWM concentration of the top and bottom sections
of the March snowpack. This suggests that losses
from meltwater percolation during this period
equaled gains from subsequent snowfalls.
A comparison of the cumulative IADN snowfall
228
TABLE 4.
Concentrations (ng/L) of PAHs in seasonal snow cores.
Marcell, MN
1988–89
PAH
Symbol
Mean
SD
Lake Itasca, MN
1988–89
Mean
SD
Cedar Creek, MN
1988–89
Mean
SD
Marcell, MN
1991–92
%
Mean
SD Particle
Eagle Harbor, MIa
1991–92
%
Mean
SDb
GFBI, MN
1991–92
%
Particle
Mean
SD Particle
Acy
0.9
0.1
0.5
0.1
0.4
0.1
0.3
0.1
31
0.4
0.1
61
1.6
0.1
89
Acenaphthene
Ace
0.5
0.2
0.8
0.2
1.5
0.4
0.7
0.1
32
0.9
0.4
16
19
0.7
90
Fluorene
Flr
1.5
0.2
1.4
0.4
2.4
0.6
0.9
0.01
35
1.1
0.6
24
33
1.5
91
1-Methyl Fluorene
1-mF
0.9
0.1
0.6
0.2
0.7
0.1
1.2
0.2
28
0.5
0.2
44
7.8
0.3
86
Phenanthrene
Phen
6.2
1.3
13.3
0.9
31.4
7.7
6.6
1.2
51
6.2
3.0
52
449
18.4
93
Anthracene
Anth
0.3
0.1
0.6
0.0
1.8
0.5
0.4
0.1
85
0.3
0.1
77
23
1.3
97
2-Methyl Phenanthrene
2-mP
1.3
0.3
2.1
0.2
3.9
0.6
1.2
0.2
64
1.3
0.4
63
61
2.8
94
Methylene
mP
0.7
0.2
1.6
0.1
3.7
0.9
0.5
0.1
61
0.5
0.2
71
54
1.1
97
1-Methyl Phenanthrene
1-mP
0.6
0.2
1.2
0.2
1.8
0.3
0.6
0.1
63
0.6
0.2
62
36
1.9
94
Fluoranthene
Fln
3.2
0.9
18.7
2.1
26.5
4.7
4.7
0.6
75
4.5
1.0
80
608
5.7
97
Pyrene
Pyr
2.2
0.7
13.4
1.7
18.7
3.4
3.0
0.3
82
3.3
0.8
86
462
16.1
98
Retene
Ret
1.0
0.4
3.4
1.7
5.9
0.6
1.5
0.2
96
0.6
0.1
95
4.0
0.1
99
Benzo(a)anthracene
BaA
0.7
0.2
3.7
0.2
6.4
1.3
0.8
0.01
95
0.7
0.1
99
118
45.6
100
Chrysene
Chr
1.5
0.4
8.8
1.2
9.3
0.6
1.9
0.1
92
2.1
0.2
94
231
8.8
99
Benzo(b+k)fluoranthene
BFlns
3.4
1.3
18.3
0.7
45.3
14.1
3.4
0.1
99
3.4
0.3
98
478
17.4
100
Benzo(e)pyrene
BeP
2.1
0.8
7.8
0.3
20.4
6.4
1.4
0.2
97
1.8
0.1
98
204
10.1
100
Benzo(a)pyrene
BaP
6.6
0.6
11.8
1.5
20.8
3.5
9.4
0.2
100
3.4
0.4
99
150
4.4
100
Indeno(c,d)pyrene
IDP
1.2
0.5
6.6
0.1
12.6
2.7
1.3
0.1
100
1.4
0.1
99
165
0.4
100
Dibenzoanthracene
DBA
0.2
0.1
0.8
0.1
1.9
0.3
0.3
0.01
100
0.2
0.03
100
36
2.0
100
Benzo(g,h,i,)perylene
BghiP
1.3
0.5
6.1
0.1
11.5
2.5
1.4
0.02
100
1.7
0.2
100
141
0.3
100
36
9
121
12
227
51
41
4
80
35
8
78
3280
139
98
Total PAHs
(a) Volume-weighted mean concentration of top and bottom core on 3/21/92.
(b) Standard deviation calculated from replicate coefficient of variation of January snow cores.
Franz and Eisenreich
Acenaphthylene
TABLE 5.
PAHs
a
b
c
d
e
Portland, ORa
1984
Rain Events
Mean ± sd
Isle Royale, LSb
1983–84
Snowpack
Mean ± sd
37 ± 13
5.4 ± 2.0
14.4 ± 4.3
Sault Ste Marie, ONT c
1986–87
Snowpack
Range
Arcticd
Narragansett Bay, RIe
Eagle Harbor, MIf
Rural/Remoteg
1988
1992–93
1991–92
1991–92
Snow Event
Rain
Integrated Snow Events
Snowpack
Particle Only
Range
VWM
Range of Means
< 50–150
< 50–98
< 50–237
0.05
0.7
1–21
0.2–3.7
1.5– 18
0.99
0.84
1.5
9– 95
0.6– 24
7.1
1.3
94 ± 29
5.1 ± 2.0
33 ± 10h
26 ± 2
3.0 ± 0.3
< 50–3,560
2.6
0.5
52 ± 20
43 ± 16
17.5 ± 1.4
10.4 ± 0.8
< 50–7,020
< 50–3,750
4.8 ± 2.4
11.5 ± 6.2
11 ± 12i
3.4 ± 3.7
3.0 ± 3.1
2.6 ± 0.3
7.6 ± 0.5
1.2
1.5
< 0.05
0.4
0.9
0.1
5.8 ± 0.3
3.2 ± 0.2
5.2 ± 0.6
< 100–560
< 100–500
6.0 ± 6.3
4.6 ± 0.6
< 100–470
Ligocki et al. 1985 a,b.
McVeety and Hites 1988.
Boom and Marsalek 1988.
Welch et al. 1991.
Latimer (1994).
< 100–1,640
f
g
h
i
0.01
0.02
0.5
0.1
0.7– 6
8–57
5–50
0.6–5.7
2–13
2–27
1– 16
0.5–14
0.2–4.7
< 0.5–2.2
< 1–15
8.7
5.8
1.2
2.0
6.8
11.1
4.0
4.9
6.4
4.2
5.1
0.3– 0.9
0.5– 0.9
0.9–1.5
0.5–1.2
6.2–13.3
0.3–0.55
1.2–2.1
0.5–1.6
0.6–1.2
3.2–18.7
2.2–13.4
0.6–3.4
0.7–3.7
1.5–8.8
3.4–18.3
1.4–7.8
3.4–11.8
1.2– 6.6
0.2– 0.8
1.3–6.1
Suburban, MNg
1991–92
Snowpack
Range of Means
0.4–1.6
1.5–19
2.4–33
0.7–7.8
31–450
1.8–23
3.9–61
3.7–54
1.8–36
27–610
19–460
4.0–5.9
6.4–120
9.3–230
45–480
20–200
21–150
13–165
1.9–36
12–140
PCBs and PAHs in the Snowpack of Minnesota
Acy
Ace
Flr
1-mF
Phen
Ant
2-mP
mP
1-mP
Fln
Pyr
Ret
BaA
Chr
Bb,kF
BeP
BaP
IDP
DBA
BghiP
PAH concentrations (ng/L) in winter precipitation at various locations.
IADN Data (Gatz et al. 1994).
This study.
Sum of 5 methylphenanthrene isomers.
Sum of benzo(b+j+k)fluoranthene isomers.
229
230
Franz and Eisenreich
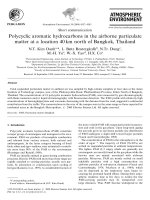
FIG. 3. Mean PAH accumulation (µg/m2 ± one standard deviation) in 1991–92 snowpack at rural sites
(a) Marcell, MN, (b) Eagle Harbor, MI, and (c) the suburban Minneapolis, MN Gray Freshwater Biological Institute (GFBI).
deposition at Eagle Harbor (Gatz et al. 1994)
of Σ17-parent PAHs with snowpack accumulation
in this study yielded no significant difference
(p < 0.05): deposition 12.7 ± 1.1 µg/m2; accumulation within the snowpack 9.7 ± 2.2 µg/m 2 . The
agreement in the cumulative estimates between
snowfall deposition and snowpack accumulation
demonstrates that snow deposition dominates winter inputs to the snow cover in remote areas and
that contributions by dry deposition are within the
sampling variability of ±20%. This is consistent
with the low dry particle deposition of both PCBs
and PAHs to exposed plates occurring in the winter
of 1994–95 in the northern Lake Michigan basin
(Franz et al. 1998), and was largely attributed to
low particle emisisons combined with minimum resuspension of soil particles in remote areas.
Figure 3 compares the accumulation of PAHs in
PCBs and PAHs in the Snowpack of Minnesota
the 1991–92 snowpack at the rural sites of Marcell
and Eagle Harbor and at the suburban GFBI location. At both rural sites, phenanthrene and lower
molecular weight species are more prevalent in the
snowpack than at the suburban GFBI site emphasizing the importance of particulate deposition at the
latter site. The particulate fraction of phenanthrene
and other low MW species is ≤ 0.5 in the snowpack
at these sites. In contrast, the strong particulate signal depicted in the GFBI snow core is > 85% of the
mass for each PAH. The proximity to urban particle
sources and/or meltwater percolation out of the core
of the more soluble PAHs may explain this pattern
and the predominance of the particulate fraction.
The winter accumulation of PAHs estimated from
the rural snowpack is similar to the winter deposition reported for Isle Royale (McVeety and Hites
1988) and the surficial sediment accumulation rates
in Lake Superior (Gschwend and Hites 1981, Baker
et al. 1991), while the suburban snowpack accumulation brackets the annual wet deposition of PAHs
in rural areas of Chesapeake Bay (Baker et al.
1997). In the Arctic, the winter deposition of total
PAHs is ~4.2 µg/m2 (Gregor 1991) similar to the remote values in this study (6.8 ± 3.6 µg/m2). Thus,
the winter loading of PAHs in remote areas of Lake
Superior is generally low and reflects continental
background levels. The similarity with Arctic snow
accumulations suggests that the atmospheric signal
transported to these regions may have similar
sources or comparable source strengths.
Lake Superior Loadings
Winter loadings of SOCs to Lake Superior occur
by both direct deposition to the lake surface and indirectly by tributary discharge of snowmelt. Assuming a winter deposition of 0.2 µg/m2 for PCBs
from winter snowfall throughout the Lake Superior
basin, ~16 kg directly entered Lake Superior over
the winter of 1991–92, while ~26 kg accumulated
within the snowpack of the watershed. For Σ 21 PAHs, with a basin-wide deposition of 6.8 µg/m2,
~560 kg directly entered the lake and ~870 kg accumulated in the snowcover of the basin.
The concentration of chemicals in runoff during
snowmelt is influenced by the rate of thaw,
runoff/terrestrial interactions, and additional rain
inputs (Cadle et al. 1984a). Soluble compounds are
released during early snowmelt periods, while particulate SOCs are released in final meltwaters
(Schöndorf and Herrmann 1987, Quémerais et al.
1994). Thus, there may be pulses of inputs to rivers
231
and lakes with the relative importance of the dissolved and particulate phases changing as snowmelt
proceeds. Biogeochemical interactions, partitioning
to vegetative and soil surfaces or filtration of particles by ground litter, can reduce the concentration
in runoff. In addition, temporal and spatial variations in snowmelt and runoff over the drainage
basin can disperse the concentration in runoff over
longer periods (Hibberd 1984).
To estimate riverine inputs of these chemicals
during spring snowmelt, two tributaries were chosen for analysis. The St. Louis River drains 8,880
km2 of northeastern Minnesota entering Lake Superior at Duluth. The Ontonagon River in the Upper
Peninsula of Michigan enters the lake near Ontonagon and drains about 3,600 km2. The annual mean
discharge of the St. Louis River is ~64 m3/sec, representing about 8.8% of total tributary flow to Lake
Superior. The Ontonagon River represents ~3.6% of
annual riverine water inputs to the lake with an annual mean discharge of approximately 26 m3/sec
(D. Dolan, International Joint Commission 1993,
personal communication). Daily precipitation and
snow records (NCDC 1992) from monitoring sites
within each drainage basin were used to determine
the mean snowpack depth and the snowmelt period.
Daily discharges for each river from the U.S. Geological Survey (Have, M. and Blumer, S., U.S. Geological Survey, Water Resources Division,
Minnesota and Michigan Districts, respectively
1993, personal communications) were used to calculate the volumetric discharge from each river during the 1992 spring thaw. Total water equivalent
accumulations (in cm) within the snowpack could
then be compared to the discharged volume, normalized to the basin area (in cm), to estimate the
percentage of water that entered the rivers during
snowmelt relative to the amount that had accumulated within the watershed during the winter.
As a first approximation, runoff concentrations
were assumed to be equal to the bulk snowpack
concentrations and snowmelt occurred uniformly
across the drainage basin. Thus the total discharge
from the onset of meltwater discharge to the first
spring rain was summed. A substantial amount of
water was discharged with the onset of spring rains
because of saturated soils, but this discharge was
not included in this estimation.
In the St. Louis River basin, snowmelt began in
mid-March and lasted until the end of April, 1992.
Peak discharge from snowmelt lasted about 6 weeks
from March to early May. During this time ~470 ×
106 m3 of water entered Lake Superior accounting
232
Franz and Eisenreich
for 37% of the accumulated water in the snowpack.
If the concentration of PCBs in the discharge is
similar to the snowpack at Marcell, MN (1.3 ng/L),
then ~0.6 kg of PCBs entered the lake during this 6week period. Assuming that the discharge from the
St. Louis River accounted for 8.8% of total riverine
water inputs to Lake Superior, the total indirect
loading of PCBs from snowmelt projected over the
lake basin from all tributaries amounted to ~7 kg. A
similar estimate of Σ21-PAH loading from the St.
Louis River during snowmelt suggests that ~19 kg
of PAHs were discharged from the river with ~220
kg projected from all tributaries in the lake basin.
Similar treatment of the Ontonagon River basin
resulted in an estimated 224 × 106 m3 of water discharged during spring thaw or ~31% of the accumulated water in the snowpack. Applying a PCB
concentration of 1.7 ng/L from Eagle Harbor, ~0.4
kg entered the lake during the spring melt. Assuming the Ontonagon River represents 3.6% of total
tributary discharges, suggests that 11 kg of PCBs
entered the lake with meltwaters. For Σ-PAHs, 8 kg
entered the lake with Ontonagon River spring discharge and 220 kg from all tributaries. Assuming
that 30 to 40% of the snowpack water within the
basin enters Lake Superior during a few spring
weeks, the estimated Σ-PCB loading with meltwaters is 8 to 10 kg, while total PAH loading ranges
from 220 to 350 kg.
ACKNOWLEDGMENTS
The authors acknowledge the technical support of
C. Sweet, I. Basu, and K. Harlin of the Illinois State
Water Survey for their analysis of the IADN samples and M. Auer at Michigan Technological University for his diligent operation of the Eagle
Harbor site. The authors wish to thank Dave Dolan
of the International Joint Commission for discussions on Lake Superior tributaries and to Mark
Have and Steve Blumer of the U.S. Department of
the Interior, Geological Survey, Water Resources
Division from the Minnesota and Michigan Districts, respectively, for supplying daily discharge
records for the St. Louis and Ontonagon rivers.
The authors thank D. VanRy for preparing the map.
This research was funded in part by: National Science Foundation, Grant No. DEB 7922142; U.S.
Environmental Protection Agency, Great Lakes
National Program Office, Grants Nos. R00584001, R005038-01 and X-995786-01; the Great Lakes
Protection Fund, Grant No. FG6901029; and the
NJ Agricultural Experiment Station of Rutgers
University.
REFERENCES
Baker, J.E., and Eisenreich, S.J. 1990. Concentrations
and fluxes of polycyclic aromatic hydrocarbons and
polychlorinated biphenyls across the air-water interface of Lake Superior. Environ. Sci. Technol. 24:
342–352.
——— , Eisenreich, S.J., and Eadie, B.J. 1991. Sediment
trap fluxes and benthic recycling of organic carbon,
PAHs and PCB congeners in Lake Superior. Environ.
Sci. Technol. 25(3):500–509.
——— , Poster, D.L., Clark, C.A., Church, T.M., Scudlark, J.R., Ondov, J.M., Dickhut, R.M., and Cutter, G.
1997. Loadings of atmospheric trace elements and
organic contaminants to the Chesapeake Bay. In
Atmospheric Deposition of Contaminants to the Great
Lakes and Coastal Waters, ed. J.E. Baker, pp.
171–194. Pensacola, Florida: SETAC Press.
Bidleman, T.F., Patton, G.W., Walla, M.D., Hargrave,
B.T., Vass, W.P., Erickson, P., Fowler, B., Scott, V.,
and Gregor, D.J. 1989. Toxaphene and other
organochlorines in Arctic Ocean fauna: evidence for
atmospheric delivery. Arctic 42:307–313.
Bierman, V.J.Jr., DePinto, J.V., Young, T.C., Rodgers,
P.W., Martin, S.C., and Raghunathan, R. 1993. Development and validation of an integrated exposure
model for toxic chemicals in Green Bay, Lake Michigan. U.S. EPA, Contract No. CR-814885.
Boom, A., and Marsalek, J. 1988. Accumulation of polycyclic aromatic hydrocarbons (PAHs) in an urban
snowpack. Sci. Total Environ. 74:133–148.
Colbeck, S.C. 1981. A simulation of the enrichment of
atmospheric pollutants in snow cover runoff. Water
Res. Res. 17:1383–1388.
Eisenreich, S.J., and Strachan, W.M.J. 1992. Estimating
atmospheric deposition of toxic substances to the
Great Lakes, an update. Canada Centre for Inland
Waters, Burlington, Ontario.
Franz, T.P. 1994. Deposition of semivolatile organic
chemicals by snow. Ph.D. thesis, University of Minnesota, Minneapolis, MN.
——— , and Eisenreich, S.J. 1993. Wet deposition of
polychlorinated biphenyls to Green Bay, Lake Michigan. Chemosphere 26:1767–1788.
——— , and Eisenreich, S.J. 1998. Snow scavenging of
polychlorinated biphenyls and polycyclic aromatic
hydrocarbons in Minnesota. Environ. Sci. Technol.
32:1771–1778.
——— , Eiseneich, S.J., and Swanson, M.B. 1991. Evaluation of precipitation samplers for assessing atmospheric fluxes of trace organic contaminants. Chemosphere 23:343–361.
——— , Gregor, D.J. and S.J. Eisenreich. 1997. Snow
deposition of atmospheric semivolatile organic chemi-
PCBs and PAHs in the Snowpack of Minnesota
cals. In Atmospheric Deposition of Contaminants to
the Great Lakes and Coastal Waters, ed. J.E. Baker,
pp.73–108. Pensacola, FL: SETAC Press.
——— , Eisenreich, S.J., and Holsen, T.M. 1998. Dry
deposition of particulate PCBs and PAHs to Lake
Michigan. Environ. Sci. Technol. 32:3681–3688.
Gatz, D.F., Sweet, C.W., Basu, I., Vermette, S., Harlin,
K., and Bauer, S. 1994. Great Lakes Integrated
Atmospheric Deposition Network (IADN) data report.
U.S. EPA, Great Lakes National Program, Chicago,
IL. Grant X-995786-01.
Gregor, D.J. 1990. Deposition and accumulation of
selected agricultural pesticides in Canadian Arctic
snow. In Long range transport of pesticides, ed. D.A
Kurtz, pp. 373–386. Chelsea, MI:Lewis Publishers.
——— . 1991. Trace organic chemicals in the Arctic environment: atmospheric transport and deposition. In
Pollution of the Arctic atmosphere, ed. W.T. Sturges,
pp. 217–254, New York, NY: Elsevier Science Publishers.
——— , and Gummer, W.D. 1989. Evidence of atmospheric transport and deposition of organochlorine pesticides and polychlorinated biphenyls in Canadian
Arctic snow. Environ. Sci. Technol. 23:561–565.
Gschwend, P.M., and Hites, R.A. 1981 Fluxes of polycyclic aromatic hydrocarbons to marine and lacustrine
sediments in the Northeast United States. Geochim.
Cosmochim. Acta 45:2359–2367.
Hargrave, B.T., Vass, W.P., Erickson, P.E., and Fowler,
B.R., 1988. Atmospheric transport of organochlorines
to the Arctic Ocean. Tellus 40B:480–493.
——— , Harding, G.C., Vass, W.P., Erickson, P.E.,
Fowler, B.R, and Scott, V. 1992. Organochlorine pesticides and polychlorinated biphenyls in the Arctic
Ocean food web. Arch. Environ. Contam. Toxicol.
22:41–54.
Hibberd, S. 1984. A model for pollutant concentrations
during snow-melt. J. Glaciology 30:58–65.
Hillery, B.R., Basu, I., Sweet, C.W., and Hites, R.A.
1997. Temporal and spatial trends in a long-term
study of gas-phase PCB concentrations near the Great
Lakes. Environ. Sci. Technol. 31:1811–1816.
——— , Simcik, M.F., Basu, I., Hoff, R.M., Strachan,
W.M.J., Burniston, D., Chan, C.H., Brice, K.A.,
Sweet, C.W., and Hites, R.A. 1998. Atmospheric
deposition of toxic pollutants to the Great Lakes as
measured by the Integrated Atmospheric Deposition
Network. Environ. Sci. Technol. 32:2216–2221.
Hoff, R.M., Strachan, W.M.J., Sweet, C.W., Chan, C.H.,
Shackleton, M., Bidleman, T.F., Brice, K.A., Burniston, D.A., Cussion, S., Gatz, D.F., Harlin, K., and
Schroeder, W.H. 1996. Atmospheric deposition of
toxic chemicals to the Great Lakes: A review of data
through 1994. Atmos. Environ. 30:3505–3527.
Hornbuckle, K.C., Jeremiason, J.D., Sweet, C.W., and
Eisenreich, S.J. 1994. Seasonal variations in air-water
233
exchange of polychlorinated biphenyls in Lake Superior. Environ. Sci. Technol. 28:1491–1501.
Jeremiason, J.D., Hornbuckle, K.C., and Eisenreich, S.J.
1994. Polychlorinated biphenyls (PCBs) in Lake
Superior, 1978–1992: Decreases in water concentrations reflect loss by volatilization. Environ. Sci. Technol. 28:903–914.
——— , Eisenreich, S.J., Baker, J.E., and Eadie, B.J.
1998. PCB decline in settling particles and benthic
recycling of PCBs and PAHs in Lake Superior. Environ. Sci. Technol. 32(21):3249–3256
Johnson, N.D., Scholtz, M.T., Cassaday, V., Davidson,
K. and Ord, D. 1992. MOE toxic chemical emission
inventory for Ontario and eastern North America. Air
Resources Branch, Ontario Ministry of the Environment, by Ortech International. Report No. P92-T615429/OG.
Latimer, J.S. 1994. Wet deposition of organic contaminants to the coastal marine environment: Narragansett Bay atmospheric deposition study
(1992–1993). Office of Ocean and Coastal Resource
Management, National Oceanic and Atmospheric
Administration (NOAA), Contract No. NA270R0217.
Ligocki, M.P., Leuenberger, C., and Pankow, J.F. 1985a.
Trace organic compounds in rain-II. Gas scavenging
of neutral organic compounds. Atm. Environ.
19:1609–1617.
——— , Leuenberger, C., and Pankow, J.F. 1985b. Trace
organic compounds in rain-III. Particle scavenging of
neutral organic compounds. Atm. Environ.
19:1619–1626.
McNeely, R., and Gummer, W.D. 1984. A reconnaissance survey of the environmental chemistry in eastcentral Ellesmere Island, N.W.T. Arctic 37:210–223.
McVeety, B.D., and Hites, R.A. 1988. Atmospheric
deposition of polycyclic aromatic hydrocarbons to
water surfaces: A mass balance approach. Atm. Environ. 22:511–536.
Muir, D.C.G., Norstrom, R.J., and Simon, M. 1988.
Organochlorine contaminants in Arctic marine food
chains: accumulation of specific polychlorinated
biphenyls and chlordane-related compounds. Environ.
Sci. Technol. 22:1071–1079.
——— , Grift, N.P., Ford, C.A., Reiger, A.W., Hendzel,
M.R., and Lockhart, W.L. 1990. Evidence for longrange transport of toxaphene to remote Arctic and
Subarctic waters from monitoring of fish tissues. In
Long range transport of pesticides, ed. D.A. Kurtz,
pp. 329–346. Chelsea, Mich: Lewis Publishers.
Murphy, T.J., and Rzeszutko, C.P. 1977. Precipitation
inputs of PCBs to Lake Michigan J. Great Lakes Res.
3:305–312.
——— , and Schinsky, A.W. 1983. Net atmospheric
inputs of PCBs to the ice cover on Lake Huron. J.
Great Lakes Res. 9:92–96.
Murray, M.W., and Andren, A.W. 1992. Precipitation
234
Franz and Eisenreich
scavenging of polychlorinated biphenyl congeners in
the Great Lakes region. Atm. Environ. 26A:883–897.
NCDC (National Climactic Data Center), 1992. Monthly
temperature and precipitation records for Minnesota
and Michigan. National Weather Service, Asheville,
NC.
Norstrom, R.J., Simon, M., Muir, D.C.G., and Schweinsburg, R.E. 1988. Organochlorine contaminants in Arctic marine food chains: identification, geographical
distribution, and temporal trends in polar bears. Environ. Sci. Technol. 22:1063–1071.
Patton, G.W., Hinckley, D.A., Walla, M.D., and Bidleman, T.F. 1989. Airborne organochlorines in the
Canadian High Arctic. Tellus 41B:243–255.
Peel, D.A. 1975. Organochlorine residues in Antarctic
snow. Nature 254:324–325.
Quémerais, B., Lemieux, C., and Lum, K.R. 1994. Temporal variation of PCB concentrations in the St.
Lawrence River (Canada) and four of its tributaries.
Chemosphere 28:947–959.
Rapaport, R.A. 1985. Chlorinated hydrocarbons in peat,
Ph.D. thesis, University of Minnesota, Minneapolis,
MN.
——— , and Eisenreich, S.J. 1988. Historical atmospheric
inputs of high molecular weight chlorinated hydrocarbons to eastern North America. Environ. Sci. Technol.
22:931–941.
——— , Urban, N.R., Capel, P.D., Baker, J.E., Looney,
B.B., Eisenreich, S.J., and Gorham, E. 1985. “New”
DDT inputs to North America: atmospheric deposition. Chemosphere 9:1167–1173.
Risebrough, R.W., Walker II, W., Schmidt, T.T.,
DeLappe, B.W., and Connors, C.W. 1976. Transfer of
chlorinated biphenyls to Antarctica. Nature
264:738–739.
Schmitt, G. 1982. Seasonal and regional distribution of
polycyclic aromatic hydrocarbons in precipitation in
the Rhein-Main-area. In Deposition of Atmospheric
Pollutants, eds. H.-W. Georgii and J. Pankrath, pp.
133–142. Boston, MA: D. Reidel Publishing.
Schöndorf, T., and Herrmann, R. 1987. Transport and
chemodynamics of organic micropollutants and ions
during snowmelt. Nordic Hydro. 18:259–278.
Simcik, M.F., Basu, I., Sweet, C.W., and Hites, R.A.
1999. Temperature dependence and temporal trends of
PCB congeners in the Great Lakes atmosphere. Environ. Sci. Technol. 33:1991–1995.
Strachan, W.M.J. 1990. Atmospheric deposition of
selected organochlorine compounds in Canada. In
Long range transport of pesticides, ed. D.A. Kurtz,
pp. 233–240. Chelsea, MI: Lewis Publishers.
——— , and Eisenreich, S.J. 1988. Mass balancing of
toxic chemicals in the Great Lakes: The role of atmospheric deposition. International Joint Commission:
Windsor, Ontario.
——— , and Huneault, H. 1979. Polychlorinated
biphenyls and organochlorine pesticides in Great
Lakes precipitation. J. Great Lakes Res. 5:61–68.
Swackhamer, D.L., McVeety, B.M., and Hites, R.A.
1988. Deposition and evaporation of polychlorinated
biphenyl congeners to and from Siskiwit Lake, Isle
Royale, Lake Superior. Environ. Sci. Technol.
22:664–672.
Swain, W.R. 1978. Chlorinated organic residues in fish,
water, and precipitation from the vicinity of Isle
Royale, Lake Superior. J. Great Lakes Res. 4:398–407.
Sweet, C.W., Basu, I., and Harlin, K. 1993. Toxic organics and trace metals in air and precipitation at the
U.S. IADN stations. Proc. Air Waste Manangement
Assn. Denver, Colorado, 93-RP-137.03.
Tanabe, S., Hidaka, H., and Tatsukawa, R. 1983. PCBs
and chlorinated hydrocarbon pesticides in Antarctic
atmosphere and hydrosphere. Chemosphere
12:277–288.
Wania, F., and Mackay, D. 1993. Global fractionation
and cold condensation of low volatility organochlorine compounds in polar regions. Ambio 22:10–18.
Welch, H.E., Muir, D.C.G., Billeck, D.N., Lockhart,
D.L., Brunskill, G.J., Kling, H.J., Olson, M.P., and
Lemoine, R.M. 1991. Brown snow: a long-range
transport event in the Canadian Arctic. Environ. Sci.
Technol. 25:280–286.
Submitted: 5 May 1999
Accepted: 28 February 2000
Editorial handling: Paul V. Doskey