Combination of ADEOS II–GLI and MODIS 250m data for land cover mapping of indochina peninsula
Bạn đang xem bản rút gọn của tài liệu. Xem và tải ngay bản đầy đủ của tài liệu tại đây (964.98 KB, 8 trang )
Combination of ADEOS II – GLI and MODIS 250m Data
for Land Cover Mapping of Indochina Peninsula
Nguyen Thanh Hoan
Institute of Geography, Vietnamese Academy of Science and Technology
18 Hoang Quoc Viet Rd., Cau Giay, Hanoi, Vietnam
Nguyen Dinh Duong
Institute of Geography, Vietnamese Academy of Science and Technology
18 Hoang Quoc Viet Rd., Cau Giay, Hanoi, Vietnam
Ryutaro Tateishi
Center for Environmental Remote Sensing (CEReS), Chiba University, Japan
Abstract: ADEOS-II GLI is a new sensor version of Japan. With 6 channels for land study identically to Landsat-TM image,
moderate spatial resolution (250m), GLI image is suitable for studies on natural resource and environment in regional, countrywide and global scale. In this study, multi-temporal data classification algorithm - GASC (Graphical Analysis of Spectral
reflectance Curve) was used. This algorithm was developed by Prof. Dr. Nguyen Dinh Duong in the frame work of JAXA
ADEOS-II GLI research announcement. GLI images used in this study cover Indochina peninsula from April to September of
2003. The time period was not long enough to provide major phenological changes of land cover in the study area, therefore
combination with MODIS 250m data to fulfill one-year cycle temporal dataset was necessary. The used images are composed of
39 GLI scenes. These images were geometrically corrected and mosaicked together to create 13 images of Indochina peninsula.
These images were further combined together to create 5 cloud free monthly composites. To cover the other time period when the
GLI images were not available, 21 MODIS 250m scenes of Indochina peninsula were used to derive 6 cloud free composites for
months: 1, 2, 3, 10, 11 and 12 of 2003. Classification of multi-temporal dataset with all spectral channels usually requires a long
computing time extensive computer resources therefore for each composite only 5 spectral channels have been selected. 250m
MODIS images were extended to 5 channels by using indexes to respond the 5 channels of GLI image. Classification legend was
chosen following IGBP standard with 25 classes (some IGBP classes were broken down to more detail ones). The training area
selection and validation were done based on the ground truth photo database of Vietnam (with more than 6000 GPS photos
covering various areas of Vietnam). Accuracy of classification of land cover was estimated about 90%.
Keywords: GASC.
1. Introduction
The versions of moderate resolution sensor like MODIS (USA-1999), MERIS (Europe-2001) and GLI (Japan2002) are interested of remote sensing researchers. With short repeat cycle (2-4 days), wide swath (>2000km), high
radiance resolution (36 channels), moderate spatial resolution (250-300m), these data is one of optimal solutions for
studies about natural resource and environment in regional, country-wide and global scale. GLI is a sensor onboard
ADEOS - II satellite of Japan that was launched in December 2002. GLI image has 6 channels for land study that are
identical to Landsat-TM image. Although this satellite worked only in a short period (from January to October, 2003)
but GLI images can still prove ability of it in supplying detail information about natural resource and environment in
large areas. Multi-temporal Classification Algorithm developed by Prof. Dr. Nguyen Dinh Duong and others in
Department of Environmental Information Study and Analysis (EISA), Institute of Geography, VAST is suited for
these data. The algorithm can use a series of images for classifying to determine the change of objects following
season. It can be developed continuously to classify sub-automatically a large number of images. It also can combine
many types of images together for classifying to make a better result.
This study was done with 3 purposes: confirming useful ability of GLI image, affirming capable applications of
GASC algorithm and proposing a method combining GLI and MODIS data for land cover mapping with a case study
of Indochina peninsula.
2. Data and processing
To finish this study, we used 39 GLI scenes from JAXA (April to September, 2003), 21 MODIS 250m scenes
from Institute of Physics, VAST (January to March and October to December, 2003) and more than 6000 GPS
photos from EISA.
39 GLI scenes received from JAXA in level 1B. We developed a software for geometric correction and
mosaicking them together to make 13 images covering all of Indochina peninsula. From these 13 images, we
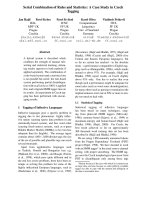
combined them together by a remove cloud model to make 5 cloud free composites for months: April, May, June,
July and September (no have image in August). The combination and result as following:
1-April
2-May
3-June
4-July
5-September
Fig. 1: Cloud free GLI composites
GLI images cover only from April to September, not enough to describe changes of land cover objects following
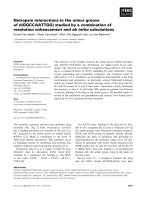
season. We used MODIS 250m data covering other months in the year to get one year cycle temporal dataset. 21
scenes of MODIS 250m were combined together by a remove cloud model to make 6 composites for 6 months:
January, February, March, October, November and December 2003. Result as following:
January
February
March
October
November
December
Fig. 2: Cloud free MODIS 250m composites
Multi-spectral and multi-temporal classification using all of bands and all of composites requires a very strong
computer processing system and a long time processing. In this study, we only use 5 bands of GLI images (without
channel 20-Blue band) and chose 5 composites (2 of GLI and 3 of MODIS) of all for land cover classification. The
composites as following:
1
2
3
4
January
February
April
May
October
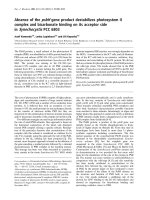
Fig. 3: Composites chosen for classification (green composites are GLI and red composites are MODIS)
The choosing composites based on seasons that can describe phenological changes of land cover objects. In the
above images we can see: from January to February, deciduous forest has a big change (yellow rectangle No. 3);
from February to April is change of cultivated land in Mekong river delta and Red river delta (yellow rectangle No. 1
and No. 4); from April to May is restore of deciduous forest (rectangle No. 3); and from May to October have very
big change of many objects in many regions (No. 1, 2, 3, 4).
We used 5 channels of GLI composites for classification but MODIS 250m only have 2 channels. To respond with
5 channels of GLI, we brought up MODIS composites to 5 channels by following computation:
b1 = b1
b2 = b2
b3 = (b2-b1)/(b2+b1)*2000 + 2000
b4 = b2/b1*500
b5 = (b1 + b2)/2
3. Classification
GASC algorithm was developed based on thought that each object on surface of the earth has a specific reflectance
curve. These curves are drawn by spectral channels of multi-spectral images. Analysis of these curves can define the
objects by remote sensing data. These curves are analysed by a series of indexes called invariants. If the invariants
are combined with a time invariant of multi-temporal dataset, GASC will become a multi-spectral and multitemporal classification algorithm. This algorithm has been confirmed in many types of remote sensing data like:
Simulated GLI data from Landsat-TM, multi-temporal MODIS data. In this study, we use this algorithm to classify
combination of GLI and MODIS. Outline of the algorithm is showed in following figure.
Input data includes a multi-temporal dataset and training areas. Multi-temporal dataset was prepared in above
section. Training areas were collected based on ground truth GPS photo database of Vietnam. Training areas
collected only in Vietnam were used to classify land cover for all of Indochina peninsula. With more than 6000 GPS
photos covering various areas of Vietnam, this database is very useful for collection training areas and validation
result.
Fig. 4: Outline of Algorithm
Fig. 5: Ground truth GPS photos of Vietnam. (Green points are position of photos)
Legend for classification was chosen following IGBP standard. Standard legend of IGBP for global land cover has
17 classes. In this study, we broke down some classes of IGBP to more detail ones. Total number classes are 25.
Result and legend will be show in the below section.
4. Result and discussion
GLI image has 4 spectral channels more than MODIS in 250m resolution including Blue band, Green band, and 2
bands in short ware infrared. So that GLI image will able to determine land cover objects as types of soil, moisture of
objects, cover percentage of vegetation better than MODIS.
Combination of MODIS and GLI can get a completely temporal dataset. Using temporal dataset can determine
objects that have change following season like deciduous forest and evergreen forest, differently cultivated lands
based on cultivated schedule, soil moisture and so on. Combining advantage of temporal dataset and priorities about
spectral of GLI can make a detail and accurate result.
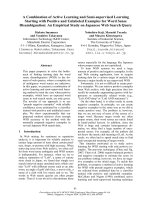
Legend
1. CEBFor: Closed Evergreen Broadleaf Forest
2. MEBFor: Medium Evergreen Broadleaf Forest
3. OEBFor: Open Evergreen Broadleaf Forest
4. SDBFor: Semi Deciduous Broadleaf Forest
5. DBFore: Deciduous Broadleaf Forest
6. ENFore: Evergreen Needleleaf Forest
7. Mangro: Mangrove Forest
8. Wd_Sav: Woody Savannas
9. CShrub: Closed Shrub
10. OShrub: Open Shrub
11. Grass1: Grass and Shrub
12. Grass2: Grass and Bare Soil
13. FrTree: Fruit Trees
14. Mosaic: Including mixture of: cultivated land,
natural land, garden, …..
15. Crpld1: Combination of rice land and other
crop lands
16. Crpld2: Rice in all of year
17. Crpld3: Rice land has one flood season
18. Crpld4: Dry crop land
19. Urban: Building Area
20. Barren: Dry Barren
21. BazanS: Grass and Shrub in Bazan Soil
22. Sand: Sand, Rock
23. WetLd1: Swamp, Pond (Aquaculture land)
24. WetLd2: Warp, Wet Sand
25. Water: Water
Fig. 6: Land cover classification result and legend
This result was validated by using ground truth GPS photos of Vietnam. We selected randomly 30 points and
compared with classification result. Accuracy was estimated about 90 percent.
In figure 7 below, comparison of results from GLI+MODIS and from only MODIS shows that forest in result of
GLI+MODIS is more detail than that of MODIS. The different types of cultivated land can be determined clearly and
detailly. Specially, other objects like water, urban in GLI+MODIS result are clearer than in MODIS very much.
Result of GLI+MODIS 2003
Result of MODIS 2003
Fig. 7: Agricultural land and forest in Red river delta
Figure 8 is comparison of color composite image and classification result in Thailand and Laos. Classifying can
determine quite well difference of soil types in the same crop schedule of cultivated land. Classification result is
quite similar to visual interpretation.
Color composite image
Fig. 8: Agricultural land and forest in Thailand and Laos
Classification image
In figure 9 below, evergreen forest, semi deciduous forest and deciduous forest are determined quite clearly by
using temporal dataset.
Color composite image
Classification image
Fig. 9: Evergreen broadleaf forest and deciduous broadleaf forest in Cambodia and Vietnam
5. Conclusion
Combination of many types of images to classify land cover can get a better result. Each type of remote sensing
image has some advantages and some disadvantages. Combining them together may restrain disadvantages and
intensify advantages of them. Classification result is more detailed and more accurate, may be increasing application
capability in the life.
GLI images have spectral advantages of Landsat-TM. Land cover classification result from combination of GLI
and MODIS is estimated that details more than result from only MODIS data. With width swap, short repeat cycle,
GLI data have precedence very much for monitoring and managing natural resource and environment. Moderate
spatial resolution (250m) is suitable for studies in medium and small scales. From above result can affirm that GLI
images are very good for land cover studies.
This study affirmed capable application of GASC algorithm ones more time. Currently, defining reflectance curve
of land cover objects has still not enough. Focusing studies to develop a bank of training data for land cover
classification is necessary. If reflectance curve types of land cover objects are defined fully by invariants, this
method will become a semi automatic classification method. So that it can satisfy demands of processing a large
number of images of current sensor versions, usefully for monitoring and managing natural resource and
environment using remote sensing data.
Acknowledgement
GLI images are licensed copyright by JAXA, Japan. We warmly give thanks to JAXA provided images for this
study. We also warmly give thanks to Basic Research Program of Vietnam sponsored funds for this study.
References
[1] Nguyen Dinh Duong, Nguyen Thanh Hoan, Le Kim Thoa, 2001. Automated construction of legend for land cover
classification of ADEOS-II GLI Image - Proc ACRS’2001, Singapore. Vol. 1, pp. 239-244
[2] Le Kim Thoa, Nguyen Thanh Hoan, Nguyen Dinh Duong, 2002. Automated Classification for Vegetation of Ninh Thuan,
Binh Thuan and Lam Dong Provinces in Vietnam by Simulated GLI data from Landsat TM. Journal of the Japan Society of
Photogrammetry and Remote Sensing - 6/2002.
[3] Nguyen Dinh Duong, 2004. Land cover mapping of Vietnam using MODIS 500m 32-day global composites. Proc.
GISIDEAS2004, Vietnam.
[4] Nguyen Thanh Hoan, Nguyen Dinh Duong, 2004. Proposing a method to establish Vietnam forest map by using multitemporal GLI images and ecological models. Proc. GISIDEAS2004, Vietnam.
[5] Nguyen Dinh Duong, 2004. Monitoring of land cover in Vietnam by MODIS 32 day composites, The 14th Asian
Agricultural Symposium, Chiangmai, Thailand, 9-10, Dec. 2004
View publication stats